Vijay Khare*![]() | Sakshi Kumari
| Sakshi Kumari![]()
© 2023 IIETA. This article is published by IIETA and is licensed under the CC BY 4.0 license (http://creativecommons.org/licenses/by/4.0/).
OPEN ACCESS
Computed tomography scan (CT-scan) images show structural features of brain, while magnetic resonance imaging (MRI) images show brain tissue anatomy but do not comprise any functional information. Now it become a research challenge that how we successfully combine the images of the two modes. In this paper, CT-scan and MRI images are used for detection of brain tumor. The acquired images were pre-processed with the help of median filter and the mathematical morphological operations. These pre-processed images were registered. After registration CT-scan and MRI images fusion has been done using non-subsampled shearlet transform (NSST) and dual branch convolutional neural networks (CNNs). This method successfully retains the functional information of the CT-scan image and brain structure information and spatial distortion of the MRI image loss will reduce. Brain tumor detection is performed using cuckoo search algorithm with different fitness functions.
computed tomography scan (CT-scan), magnetic resonance imaging (MRI), brain tumor, convolutional neural network (CNN), fusion
Abnormal growth of brain cells become brain tumor. The exact cause of this abnormal growth is not clear yet. The same is the case with the symptoms. People suffering from it cannot even realize until it has blowout throughout the body and can’t be cured. Some of these tumors can be cancerous thus its detection on time is very important for cure.
Brain tumor can be broadly classified into two categories: Primary and Secondary brain tumor. Primary brain tumor are defined as the tumor that are formed in the brain itself while secondary brain tumor or metastatic brain tumor are the cancerous which are formed due to the spread of cancer from different part of body (some other organ). Further the primary can be of two types: the one growing at slow rate and hardly does any harm called as benign or the one which grows too quickly and cover the whole surface of the brain, but doesn’t fall in so called category of cancer. This kind of brain tumor is called as malignant. There are many methodologies proposed for the classification and the detection of the brain tumor. The MRI images are said to have information of soft tissues while the CT-scan images carry more information about the bone structure of the body parts. The detection of tumor from the MRI and CT-scan images totally depends on the knowledge of radiologist. Mostly radiologists were failed in detection of tumor at its early stage. So now there are many automatic detection techniques present. The methodologies proposed till now exclusively used MRI images or CT-Scan images for the detection. Therefore in this paper, we have proposed to detect the brain tumor from combined information of CT and MRI images. After pre-processing both the images, these images were registered and fused together. These fused images were further used for the detection of brain tumor through Cuckoo search algorithm.
In the last decade, many methods have been proposed for the automatic detection of brain tumors. Parveen and Amritpal Singh performed classification of MRI images by first performing pre-processing on the data in the form of skull stripping. After that they used Fuzzy C Means clustering to segment the data then they extracted Grey Level Run Length Matrix (GLRLM) and used SVM (Support vector machine) to classify the results. This has provided an effective result for the classification of brain tumor [1].
Guruvasuki and Arasi [2] first pre-processed the data by median filter then Gray Level Co-occurrence Matrix (GLCM) was extracted as feature which was further classified through Multi Support Vector Machine (M-SVM).
Zhang et al. [3] proposed a neural network based method for classification of the brain images as normal or abnormal. They first applied wavelet transform to extract features on which they applied Principle Component Analysis (PCA) in order to reduce the dimensions available in features which were then sent to back propagation with which scaled conjugate gradient was adopted for the optimal weights of the neural network.
Chaplot et al. [4] proposed a novel method in which they used wavelets as the inputs for self-organizing maps of neural network and then used SVM for further classification which gave an accuracy of 98%.
Jain et al. [5] proposed methods of segmentation of brain tumor in MATLAB. They used global thresholding method for the segmentation process.
Sinha and Sinha [6] had proposed a comparative of three segmentation methods for the detection of brain tumor. These methods were k-means clustering using watershed algorithm, k-means clustering with genetic algorithm and optimized c-means clustering with genetic algorithm. It was shown that c-means provided efficient results.
Gong et al. [7] improvised the Fuzzy-C Means (FCM) by providing a trade-off between the kernel metric and the weighted fuzzy factor which resulted in a parameter free segmentation of the images.
Roy and Bandoyopadhyay [8] provided the symmetrical analysis of the tumor affected region. They provided proof with different datasets that were not only of different patients but also of different regions of the body. They also proved that the MRI images provided better results in the detection than any other medical images [8].
Zhang et al. [9] provided an unsupervised training for the neural architecture. They also compared subjective and the supervised methods for the tumor detection [9].
Al-Tamimi and Sulong [10] presented two algorithms for image segmentation: mean-shift based segmentation and graph-based segmentation. Nowadays both methods of segmentation are used readily.
In this work, information of the soft tissues and bone structure are combined together before the detection of the brain tumor. The soft tissue information has been obtained using MRI and bone structure data has been obtained using CT scan. The key reason behind this idea is to have better and faster detection of the brain tumor for clinical purposes.
This work can be vastly divided into three categories:
·The images acquired were pre-processed with the help of median filter and the mathematical morphological operations.
·These pre-processed images were registered and fused together. The fusion was done using CNN and NSST.
·The fused images were used for the detection of brain tumor with cuckoo search algorithm with different fitness function.
The data was acquired by cancer imaging site as well as some of the data was collected from AIIMS lab which consists of two types of data: 1. CT and 2. MRI. The total dataset consists of 11 patients having both types of data.
3.1 Pre-processing of acquired data
The pre-processing of the acquired CT and MRI images were done in two steps. The first step was passing these images through median filter [11-15]. The Median filter is a nonlinear technique that is commonly used for image de-noising. It operates by replacing each pixel's value with the median of the pixel values located within a defined window or kernel size. The filter is especially useful for removing salt-and-pepper noise, which can corrupt individual pixels in an image, causing them to appear much brighter or darker than their neighboring pixels. This filter works by analyzing a pixel window centered on each pixel in the image. The pixel values within the window are then sorted, and the median value is selected as the new value for the center pixel. The median value is the middle value in the sorted list of pixel values.
Compared to other smoothing filters, the Median filter is particularly effective in preserving edges and small details in the image. However, if the window size is too large, it may also cause some blurring in the image.
The median filter collects only the important pixel when a window is slide over the input image which was very helpful in removing the patient artifacts from the images [16-20]. It mainly removes the salt and pepper type noise from the given image. The output of the median filter is shown in Figure 1.
Figure 1. (a) The input image given to median filter, (b) The output of the median filter with no artifacts
The second step of the pre-processing required the removal of extra skull that was present in the input image. This skull was not use for further processing. This was done with the help of mathematical morphological operations. The morphological process involved erosion, dilation, opening and closing of the images. The output obtained from the mathematical morphological operations is shown in Figure 2.
Figure 2. (a) Input image to morphology process with bones, (b) Output after the morphology process containing no bone
3.2 Image registration
The process of combining the information from different input images to a single normalized frame of reference is image registration. The different images can be of many types such as image of the same object from different angles, image of the same object using different cameras like normal and infrared camera, etc. [21-26]. The image registration particularly used in this work is called multi-modal registration in which images are registered together of different modalities. The images after registration are useful in providing the information related to structure or the function of the organ whose images are registered. The three components that are necessary to be defined for any image to be registered are: transformation model, similarity matrix and an optimization method [27]. The transformation model can fall in two categories: rigid model or non-rigid models. Rigid models are the models that introduce rigid distortions in the registered images. Rigid distortions can be in the form of translation or rotation or scaling or a combination of all three which is commonly known as affine transformation [28]. The non-rigid models provide more general deformations occurring in the registered images. For this work, rigid transformation in the form of affine transformation has been used as the transformation model for the process of registration. Similarity metrics checks the similarity between the output after the transformation model and that of the actual transformation that we should be getting. The three most commonly used similarity metrics are: Normalized cross-correlation, correlation ratio and mutual information. Normalized cross-correlation assumes a linear relationship between the pixels of the two images while correlation ratio assumes that of a non-linear function dependency between the pixels of the two images. Mutual information is a concept taken from information theory that measures the amount of information a variable gives about another variable [29]. Optimization uses derivative as well as non-derivative methods to select the parameters to minimize the similarity metric [30-34]. Here, interpolation method has been used for the optimization technique. The algorithm showing the process of registration is shown in Figure 3.
Figure 3. Registration algorithm
The input images are now ready for the next step of the process for the detection of brain tumor. This step involves the registration of the CT and the MRI images. By the registration of the images these images were structurally align which was further used in the process of fusion. The input images and the output of the registration process is shown in Figure 4.
Figure 4. (a) Fixed input image, (b) Input image taken to be moving, (c) Output registered image
3.3 Image fusion
The dual-branch convolutional network used in the current study mixes the pixel activity data from two input images. The NSST decomposition is then applied to the network's outputs. The source images and the initial weights are subjected to the NSST, which produces low-frequency and high-frequency coefficients. A novel fusion technique is used to combine the initial part of the low-frequency coefficients, which tackles two key issues in the fusion process: energy conservation and detail extraction. On the other hand, a method that takes into consideration the weight map's spatial frequency is utilized to fuse the second part of the low-frequency coefficients. Moreover, the high-frequency elements of the initial weight fuse the high-frequency coefficients. The final image is then rebuilt using inverse NSST. This method is effectively performed for medical image fusion.
3.3.1 Non-subsampled shearlet transform
The NSST is a widely-used image decomposition method that is well-known for its ability to capture multi-directional edges and efficiently handle singularities in images. It decomposes images into sub-bands with different directional sensitivities, allowing it to represent various image structures and features more accurately. NSST has been effectively utilized in a variety of image processing applications, such as image denoising, image fusion, and image compression.
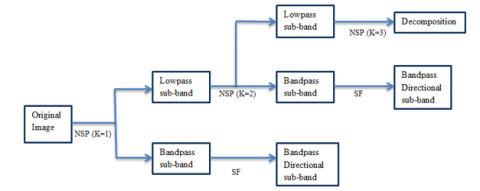
The NSST is a signal processing technique that overcomes the limitations of the contourlet transform by utilizing the non-sampling pyramid transformation (NSP) and shearlet filters (SF) to achieve shift invariance. The NSP provides a multiscale analysis with translation-invariant filter structures, similar to the LP decomposition, while the SF is a sparse representation method for complex functions that uses a synthetic expansion affine system. By combining the 2D NSP and SF, the NSST produces a filtering structure that ideally partitions the frequency plane. A block diagram of the NSST decomposition process is illustrated in Figure 5.
Figure 5. The NSST decomposition block diagram
3.3.2 Convolutional neural network
Convolutional, pooling, and fully linked layers make up a CNN's three primary types of layers. The original image is preprocessed in the input layer. Two crucial processes are carried out by the convolutional layer, which is the core element of a CNN: sliding window and local associations. The process' main purpose is to extract characteristics. The pooling layer, which is sandwiched between subsequent convolutional layers, is mostly in charge of compressing images. Overfitting is avoided while the feature dimension is decreased by the pooling layer [33, 35].
The final layer of the CNN is the fully connected output layer, which maps the features extracted from the network's end to the output category tags.
Meanwhile, the Dual Branch CNN architecture has recently received significant attention for its effectiveness in feature extraction and classification tasks. It consists of two branches, one for processing spatial information and the other for processing channel information. By using the dual branch architecture, the network can capture both local and global features of the input image more efficiently.
Figure 6. Dual branch convolutional neural network architecture
The used CNN design, shown in Figure 6, is a Siamese network with the same structure and weights distributed over its two branches. Three convolutional layers and a max-pooling layer make up each branch. A fully connected layer, which functions as the weight assignment component of two fusion algorithms, is fed the concatenated resultant feature maps of both branches.
The dual-branch network's 2-dimensional vector transformation of the input images A and B is followed by a SoftMax layer, which results in a probability distribution with two classes, 0 or 1. The process of giving a value to each pixel within the location and averaging the overlapped pixels results in the creation of a weight map S [36, 37].
3.3.3 Fusion strategy
There are many fusion strategies for combine MRI and CT-scan like: Multi modal registration, Wavelet transform-based method, Non negative matrix factorization (NMF), CNN, PCA, NSST etc.
In this approach, we present a fusion approach that combines CNNs and NSST to take advantage of both techniques.
When NSST and dual branch CNN are combined, they form a robust fusion framework that leverages the advantages of both techniques. The NSST can decompose the image into multi-scale sub-bands and provide detailed information about its directional features, while the dual branch CNN can extract high-level features from the decomposed image to enable more accurate classification and feature representation. This fusion framework has demonstrated promising results in various image processing tasks, including image fusion and super-resolution, and has become a popular choice among researchers in the field.
The source images are first divided into low-frequency coefficients and high-frequency coefficients using the NSST method. Moreover, the WS weight is divided into different scales {WSL, WSHK}. The weight's high-frequency component is used to construct the fused high-frequency coefficients (HFlk) by fusing the high-frequency coefficients {HAlk, HBlk}. The first component of the low-frequency coefficients, {LA1, LB1} is fused individually utilizing a unique technique to overcome energy conservation and detail extraction issues. The spatial frequency of the low-frequency component of the weight, WSL, is fused with the second component of the low-frequency coefficients {LA2, LB2} known as low2. The final image is then recreated using the inverse NSST. We tested the efficiency of our methodology utilizing pairs of multimodality brain picture fusion, and we found that it worked effectively, especially for medical image fusion, as shown in Figure 7.
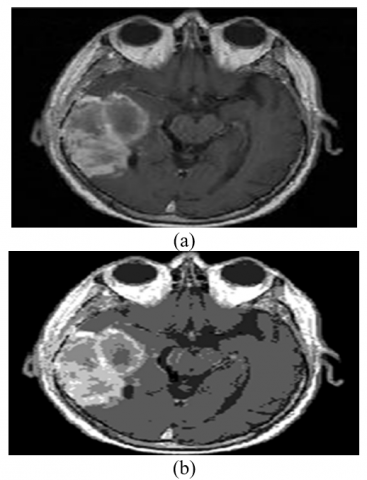
Figure 7. (a) input MRI image, (b) input CT image, (c) fused image
3.4 Cuckoo search algorithm for tumor detection
The Cuckoo Search Algorithm is a nature-inspired optimization technique that imitates the behavior of cuckoo birds during their reproduction process. This algorithm has several distinguishing features that set it apart from other optimization algorithms:
(1) Randomness: The Cuckoo Search Algorithm utilizes a stochastic approach that involves randomization to achieve a more diverse and effective search.
(2) No constraints: The algorithm does not necessitate any restrictions on the optimization problem, making it more flexible and adaptable to various problem types.
(3) Simplicity: The algorithm is simple and straightforward to implement, which is beneficial for researchers and practitioners with limited resources.
(4) Global search: The algorithm is designed for global optimization problems, allowing it to search the entire solution space to locate the optimal solution.
(5) Self-organization: The algorithm has the ability to self-organize and adapt to the problem's search space, which can result in improved convergence and accuracy.
(6) Parallelization: The algorithm can be parallelized, which makes it suitable for solving large-scale optimization problems.
The Cuckoo Search algorithm comprises three primary rules, as described in researches [31-33]:
(1) Each cuckoo lays one egg at a time and places it in a randomly selected nest.
(2) The nests with the best eggs are carried over to the next generation.
(3) If a host bird discovers a cuckoo egg, the egg has a probability of being detected and discarded by the host bird with a probability of pa $\in$ [0, 1].
The fitness of a solution can be correlated with the value of the objective function when attempting to optimize fitness. The fitness function employed in other genetic algorithms can be compared to this fitness. Each egg in a nest represents a particular answer, and each egg added to the nest indicates a fresh approach. The method aims to apply stronger and more efficient solutions, represented by cuckoos, in place of weaker and less efficient ones. There is only one egg in each nest for simplicity's sake.
The following list summarises the basic steps of the Cuckoo Search algorithm:
(1) Set the control settings, including the upper and lower boundaries and the number of host nests (n).
(2) Produce a haphazard host nest population.
(3) Determine each nest's fitness value and select the best one.
(4) Create fresh nests using the Levy Fly Algorithm and the Cuckoo Search algorithm.
(5) Determine each new nest's fitness value and select the best one.
(6) Compare the selected nests and stick with the winning one.
(7) Choose the best solution while optimising.
In conclusion, the Cuckoo Search Algorithm is a potent optimization algorithm that combines simplicity, randomness, and global search to efficiently solve complex optimization problems. Its distinctive features make it an appealing option for researchers and practitioners in various fields of study.
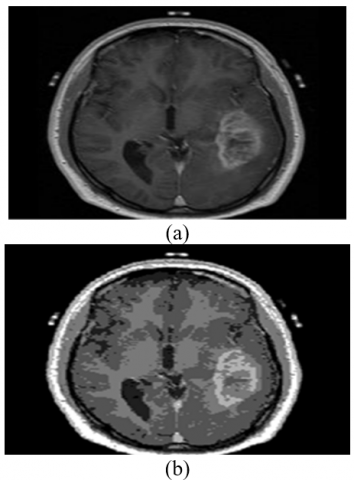
The fused images were processed through cuckoo search algorithm for the detection of the tumor region. The cuckoo search algorithm had three different kinds of fitness function: Otsu’s thresholding, Kapur’s Entropy and Tsallius entropy. Figures 6 and 7 illustrated the output of the cuckoo search algorithm. The tumor region can be seen clearly from the outputs. The outputs of the different fitness are mentioned briefly in the figure description only.
It can be seen clearly from the output images that the Kapur’s entropy as fitness function of the cuckoo search provides the best result. The Tsallius’s entropy as a fitness function of cuckoo search output depends on the kind of input image the algorithm receives as it can be seen from the images that it provides better result in the case on second image while not that much in first case. While the Otsu’s thresholding doesn’t provide the best result but they are simpler with respect to other fitness function and can be applied in the cases where images have distinct and only binary classes as shown in Figures 8 and 9.
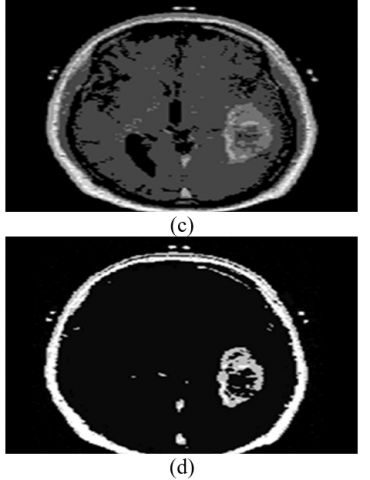
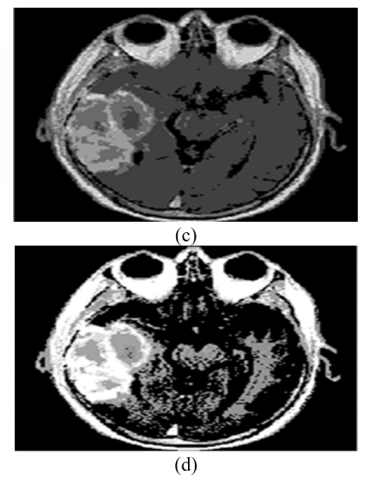
Figure 8. (a) input fused image for cuckoo search algorithm, (b) tumor region obtained by Otsu’s thresholding function as fitness function, (c) tumor region obtained by Tsallius entropy as fitness function, (d) tumor region obtained by Kapur’s entropy as fitness function
Figure 9. (a) input fused image for cuckoo search algorithm, (b) tumor region obtained by Otsu’s thresholding function as fitness function, (c) tumor region obtained by Tsallius entropy as fitness function, (d) tumor region obtained by Kapur’s entropy as fitness function
Once the data was acquired which comprised of CT and MRI images of around 11 patients. These images were first pre-processed in order to remove different noises. Firstly these images were passed through median filter in order to the patient artifacts present in the images. Once the artifacts were removed, these images were passed through the morphological process which removed the additional skull or bony structure present in the image that act as noise and provide as such no information for further process.
These pre-processed images were then registered together to provide a structural alignment to the image. The registered image was then fused using NSST and dual branch CNN. The process of fusion was useful in combining the information from both CT and MRI images. The cuckoo search algorithm was applied on the fused images. The cuckoo search used three types of fitness function namely, Otsu’s thresholding, Kapur’s entropy and Tsallius entropy. Out of the three fitness function Kapur’s entropy provided the best result. Otsu’s thresholding method didn’t provide satisfactory result but they were very easy to implement and show best results in case of binary classes. Tsallius entropy gets computed in the least time of all the fitness function. For future there could be involvement of other different kind of images like SPECT, etc. in the fusion process and then use them for the detection algorithm. Also, the detection algorithm could be improvised to provide better accuracy in the tumor region and could be able to give its dimensions. At last, the whole process could be applied to any other part of the body for the tumor detection.
There are also some limitations of the study: Sample size used in this paper is small, there we use limited image types only used MRI and CT-scan images and in this method only used three fitness functions for the Cuckoo search algorithm, which may not be sufficient to optimize the image fusion process.
We also use this method for other disease detection from MRI images or any other medical scan images.
We are delighted to extend our sincere thanks and deepest sense of gratitude to the Department of Electronics and Communication at Jaypee Institute of Information Technology for affording us the opportunity to present our work.
[1] Singh, A. (2015). Detection of brain tumor in MRI images, using combination of fuzzy c-means and SVM. In 2015 2nd International Conference on Signal Processing and Integrated Networks (SPIN), pp. 98-102. http://dx.doi.org/10.1109/SPIN.2015.7095308
[2] Guruvasuki, R., Arasi, A.J.P. (2000). MRI brain image retrieval using multi support vector machine classifier. International Journal of Advanced Information Science and Technology, 10(10): 29-36.
[3] Zhang, Y., Dong, Z.C., Wu, L., Wang, S. (2011). A hybrid method for MRI brain image classification. Expert System and Application, 20(2): 10049-10053. http://dx.doi.org/10.1016/j.eswa.2011.02.012
[4] Chaplot, S., Patnaik, L.M., Jagannathan, N.R. (2006). Classification of magnetic resonance brain images using wavelets as input to support vector machine and neural network. Biomedical Signal Processing and Control, 1(1): 86-92. http://dx.doi.org/10.1016/j.bspc.2006.05.002
[5] Jain, M., Jaiswal, S., Maurya, S., Yadav, M. (2015). A Novel approach for the detection and analysis of brain tumor. International Journal of Emerging Technology and Advanced Engineering, 5(4): 54-59.
[6] Sinha, K., Sinha, G.R. (2014). Efficient segmentation methods for tumor detection in MRI images. In 2014 IEEE Students' Conference on Electrical, Electronics and Computer Science, Bhopal, India, pp. 1-6. https://doi.org/10.1109/SCEECS.2014.6804437
[7] Gong, M., Liang, Y., Shi, J., Ma, W., Ma, J. (2012). Fuzzy c-means clustering with local information and kernel metric for image segmentation. IEEE Transactions on Image Processing, 22(2): 573-584. http://dx.doi.org/10.1109/TIP.2012.2219547
[8] Roy, S., Bandoyopadhyay, S.K. (2012). Detection and qualification of brain tumor from mri of brain and symmetric analysis. International Journal of Information and Communication Technology Research, 2(6): 584-588.
[9] Zhang, H., Fritts, J.E., Goldman, S.A. (2008). Image segmentation evaluation: A survey of unsupervised methods. Computer Vision and Image Understanding, 110(2): 260-280. http://dx.doi.org/10.1016/j.cviu.2007.08.003
[10] Al-Tamimi, M.S.H., Sulong, G. (2014). Tumor brain detection through mr images: A review of literature. Journal of Theoretical & Applied Information Technology, 62(2): 387-403. http://www.jatit.org/volumes/Vol62No2/11Vol62No2.pdf
[11] Liu, G., Guo, W. (2010). Application of improved arithmetic of median filtering denoising. Computer Engineering and Applications, 46(10): 187-189. http://dx.doi.org/10.3778/j.issn.1002-8331.2010.10.059
[12] Wang, X.K., Li, F. (2010). Improved adaptive median filtering. Computer Engineering and Applications, 46(3): 175-176.
[13] Wang, C., Ye, Z. (2008). Salt-and-pepper noise removal by adaptive median filter and TV inpainting. Journal of University of Science and Technology of China, 38(3): 282-287.
[14] Huang, Q., Zhou, H., Feng, H. (2002). A fast and effective algorithm of pulse noise filtering for imaging data. Computer Engineering and Applications, 210(17): 113-114.
[15] Vujovic, N., Brzakovic, D. (1997). Establishing the correspondence between control points in pairs of mammographic images. IEEE Transactions on Image Processing, 6(10): 1388-1399. http://dx.doi.org/10.1109/83.624955
[16] Althof, R.J., Wind, M.G., Dobbins, J.T. (1997). A rapid and automatic image registration algorithm with subpixel accuracy. IEEE Transactions on Medical Imaging, 16(3): 308-316. http://dx.doi.org/10.1109/42.585765
[17] Barnea, D.I., Silverman, H.F. (1972). A class of algorithms for fast digital image registration. IEEE Transactions on Computers, 100(2): 179-186. https://doi.org/10.1109/TC.1972.5008923
[18] Pratt, W.K. (1974). Correlation techniques of image registration. IEEE Transactions on Aerospace and Electronic Systems, 10(3): 353-358. https://doi.org/10.1109/TAES.1974.307828
[19] Berthilsson, R. (1998). Affine correlation. Proceedings of the International Conference on Pattern Recognition ICPR’98, Brisbane, Australia, pp. 1458-1461. http://dx.doi.org/10.1109/ICPR.1998.711979
[20] Simper, A. (1996). Correcting general band-to-band misregistrations. In Proceedings of the IEEE International Conference on Image Processing ICIP’96, Lausanne, Switzerland, pp. 597-600. http://dx.doi.org/10.1109/ICIP.1996.560932
[21] Tang, Z., Ahmad, S., Yap, P.T., Shen, D. (2018). Multi-atlas segmentation of MR tumor brain images using low-rank based image recovery. IEEE Transactions on Medical Imaging, 37(10): 2224-2235. https://doi.org/10.1109/TMI.2018.2824243
[22] Ritter, N., Owens, R., Cooper, J., Eikelboom, R.H., Van Saarloos, P.P. (1999). Registration of stereo and temporal images of the retina. IEEE Transactions on Medical Imaging, 18(5): 404-418. http://dx.doi.org/10.1109/42.774168
[23] Studholme, C., Hill, D.L., Hawkes, D.J. (1999). An overlap invariant entropy measure of 3D medical image alignment. Pattern Recognition, 32(1): 71-86. http://dx.doi.org/10.1016/S0031-3203(98)00091-0
[24] Gatys, L.A., Ecker, A.S., Bethge, M. (2016). Image style transfer using convolutional neural networks. In Proceedings of the IEEE Conference on Computer Vision and Pattern Recognition, pp. 2414-2423. https://doi.org/10.1109/CVPR.2016.265
[25] Viola, P., Jones, M. (2001). Rapid object detection using a boosted cascade of simple features. In Proceedings of the 2001 IEEE Computer Society Conference on Computer Vision and Pattern Recognition, CVPR 2001, Kauai, HI, USA, pp. I-I. https://doi.org/10.1109/CVPR.2001.990517
[26] Dai, J., He, K., Sun, J. (2016). Instance-aware semantic segmentation via multi-task network cascades. In Proceedings of the IEEE Conference on Computer Vision and Pattern Recognition, pp. 3150-3158. https://doi.org/10.1109/CVPR.2016.343
[27] Luan, F., Paris, S., Shechtman, E., Bala, K. (2017). Deep photo style transfer. In Proceedings of the IEEE Conference on Computer Vision and Pattern Recognition, pp. 4990-4998.
[28] Castillo, C., De, S., Han, X., Singh, B., Yana, A.K., Goldstein, T. (2017). Targeted style transfer using instance- aware semantic segmentation. In 2017 IEEE International Conference on Acoustics, Speech and Signal Processing (ICASSP), New Orleans, LA, USA. https://doi.org/10.1109/ICASSP.2017.7952376
[29] Scheleyer, G., Cubillos, C., Lefranc, G., Osorio-Comparán, R., Millán, G. (2016). A new colour image segmentation. In 2016 6th International Conference on Computers Communications and Control (ICCCC), Oradea, Romania, pp. 232-239. https://doi.org/10.1109/ICCCC.2016.7496766
[30] Palaiah, A., Prabhu, A.H., Agrawal, R., Natarajan, S. (2016). Clustering using Cuckoo search levy flight. In 2016 International Conference on Advances in Computing, Communications and Informatics (ICACCI), p. 692. https://doi.org/10.1109/ICACCI.2016.7732106
[31] Zhang, M., He, D.X., Zhu, C.L. (2016). Cuckoo search algorithm based on hybrid-mutation. In 2016 12th International Conference on Computational Intelligence and Security (CIS), pp. 538-542. https://doi.org/10.1109/CIS.2016.0131
[32] Zhang, J., Hu, J. (2008). Image segmentation based on 2D Otsu method with histogram analysis. In 2008 International Conference on Computer Science and Software Engineering, pp. 105-108. https://doi.org/10.1109/CSSE.2008.206
[33] Rajinikanth, V., Raja, N.S.M., Satapathy, S.C. (2016). Robust color image multi-thresholding using between-class variance and cuckoo search algorithm. Advances in Intelligent Systems and Computing, 379-386. https://doi.org/10.1007/978-81-322-2755-7_40
[34] Iqbal, S., Ghani Khan, M.U., Saba, T., Mehmood, Z., Javaid, N., Rehman, A., Abbasi, R. (2019). Deep learning model integrating features and novel classifiers fusion for brain tumor segmentation. Microscopy Research and Technique, 82(8): 1302-1315. https://doi.org/10.1002/jemt.23281
[35] Handa, A., Garg, P., Khare, V. (2018). Masked neural style transfer using convolutional neural networks. In 2018 International Conference on Recent Innovations in Electrical, Electronics & Communication Engineering (ICRIEECE), pp. 2099-2104. https://doi.org/10.1109/ICRIEECE44171.2018.9008937
[36] Zhang, D., Huang, G., Zhang, Q., Han, J., Han, J., Yu, Y. (2021). Cross-modality deep feature learning for brain tumor segmentation. Pattern Recognit. https://doi.org/10.1016/j.patcog.2020.107562
[37] Khosravanian, A., Rahmanimanesh, M., Keshavarzi, P., Mozaffari, S. (2021). Fast level set method for glioma brain tumor segmentation based on Superpixel fuzzy clustering and lattice Boltzmann method. Computer Methods and Programs in Biomedicine, 198: 105809. https://doi.org/10.1016/j.cmpb.2020.105809