Gutta Srinivasa Rao* | Atluri Srikrishna
© 2021 IIETA. This article is published by IIETA and is licensed under the CC BY 4.0 license (http://creativecommons.org/licenses/by/4.0/).
OPEN ACCESS
Image Enhancement methods produce various sorts of problems, for example, unnatural impacts, over-improvement, and these downsides become increasingly unmistakable in improving dull Images. Histogram Equalization (HE) method is a straightforward and generally utilized Image contrast enhancement procedure. The fundamental task of HE is it changes the contrast of the Image. To perform this task, different HE techniques have been proposed. These techniques protect the brightness or contrast on the final Image that doesn't have a characteristic look. To overcome the drawbacks of HE, Enhanced Multi Histogram Equalization (EMHE) technique is proposed, which divide the Image into a few sub images and again these sub images are divided into sub-images, and traditional HE strategy is applied to each sub Image for getting better results. The improvement is brought about by repetitive data present in sub-pixel moves between relating Lightroom (LR) Images of a similar scene. The principal phase of the development incorporates Image enrollment of LR Images utilizing known parameters and geo-referencing methods for manufactured and genuine information individually. The proposed development of M-HE Images has been assessed on the LR Images obtained from satellite Image datasets to exhibit the clarity of the images by enhancing the contrast on the poor lighting images.
image contrast enhancement, histogram equalization, poor lightening images, Multi- HE method
Enhancement of Image Quality is a complex task and a necessary action to develop the visual character of a Image with more quality. The image quality might be corrupted for a few causes like the absence of administrator skill and nature of Image catching gadget. Images are caught in bright, dim, or any abandoned conditions. Also, if a Image is caught in excessively bright or too dull condition, at that point Quality Enhancement is fundamental for making better looking Images. Besides, occasions, for example, checking or transmitting an Image starting with one spot then onto the next may make brighter [1].
Image differentiate Quality Enhancement is an old style issue in Image preparing methodology. Image Quality Enhancement is considered as a preprocessing step in numerous regions like video/Image preparing applications, surface combination and so forth. Quality Enhancement systems mostly fall into two general classes: spatial space strategies and recurrence area techniques. Spatial space systems are more famous than the recurrence based techniques, since they depend on direct control of pixels in an Image [2, 3]. Cluster spatial space strategies have been produced for picturing the impact [4]. A portion of these techniques utilizes straightforward direct or non-direct force level change capacities, while others utilize complex examination of various Image features, for example, the edge and associated segment data.
Quality Enhancement issue in advanced Images can be settled utilizing different procedures, however Histogram Equalization (HE) method is the generally utilized one. Histogram Equalization technique straightens the histogram and stretches the dynamic scope of power values by utilizing the combined depth work. There are significant disadvantages in Histogram Equalization [5] particularly when actualized to process computerized Images. HE changes the histogram of the info Image into a uniform histogram by conveying the whole scope of dark levels consistently over the histogram of a Image, with a mean worth that is in dim level range [6].
So as to conquer these disadvantages, variations of Histogram Equalization technique are proposed. These incorporate Brightness BI Histogram Equalization Method (BBHE), Dualistic sub Image Histogram Equalization Method (DSIHE), Minimum Mean Brightness Error BI Histogram Equalization Method (MMBEBHE). BBHE Method partitions the Image into two sub Images dependent on the mean force estimation of the information Image, and Histogram Equalization strategy is applied for each sub Image independently [7]. In view of the Equal Region Property DSIHE strategy deteriorates the Image in to two sub Images and Histogram Equalization procedure is applied for both the sub Images.
Recursive Mean Separate Histogram Equalization Method (RMSHE) disintegrates the information recursively dependent on mean, up to a level r, consequently 2r sub Images are created [8]. These sub Images are evened out exclusively to acquire the ideal outcome. Sub-Region Histogram Equalization is a differentiation improvement technique which isolates the power scope of the histogram into k sub-areas and redistributes the pixel powers dependent on Sub-Intensity Range of yield histogram. The process of dividing image into sub image is depicted in Figure 1.
There is a solid impact of differentiation proportion on recognition ability of Images. Systems for improving Image differentiate are among the most broadly utilized improvement forms [9]. The affectability scope of any remote detecting indicator is intended to record a wide scope of landscape brightness from dark levels under a wide scope of lighting conditions [10]. Hardly any individual scenes have a brightness that uses the full affectability scope of these finders.
Figure 1. Sub image division
In Image quality enhancement method, the contrast of the caught satellite picture is in many cases expressed as the most significant issue [11]. The complexity is shaped by change in luminance reflected from two touching surfaces. The visual arrangement of human is additional delicate to the complexity than perfect luminance [12, 13]. So in visual keenness, the change in the brilliance and shade of an article with different items decides the complexity [14]. The issue is to expand the complexity of a picture in structure to communicate to all the data in the information picture [15]. The proposed model considers a image and then performs segmentation on it and then the sub images are also undergo segmentation. Image pixel enhancement is applied on every pixel on the sub images for getting better enhancement levels.
Enahnced Multi Histogram Equalization is a technique for processing images by changing the histogram's intensity distribution in order to change the contrast of an image. The purpose of this technique is to give the cumulative likelihood function associated with the image a linear pattern. The proposed method generally increases the global image contrast when near contrast values are represented by its accessible data. This makes it possible to achieve a higher contrast for areas with lower local contrast.
The added substance arrangement of essential colors (red, green, and blue, or RGB system) is well-established [16]. A alternate way to deal with shading is the authority, quality and importance framework [17] with intensity, hue and saturation (IHS), which is valuable since it presents hues all the more almost as the human spectator sees them.
Huang et al. [1] discussed about complexity extending and Image sharpening strategies. It is a methodology that simultaneously alters complexity and Quality Enhancements limits of an Image. On the dark scale, Image differentiation extending is applied and afterward it continues to Laplacian level, lastly, Laplacian Image is affixed to the first dim scale Image to acquire the ideal sharpened Image.
Wong et al. [2] proposed Image Quality Enhancement utilizing wavelet-based technique that change with cycle interpretation. In this, wavelet change is utilized for reducing of the excess occurrence in the first technique for contour let change. Finally, to intensify the Images, versatile Quality Enhancement work is chosen. The proposed strategy can effectively intensify the Images and reduce the time for applying the operations.
Yousif et al. [4] proposed shading Image differentiate Quality Enhancement method. RGB Image is changed to quality, fascination, and value shading space. The lower directional sub band is utilized for renewal. By changing HSV to RGB shading space, the improved Image is obtained. From proposed DST-based differentiation Image Quality Enhancement approach, the good outcome is accomplished.
Singh et al. [7] proposed a quick calculation for raising the difference of an Image locally by utilizing solitary worth decay approach. The differentiation of an incompletely debased Image is amplified by utilizing this methodology. Under worldwide and incomplete corruption, the strategy is done appropriately and a decent quality subsequent to preparing image is accomplished.
Irmak and Ertas [11] depicted the Laplacian and Gaussian techniques and found a redesigned Laplacian Image contrast enhancement strategy. Laplacian Quality Enhancements, there is a answer for the shading distinction between the littler Image detail improvement and for the huge contrast in the shading Image Quality Enhancement, the impact is exceptionally self-evident.
Bhattacharya et al. [13] proposed a method for Nonlinear Enhancement of images. Reproduction and distinguishing procedures are utilized alongside the NIE technique. This procedure utilizes cutting and scaling limitations which are a suitable mix of different Images. This procedure improves the nature of obscured Image and a superior quality as accomplished, and noise ratio execution is considered when contrasted with other Quality Enhancement methods.
Wang [15] discussed about the stepwise contrast enhancement strategy. The primary target of this strategy is the manner by which to perceive and improve the specific bit of a computerized Image, and keeping up other data of the article by keeping it unaltered. So stepwise enhancement strategy is utilized to make sense of the issue. It includes Image pre-handling, acknowledgment and Quality Enhancement.
The main idea of the proposed methodology is to apply HE technique for the improvement of contrast levels of the images. The satellite image dataset is considered for contrast improvement of images to make the images more clear for providing or taking security actions [18].
The proposed method initially considers the images and then divides the images into sub-images. Again these sub images are divided into sub images and then HE methods are applied for getting better output.
Let I ={I(i, j,l)} is an information Image with K discrete dim levels {I0, I1, … ., IK-1},
where, I(i, j,l) is the strength of the Image at the 3D position (i, j,l) and I(i, j,l) € {I0, I1,..,IK-1},
P(I) = {m0, m1,… , mn,… , rK-1} is the histogram of the Image and r is the all out number of pixels in a Image.
The darkness of the Image is calculated as
D(I)=nP/r (1)
where, nP is the quantity of pixels whose dim level is IK and r is the total pixels count.
Histogram balance H[i] can be determined as
H[i]={(G-1)/(a*b)}*c[i] (2)
where, G is the quantity of dim level in a Image and a, b is number of lines and number of sections in the Image and c is the threshold considered.
The given image is partitioned into various sub images as
$l_{\sigma}\left(I\left[l_{s}, l_{f}\right]\right)=\sqrt{\sum_{l=l_{s}}^{l_{f}}\left(l-l_{m}\left(I\left[l_{s}, l_{f}\right]\right)\right)^{2} \times P_{l}^{I\left[l_{s}, l_{f}\right]}}$ (3)
Here l is the level of pixel intensity, P is the Pixel considered from image, $l_{s}, l_{f}$ are the adjacent pixels considered for considering partion of images.
After dividing the images into sub images, again these sub images are divided into parts as
$n e w_{-} p d f_{s u b^{i, 4}}=\left(\frac{e^{p d f_{s u b} i, 4}-e^{-p d f_{s u b} i, 4}}{e^{p d f_{s u b}^{i, 4}+e^{-p d f_{s u b} i, 4}}}\right)$ (4)
for $l=l_{l o w}^{i, 4}, \ldots . ., l_{u p}^{i, 4}$ (5)
$e^{p d f} s u b^{i, 4}$ consideres the sub image from a segment of a image with exact boundaries. The threshold calculation for gaussian smoothing for reducing the noise levels of the pixels in the image is represented in the below algorithm.
Algorithm 1: Calculation of Threshold For Gaussian Smoothing
Input -- Histogram H1
Output : A threshold, $\lambda$.
Begin
$H_{2} \leftarrow$ sort $H_{1}($ descending $)$
$\lambda_{1} \leftarrow H_{2}(0)$
$\lambda_{2} \leftarrow H_{2}(225)$
$\mathrm{i} \leftarrow 1$
while ($\lambda_{1}>\lambda_{2}$) do
while ($\left.\left(\lambda_{1}, \lambda_{2}\right) \in \mathrm{H}_{1}\right)$) do
$\lambda \leftarrow \lambda_{1}$
$\lambda_{1} \leftarrow \frac{\lambda_{1}+H_{1}(i)}{2}$
$\lambda_{1} \leftarrow \frac{\lambda_{1}+H_{1}(i)}{2} * \lambda_{2}$
$\lambda_{2} \leftarrow \frac{\lambda_{2}+H_{2}(255-i)}{2}$
$\lambda_{2} \leftarrow \frac{\lambda_{2}+H_{1}^{2}(i)}{2} * \lambda_{1}$
$\mathrm{i} \leftarrow \mathrm{i}+1$
end while
end while
return $\lambda$
End
Here, $\lambda$ speaks to standard deviation. In an Image, explicitly in a dull Image, a few pixels may exist at not many number of pixels that are not essential to that Image. Henceforth, we propose to merge the histogram containers of such irrelevant pixels with the neighboring pixels for improving the brightness.
Algorithm 2: Histogram Significant Bit Identification
Input -- Histogram vector $H E_{1}, \lambda$ (Available in Algorithm 1)
Output: Only significant bins,Histograms $H E_{2}$.
Begin
$\mathrm{i} \leftarrow 0$
while (i < 255) do
if $\left(H E_{1}(\mathrm{i})<\lambda\right)$
$\mathrm{HE}_{2}(\mathrm{i})=0$
$H E_{2}(\mathrm{i}+1) \leftarrow H E_{1}(\mathrm{i})+H E_{1}(\mathrm{i}+1)-\mathrm{HE}_{2}(\mathrm{i})$
$H E_{2}(\mathrm{i}+1) \leftarrow H E_{1}(\mathrm{i})+H E_{1}(\mathrm{i}+1)-\mathrm{HE}_{2}(\mathrm{i})$
Else
$H E_{2}(\mathrm{i}) \leftarrow H E_{1}(\mathrm{i})$
End if
$\mathrm{i} \leftarrow \mathrm{i}+1$
end while
Return $\mathrm{HE}_{2}$
End
The algorithm 2 powerfully compute an edge ($\lambda$) from the histogram and to discover such irrelevant pixels. $\lambda$ gives a level for the gathering of a container supporting whether the nearness of the comparing force is huge or not. The algorithm outputs each container of the histogram and contrasts it with $\lambda$. In the event that the gathering is not exactly $\lambda$, the collection is added to the following container's gathering. In this manner, we break up the inconsequential pixels in a histogram for improving the image contrast.
After dividing the images into sub images, equalization method is applied for balancing the pixels in all regions. Equalization is applied as
$E Q(\varepsilon)=\frac{\lambda+\max \left(\sum_{p}(\mu=0, s=1)\right)}{\max \left(\sum_{A} \cdot\right) * s}$ (6)
Here p is the pixel considered and the basic intensity value ‘s’ is assumed as 1. A is the histogram significant bit of the pixels in images.The dilation and erosion procedures are applied on the image for pixel level distributions as
$H_{\text {dilate }}(H D)=G C(H D)^{p+1} / \varepsilon+\lambda$ (7)
$H_{\text {erode }}(H D)=1-[1-G C(H D)]^{p+1}+\lambda$ (8)
After applying HE techniques, the levels of contrast can be improved on the considered image using the algorithm 3.
Algorithm 3: Image Contrast Enhancement
Input : Input Image $I_{i n}$.
Output : Output Image, $I_{\text {out }}$.
Begin
Obtain $T_{E}$ and $T_{N E}$ from $I_{\text {in }}$ using sobel operator
Calculate $F_{E}$ and $F_{N E}$ from $T_{E}$ and $T_{N E}$ respectively
Calculate $M_{E}$ and $M_{N E}$ from $F_{E}$ and $F_{N E}$ respectively
generate $F_{E}^{\prime}$ and $F_{N E}^{\prime}$
$F_{\text {desired }} \leftarrow F_{E}^{\prime} \bigoplus F_{N E}^{\prime}$
$I_{\text {out }} \leftarrow$ Apply specification on $I_{\text {in }}$ with $F_{\text {desired }}$
End
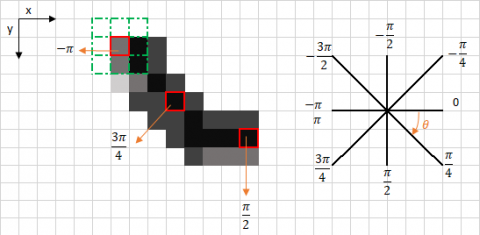
Figure 2 represents the moving of pixels starting with one area then onto the next area of the histogram.
Figure 2. Pixel Intensity Identification
The portions of the image pixels are moved dependent on the moving separation D. This moving separation is progressively determined for each fragment utilizing Eq. (3).
D(i)= xi∑N−1 (9)
i=0xi×N (10)
D(i)=xi∑N−1xi×N (11)
where, N = number of fragments, D(i) = moving separation of ith portion, xi = collection of ith section.
The median filter of the images are considered for the identification of dim images for adding the intensity levels to enhance the contrast. It is represented as
$h_{m e d}(z)=(2 w+1)\left(\frac{2 w}{w}\right) g(z) G(z)^{w}[1-G(z)]^{w}$ (12)
where
$w=\frac{1}{2}(|w|-1)$
Subsequent to moving each section, there exist a few pixels toward the end of the histogram. We correct these pixels.
Li=li+liθ×(255−θ)
Li=li+liθ×(255−θ)
where, 1i = width of the ith fragment, Li = resultant width of the ith portion, θ = finishing pixel position of the last section. Therefore, it likewise gives more space to perform intra-portion change.
The parameters considered to identify the quality of the image are Peak Signal to Noise Ratio (PSNR) , Absolute Mean Square Error (AMSE), Entropy, Structural Similarity Index (SSI), Tenengrad. The proposed method when applied on the satellite image dataset, the considered parameters are calculated for recognition of the improvement of the quality of the images.
By considering the luminance signal, the errors are identified. The Peak Signal to Noise Ratio is calculated using equation
$M S E=\frac{\sum_{p=1}^{x} \mathrm{p} \sum_{q=1}^{y} \mathrm{q}(\mathrm{T}(p, q)-G(p, q))^{2}}{x * y}$ (13)
The absolute mean square error is the difference between input and output mean and is calculated as
$A M S E=\frac{1}{G} \sum_{i=1}^{T} G|p-q|$ (14)
Entropy of image is the information of the image measurement that a human can identify. It can depict the quality of the image and calculated as
$E(p)=-\sum_{x=0}^{255} \mathrm{p}+\mathrm{q} p(x) \log _{2} q(i)$ (15)
Natural image signals are highly structured. Their pixels exhibit strong dependencies, especially when they are spatially proximate and these dependencies carry important information. The Structural Similarity Index SSI is calculated as
$S S I(p, q)=\frac{(20 p a q+c 1)(2 \pi p q+c 2)}{\left(\sigma_{p}^{2}+\sigma_{q}^{2}+c 1\right)\left(\sigma_{p}^{2}+\sigma_{q}^{2}+c 2\right)}$ (16)
Tenengrad is a powerful image quality assessment measure in terms of sharpness. Sharpness is a very helpful parameter in photographic image quality factor. It is calculated as
$T g=\sum_{i=1}^{p} g(p, q) \sum_{j=1}^{q} \mathrm{~g}(p, q)$ (17)
The proposed method uses satellite dataset for considering the images and improving the contrast of the poor quality images to enhance the contrast in those images. The proposed method considers satellite data from the https://gisgeography.com/landsat-program-satellite-imagery-bands/ link [19]. The proposed method is implemented in MATLAB 9.4. The proposed method is compared with the traditional methods and the results show that that the proposed method is better than the existing methods.
The proposed method initially divides the images into sub images and then again divides these sub images into sub images and group them as containers for applying the proposed HE methods. The image contrast enhancement process is explained in Figure 3.
Figure 3. Image contrast enhancement
Figure 4. Sub image quality and contrast enhancement
Figure 5. Image pixel extraction process
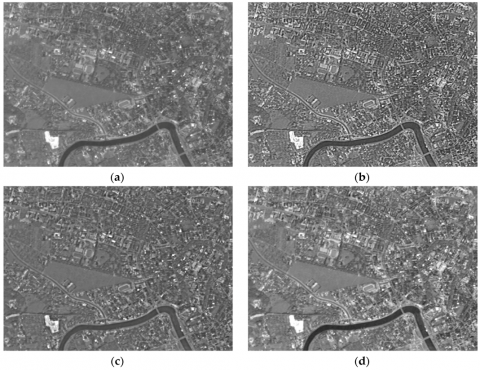
Figure 6. Image contrast enhancement
The proposed method considers the satellite images and then initially the contrast levels are calculated. After calculating the contrast levels, the proposed method is applied on the images and the pixels whose contrast levels are poor will be increased. The Table 1 illustrates the method and the contrast level identified.
The Image pixel extraction process is done more quickly in the proposed method. The Figure 4 indicates the sub image quality levels and contrast enhancement done on the images. The process is contrasted with the traditional methods and depicted in Figure 5.
The considered images are divided into sub images and the contrast will be enhanced on the images for getting better quality images [20]. The image contrast enhancement is depicted in Figure 6.
Table 1. Contrast levels identified in images
|
Method Name |
Images in the Dataset |
Min. Contrast Level Identified |
Max. Contrast Level Identified |
|
HE Method |
250 |
19% |
36% |
|
Bi-HE Method |
500 |
21% |
38% |
|
EMHE Method |
1000 |
6% |
42% |
Table 2. Contrast levels identified in images
|
Method Name |
Images in the Dataset |
Contrast Level Identified |
Contrast Level Enhanced |
|
HE Method |
250 |
20% |
25% |
|
Bi-HE Method |
500 |
16% |
36% |
|
EMHE Method |
1000 |
9% |
53% |
Table 3. Multiple parameter measures.
|
Method Name |
PSNR
|
AMSE
|
Entropy |
SSI
|
Tenengrad
|
|
|
Input |
Output |
|||||
|
HE Method |
24.45 |
17.30 |
7.65 |
7.93 |
0.98 |
5388452 |
|
Bi-HE Method |
18.33 |
16.22 |
5.33 |
6.25 |
0.76 |
865532 |
|
EMHE Method |
6.58 |
5.21 |
2.46 |
5.86 |
0.53 |
532455 |
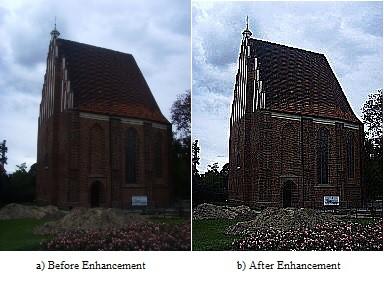
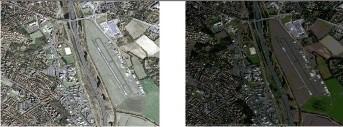
Figure 7. Image quality improvement
The satellite image when captured generally has less quality in terms of object identification and contrast level. The EHE method is applied on every dull pixel of the image and the image quality is improved. The Figure 7 illustrates the dull image captured and the levels in which the contrast levels are enhanced for object detection in image.
The Table 2 illustrates the method and the contrast level increased on the images considered from the satellite dataset.
The Table 2 specifically illustrates that the proposed method increases the contrast levels of the images and improves the image quality [21]. The different parameters are calculated and the proposed method when applied on the satellite images [22], calculated values are depicted in Table 3.
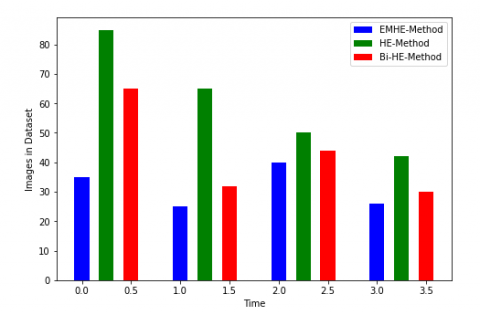
The overall accuracy level of the propsed model in improving pixel intensity is contrasted with the traditional models is indicated in Figure 8.
Figure 8. Overall image quality enhancement levels
Multi Histogram Equalization method improves Image differentiate by splendor saving and creates normal looking Images. A target examination among all the HE strategies has been performed utilizing quantitative measures AMBE (Absolute Mean Brightness Error) and Mean Square Error. It tends to be seen from the Tables that Multi Histogram Equalization Methods jelly the brilliance more effectively than different strategies and the Mean Square Error is moreover decreased. In this paper, a privately changed histogram-based method has been proposed for dull Image improvement. This technique works better when contrasted with different strategies since we don't make a difference our change strategy all in all histogram of an info Image. Or maybe, our change strategy is applied on a little portion of the information Image histogram. Thus, the proposed method doesn't get influenced from over-improvement issue. Our trial results show that it arrives at better measurements when contrasted with existing procedures. Exploratory outcomes are gotten on different therapeutic Images including an engineered Image. The Multiscale morphological methodology gives great outcomes in contrast with the outcomes acquired with other condition of-craftsmanship strategies
[1] Huang, D., Wang, Y., Song, W., Sequeira, J., Mavromatis, S. (2018). Shallow-water image enhancement using relative global histogram stretching based on adaptive parameter acquisition. In International Conference on Multimedia Modeling, 10704: 453-465. https://doi.org/10.1007/978-3-319-73603-7_37
[2] Wong, S.L., Paramesran, R., Taguchi, A. (2018). Underwater image enhancement by adaptive gray world and differential gray-levels histogram equalization. Advances in Electrical and Computer Engineering, 18(2): 109-116. https://doi.org/10.4316/AECE.2018.02014
[3] Long, M., Li, Z., Xie, X., Li, G., Wang, Z. (2018). Adaptive image enhancement based on guide image and fraction-power transformation for wireless capsule endoscopy. IEEE Transactions on Biomedical Circuits and Systems, 12(5): 993-1003. https://doi.org/10.1109/TBCAS.2018.2869530
[4] Yousif, A.S., Sheikh, U.U., Omar, Z. (2019). A novel enhancement method for medical image using double density wavelet and stationary wavelet transforms. In 2019 IEEE 9th International Conference on System Engineering and Technology (ICSET), pp. 292-297. https://doi.org/10.1109/ICSEngT.2019.8906378
[5] Qiu, T., Wen, C., Xie, K., Wen, F.Q., Sheng, G.Q., Tang, X.G. (2019). Efficient medical image enhancement based on CNN-FBB model. IET Image Processing, 13(10): 1736-1744. https://doi.org/10.1049/iet-ipr.2018.6380
[6] Yadav, V., Verma, M., Kaushik, V.D. (2016). Comparative analysis of contrast enhancement techniques of different image. IEEE Conference on Computational Intelligence and Communication Technology, Gaziabad, India, pp. 76-81. https://doi.org/10.1109/CICT.2016.24
[7] Singh, P.K., Panda, R., Sangwan, O.P. (2015). A critical analysis on software fault prediction techniques. World Applied Sciences Journal, 33(3): 371-379.
[8] Singh, P.K., Agarwal, D., Gupta, A. (2015). A systematic review on software defect prediction. In 2015 2nd International Conference on Computing for Sustainable Global Development (INDIACom), pp. 1793-1797.
[9] Negi, S.S., Bhandari, Y.S. (2014). A hybrid approach to image enhancement using contrast stretching on image sharpening and the analysis of various cases arising using histogram. In International Conference on Recent Advances and Innovations in Engineering (ICRAIE-2014), pp. 1-6. https://doi.org/10.1109/ICRAIE.2014.6909232
[10] Wu, C., Liu, Z., Jiang, H. (2014). Catenary image enhancement using wavelet-based contourlet transform with cycle translation. Optik, 125(15): 3922-3925. https://doi.org/10.1016/j.ijleo.2014.01.158
[11] Irmak, E., Ertas, A.H. (2016). A review of robust image enhancement algorithms and their applications. In 2016 IEEE Smart Energy Grid Engineering (SEGE), 371-375. https://doi.org/10.1109/SEGE.2016.7589554
[12] Premkumar, S., Parthasarathi, K.A. (2014). An efficient approach for colour image enhancement using Discrete Shearlet Transform. In Second International Conference on Current Trends in Engineering and Technology-ICCTET 2014, pp. 363-366. https://doi.org/10.1109/ICCTET.2014.6966316
[13] Bhattacharya, S., Gupta, S., Subramanian, V.K. (2014). Localized image enhancement, published in Twentieth National Conference on Communications (NCC), pp. 1-6.
[14] Teng, Y., Liu, F., Wu, R. (2013). The research of image detail enhancement algorithm with Laplacian pyramid. In 2013 IEEE International Conference on Green Computing and Communications and IEEE Internet of Things and IEEE Cyber, Physical and Social Computing, pp. 2205-2209. https://doi.org/10.1109/GreenCom-iThings-CPSCom.2013.416
[15] Wang, X.B. (2009). Image enhancement based on lifting wavelet transform. In 2009 4th International Conference on Computer Science & Education, pp. 739-741. https://doi.org/10.1109/ICCSE.2009.5228128
[16] Narayana, V.L., Gopil, A.P. (2017). Visual cryptography for gray scale images with enhanced security mechanisms. Traitement du Signal, 34(3-4): 197-208. https://doi.org/10.3166/ts.34.197-208
[17] Gopil, A.P., Narayana, V.L. (2017). Protected strength approach for image steganography. Traitement du Signal, 34(3-4): 175-181. https://doi.org/10.3166/TS.34.175-181
[18] Munteanu, C., Rosa, A. (2004). Gray-scale image enhancement as an automatic process driven by evolution. IEEE Transactions on Systems, Man, and Cybernetics, Part B (cybernetics), 34(2): 1292-1298. https://doi.org/10.1109/TSMCB.2003.818533
[19] Sun, Y., Yin, X. (2013). Optical transfer function-based micro image enhancement algorithm. In 2013 IEEE International Conference on Communications Workshops (ICC), pp. 959-963. https://doi.org/10.1109/ICCW.2013.6649374
[20] Ehsani, S.P., Mousavi, H.S., Khalaj, B.H. (2011). Chromosome image contrast enhancement using adaptive, iterative histogram matching. In 2011 7th Iranian Conference on Machine Vision and Image Processing, pp. 1-5. https://doi.org/10.1109/IranianMVIP.2011.6121581
[21] Zhang, X.G., Gao, D., Xu, J.J. (2005). Generalized fuzzy enhancement of image for radiographic testing weld. Published in Proceedings of the 4th International Symposium on Image and Signal Processing and Analysis, 94-99. https://doi.org/10.1109/ISPA.2005.195390
[22] Ke, W.M., Chen, C.R., Chiu, C.T. (2010). BiTA/SWCE: Image enhancement with bilateral tone adjustment and saliency weighted contrast enhancement. IEEE Transactions on Circuits and Systems for Video Technology, 21(3): 360-364. https://doi.org/10.1109/TCSVT.2010.2087475