Ruixue Zhang
© 2020 IIETA. This article is published by IIETA and is licensed under the CC BY 4.0 license (http://creativecommons.org/licenses/by/4.0/).
OPEN ACCESS
With the proliferation of information technology, precision marketing has emerged as an important strategy to increase the return rate. To improve the effect of precision marketing, the traditional manual survey should be replaced with big data analysis to disclose user demand and understand user purchase behaviors. For accurate forecast of user purchase behaviors, this paper firstly analyzes the quality and features of the historical data on user purchases, and preprocesses the data by a self-designed procedure. Then, the various features of user purchase behaviors were summarized and optimized, and the features of user purchase intentions for products were extracted. On this basis, a DenseNet purchase intention prediction model was established on Bagging strategy. The effectiveness of the proposed model was proved through experiments. Our model enables enterprises to quickly identify potential sales targets.
big data analysis, purchase intentions, purchase behaviors, deep convolutional neural network (D-CNN)
With the proliferation of information technology, more and more enterprises have attached importance to the Internet and the Internet of things (IoT) in management and product marketing [1-5]. To increase the return rate of marketing, an enterprise must step up the investment in precision marketing plans, and establish a sound personalized recommendation system. The key to precision marketing lies in the prediction of user purchase intentions [6-8]. However, it is impossible to predict these intentions accurately, unless useful information has been mined from the massive historical data on users and products. The accurate prediction of user purchase intentions enables enterprises to quickly identify potential sales targets [9-11].
The user purchase behaviors are usually predicted by algorithms like decision tree (DT), k-nearest neighbors (k-NN), support vector machine (SVM), Bayesian network, and logistic regression [12-17], and their combinations with machine learning (ML) [18, 19]. After dividing users by purchase rate, Kaneko and Yada [20] constructed an online prediction model for user purchase rate based on beta geometric/negative binomial distribution (BG/NBD), which can accurately forecast user purchase behaviors in 2.5 years. To predict the purchase behaviors of Taobao users, Kulkarni [21] added three concomitant variables, namely, the number of reviews, the number of favorites, and the repeat purchase rate, to the hybrid model of SVM and HIPP. Robinson et al. [22] introduced the recency-frequency-monetary (RFM) model into the association rules of the traditional BG/NBD model, which, coupled with the update of weight coefficients, can process online purchase information, and predict user purchase trend in real time. Mistry et al. [23] combined Markov chain theory and collaborative filtering recommendation algorithm, and examined the relationship between purchase intention and non-purchase intention according to the information of shopping cart and favorites.
The existing studies mainly tackle the influencing factors of user purchase behaviors. It takes a long time for the current prediction models to construct features and predict behaviors. These models are not suitable for predicting user purchase intentions, without hypothetical limitations on historical purchase data.
This paper presents a brand-new prediction model for user purchase intentions. Firstly, the historical data on user purchases were subject to quality and feature analyses, and preprocessed by a self-designed procedure. Under the framework of DenseNet, the various features of user purchase behaviors were summarized and optimized, and the features of user purchase intentions for products were derived and described. On this basis, a DenseNet purchase intention prediction model was established on Bagging strategy. Then, the authors clarified the structure of the random forest (RF) unit of Bagging strategy, and specified the workflow of gcForest algorithm. The proposed prediction model was proved effective through experiments.
For accurate prediction of user purchase intentions, it is highly necessary to analyze, screen, and integrate the massive historical data on user purchases, and build a big data analysis model based on effective data. Therefore, the historical data on user purchases were subjected to quality analysis by processing the dirty data (missing, abnormal, and duplicate items) and noise data.
Missing items, which arise for various reasons, have null attribute values. The values were padded with zeros for the training of DenseNet, a deep convolutional neural network (D-CNN). The abnormal items mainly come from sampling errors, and deviate greatly from the actual situation. Here, these items are screened based on whether they fall in the preset range and obey normal distribution. The items located beyond the maximum or minimum, and differ from the mean value of the dataset by more than 3σ were removed, where σ is the standard deviation.
After quality analysis, the historical data on user purchases were divided into a training set and a test set. The features of the training set were examined preliminarily from multiple angles, including the features and class of distribution, correlation and periodicity of continuous variables, and statistical indices of quantitative data. The preliminary feature analysis covers three aspects:
(1) Statistical analysis on the number of purchases
The distribution of the maximum number of purchases was obtained by analyzing the correlation between the number of purchases and the number of users who have placed orders; the periodical law of purchases was derived from the statistics on the daily and weekly number of purchases; the possibility of repurchase was discussed based on the number of purchases and the number days between adjacent purchases.
(2) Statistical analysis on the classes of target products
The sales distribution of each product was obtained by analyzing the correlation between the name of target product in a fixed class and the number of purchases. Then, the sales distribution of a class of products was ascertained by analyzing the correlation between the total sales of a class of products and the number of purchases.
(3) Feature analysis of target products in repurchases
From the basic data of the above two aspects, the features of target products in repurchases were derived. Next, the correlations between user preference, degree of necessity, purchase interval, and number of purchases were established, and used to analyze the factor affecting the repurchase of the target products.
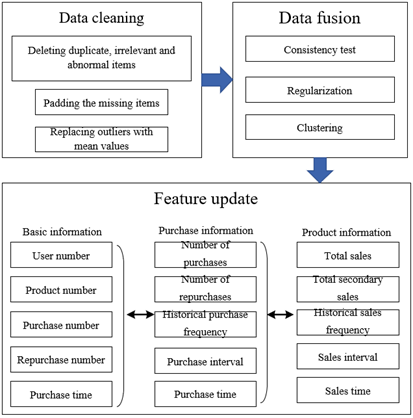
Before establishing the prediction model for user purchase intentions, the data preprocessing was simplified into three stages (Figure 1): data cleaning, data fusion, and feature update. The simplified procedure makes the prediction less abstract, while retaining the essential details of the data.
Figure 1. Preprocessing procedure of historical data on user purchases
3.1 Model framework
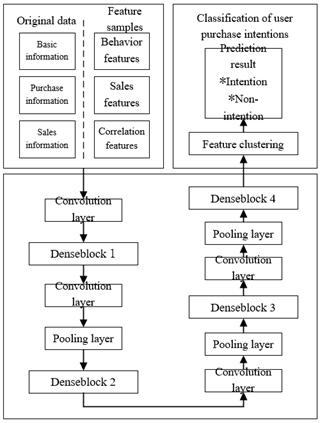
Figure 2 shows the architecture of the DenseNet model that integrates basic features, purchase features, and sales features to predict user purchase intentions. First, the historical data on user purchases were preprocessed, the features that may affect user purchase intentions (e.g. number of purchases, total sales, number of repurchases, and total secondary sales) were imported to the dense blocks and transition layers of the DenseNet for optimization. The salient features were extracted from the optimized purchase data sequence and sales data sequence, and used to predict user purchase intentions by gcForest algorithm under the Bagging strategy. The multi-dimensional scanning module in gcForest compresses the high-dimensional purchase information and sales information into a set of multi-size eigenvectors. Then, the cascading structure outputs the class distribution of each input.
Figure 2. DenseNet purchase intention prediction model
3.2 Feature optimization
Table 1. Features of user purchase behaviors
|
Type |
Serial number |
Name |
Meaning |
|
Basic features |
1 |
User number |
Unique identifier of user |
|
2 |
Product number |
Unique identifier of product |
|
|
3 |
Purchase number |
Unique identifier of purchase behavior |
|
|
4 |
Repurchase number |
Unique identifier of repurchase behavior |
|
|
User features |
5 |
Number of purchases |
Number of a user’s purchases of products |
|
6 |
Number of repurchases |
Number of a user’s repurchases of products |
|
|
7 |
Historical purchase frequency |
Number of purchases in a fixed period (week, month, year) |
|
|
8 |
Purchase interval |
Time difference between adjacent purchases |
|
|
9 |
Purchase time |
Time of purchase |
|
|
Product features |
10 |
Total sales |
Total volume of sold products |
|
11 |
Total secondary sales |
Volume of repurchased products |
|
|
12 |
Historical sales frequency |
Sales volume in a fixed period (week, month, year) |
|
|
13 |
Sales interval |
Time difference between adjacent sales |
|
|
14 |
Sales time |
Time of sales |
The historical data on user purchases cover various features, including but not limited to basic features, purchase features and sales features. Through preliminary analysis, many features were found useful for predicting user purchase intentions. Due to the sheer number of such features, it is impossible to predict the intentions effectively with DenseNet model.
Based on the statistical analysis of available features, this paper summarizes the typical predictive features of user purchase intentions. The features shown in Table 1 above were imported to the DenseNet model to simplify the training process, making the information processing faster. The feature optimization process is detailed as follows:
Let User={u1, u2, …un} be the set of users, Product={p1, p2, …pm} be the set of products, Behavior be the set of user behaviors, and t be behavior time. Then, the correlations between users and products can be expressed as:
$Relevance⊆User $$\times$ $Product $$\times$ $Behavior$ $\times t$ (1)
where, Behavior={1, 2, 3, 4} with 1, 2, 3 and 4 being browsing, favorite, purchase and repurchase, respectively.
The purchase features of user ui can be characterized by the number of purchases ui×|Behavior3+Behavior4|, and the ratio of number of purchases to the total number of behaviors ui×|Behavior3+Behavior4| / |Behavior|.
The sales features of product pj can be characterized by the total number of browses pj×|Behavior1|, and the total sales pj×|Behavior3+Behavior4|.ssssss
Let Timeh be the set of behavior times h days away from the predicted purchase times. Then, the total number of behaviors k that are l days away from the predicted times can be counted by:
$C_{h}^{k}=\left\{t \mid t \in \bigcup_{h=1}^{l} \operatorname{Time}_{h}\right\}$ (2)
The correlations between users and products can be characterized by the total number of the four types of user behaviors that are j days away from the predicted times:
$C_{h}=\bigcup_{k=1}^{4} C_{h}^{k}$ (3)
Then, the purchase intention of user ui for product pj can be described by:
$u_{i} \times p_{i} \times \mid$Behavior$_{3}+$Behavior$_{4} \mid \times C_{h}$ (4)
3.3 Bagging-based DenseNet prediction of purchase intentions
If user purchase intentions are predicted by the traditional CNN-based deep learning, the hyperparameters of the CNN need to be adjusted repeatedly, and a long time is consumed in each training of model parameters. To make matters worse, the distributions of user and product samples are imbalanced in the complex structure of massive data. After all, different kinds of user behaviors (i.e. browsing, favorite, purchase and repurchase) differ greatly in quantity.
The above problems can be solved effectively by the DenseNet, a D-CNN, under the Bagging strategy. This model can optimize the user and product features that enhance purchase intentions, and effectively identify and process the high-dimensional ones through multi-dimensional scanning and cascading structure.
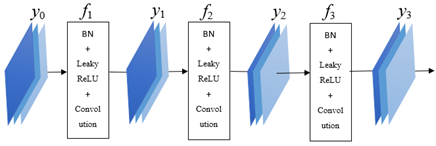
The DenseNet has a unique densely connected feature transfer structure (Figure 3), which mitigates the vanishing gradient problem in the training of such a deep network. Following the idea of cross-layer connection, all the features are directly connected between the deep and shallow layers, eliminating the need to judge or classify them in the last layer. Since the features are fully transferred between deep and shallow layers, the decision function of DenseNet acquires strong generalization ability.
Figure 3. Densely connected feature transfer structure
As shown in Figure 3, each layer of the DenseNet involves batch normalization (BN), the activation function Leaky ReLU (rectified linear unit), and convolution. Let fr be the operation function of the r-th layer. Then, the output yr of the r-th layer can be expressed as:
${{y}_{r}}={{f}_{r}}\left\{ \left[ y_{_{1}}^{r},y_{2}^{r},,y_{s}^{r} \right] \right\}$ (5)
In the DenseNet, the input data of a layer contain the output features of the previous layer, as well as the features of the original data and all the other layers.
It is assumed that the DenseNet has a total of A layers. If the weight parameters are pretrained for the first a layers, then the structure and weight parameters of the last A-a layers should be adjusted as per the predicted purchase intentions.
Let PO(ui, pj) be the old prediction model of the purchase intention of user ui for product pj, that is, the source domain of training, and PN(ui, pj) be the new prediction model of the purchase intention of user ui for product pj, that is, the target domain of training. Then, the source domain can be expressed as:
$\begin{align} & {{P}_{O}}({{u}_{i}},{{p}_{i}}) \\ & =\{{{I}_{O}}({{u}_{i}},{{p}_{i}}),L{}_{O}({{u}_{i}},{{p}_{i}})\},{{P}_{N}}({{u}_{i}},{{p}_{i}}) \\ & =\{{{I}_{N}}({{u}_{i}},{{p}_{i}}),{{L}_{N}}({{u}_{i}},{{p}_{i}})\} \\\end{align}$ (6)
where, IO, LO, and DO are the predicted intention, feature number and feature distribution of the old model, respectively; IN, LN, and DN are the predicted intention, feature number and feature distribution of the new model, respectively.
Since a user either intends to or does not intend to purchase a product, the prediction of user purchase intentions is a binary classification problem. Then, PO(ui, pj) and PN(ui, pj) can be predicted and classified by the DenseNet as follows:
$\begin{align} & {{{\hat{U}}}_{O}}({{u}_{i}},{{p}_{i}}) \\ & ={{\Phi }_{O}}\left[ {{I}_{O}}({{u}_{i}},{{p}_{i}})\left| {{w}_{O}} \right. \right],\text{ }{{{\hat{U}}}_{N}}({{u}_{i}},{{p}_{i}}) \\ & ={{\Phi }_{N}}\left[ {{I}_{N}}({{u}_{i}},{{p}_{i}})\left| {{w}_{N}} \right. \right] \\\end{align}$ (7)
where, $\Phi_{O}$ and $\Phi_{N}$ are the old model and new model of the DenseNet, respectively; UO and UN are the outputs of the old model and new model, respectively.
The error between predicted purchases and actual purchases can be characterized by cross-entropy loss:
$M({{u}_{i}},{{p}_{j}})=-\sum\limits_{i=0,j=0}^{n,m}{P({{u}_{i}},{{p}_{j}})\log R({{u}_{i}},{{p}_{j}})}$ (8)
where, R(ui, pj) is the actual purchase or repurchase of user ui for product pj. Let wO and wN be the weight parameters of the old model and new model, respectively. The training process can be described by:
$\begin{align} & {{w}_{O}} \\ & =\underset{{{w}_{O}}}{\mathop{\arg \min }}\,\left\{ M\left\langle {{U}_{O}}({{u}_{i}},{{p}_{i}})-{{\Phi }_{O}}\left[ {{I}_{O}}({{u}_{i}},{{p}_{i}})\left| {{w}_{O}} \right. \right] \right\rangle \right\} \\\end{align}$ (9)
Throughout the DenseNet training, the weight parameters of the first a layers are transferred to the new prediction task. Suppose wO(1: a) and wN(1: a) are the weight parameters of the first a layers and the target domain models in the old model and new model, respectively. Then, we have:
${{w}_{N}}(1:a)={{w}_{O}}(1:a)$ (10)
Based on the features of the new prediction task, the weight parameters of the last A-a layers in the new model are trained by:
$w_{N}(1 * A)=\left[w_{N}(1 * a), w_{N}(a * A)\right]$$=\underset{{{w}_{N}}(a*A)}{\mathop{\text{argmin}}}\,\left\{ M\left\langle {{U}_{N}}-{{\Phi }_{N}}\left[ {{I}_{N}}({{u}_{i}},{{p}_{i}})\left| \begin{align} & {{w}_{N}}(1*a), \\ & {{w}_{N}}(a*A) \\\end{align} \right. \right] \right\rangle \right\}$ (11)
where, wn(1: A) is all the weight parameters of the new model.
The historical data on user purchases can be divided into multiple training subsets, according to the distance to the predicted times. Therefore, the feature subsets generated by single networks must be combined before DenseNet sample training. Figure 4 shows the structure of a RF unit based on Bagging strategy.
Figure 4. Structure of a RF unit based on Bagging strategy
However, a single RF unit cannot adapt its complexity or computing load to multi-dimensional or fuzzy abstract eigenvectors. For the robustness of prediction, this paper cascades multiple RF units into the gcForest, and combined it with DenseNet into a hybrid model.
Before clustering the output features of DenseNet, gcForest makes multiple parallel predictions on feature information. The feature information is high-dimensional and abstract for the prediction of user purchase intentions. Thus, the voting mechanism was selected to cluster the results. Since the prediction is a binary classification problem, each Forest outputs a two-dimensional (2D) vector. The basic flow of the gcForest algorithm is as follows:
Step 1. Initialize ui =0 and pj =0;
Step 2. Obtain two complete RFs and two RFs through Pg(ui, pj) training, and combine them into the g-th layer of gcForest;
Step 3. Train the 2D class vector outputted by each RF on the g-th layer separately, and combine the results into a 2D class vector set Y for sample subset;
Step 4. Compute the mean value Y of the 2D class vector set, and determine the class argmax`Y of the predicted result of the g-th layer;
Step 5. Set up a voting mechanism with threshold δ=0.5, and verify the predicted results on test set; if the classification accuracy μi is not greater than δ, output purchase; otherwise, output non-purchase;
Step 6. Combine the 2D class vectors outputted by the RFs on the g-th layer into a new prediction subset, iteratively process Pg(ui, pj), and repeat Step 2.
To verify its effectiveness, the proposed model was compared with three classification and prediction algorithms: the DT algorithm of synthetic minority oversampling technique (SMOTE), the k-NN algorithm under the Bagging strategy, and the combined algorithm of CNN and long short-term memory (LSTM). The three contrastive algorithms are denoted as SDT, BKNN and CNN-LSTM, respectively.
According to the analysis on predicted results, the users whose number of purchases is smaller than 1 are highly unlikely to have purchase intention or purchase behavior in future, while those whose number of purchases is greater than 3 are very likely to have purchase intention or purchase behavior in future.
Table 2 lists the user purchase intentions and behaviors in six months based on the historical data on user purchases in the previous six months. It can be seen that, the more the actual purchases, the greater the predicted purchase intentions and behaviors. In addition, the predictions of our model are closer to actual data than those of the contrastive algorithms, reflecting the effectiveness of our model.
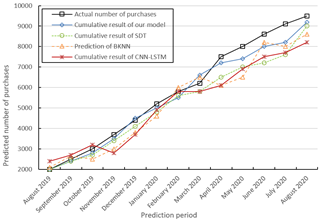
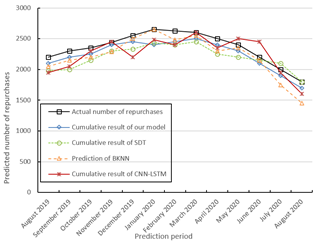
Figures 5 and 6 compares the predicted number of purchases and repurchases of each method with the actual data, respectively. It can be seen that all four methods are good at tracking user purchase intentions. Our model is more accurate than the three contrastive algorithms in predicting the cumulative number of purchases and repurchases.
Table 3 compares the performances of the four methods. Our model had clear advantages over the contrastive algorithms in precision, recall and F-score. Although our model consumed a relatively long time in training, the extra time only took up a minor fraction in the total time of training. Overall, our model achieved the best performance among all four methods.
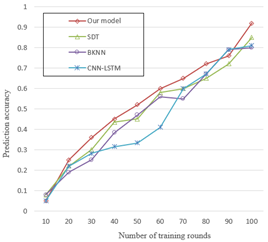
Figure 7 further compares the prediction accuracies of the four methods. It can be seen that our model surpassed the other algorithms in prediction accuracy, with the growing number of training rounds.
Table 2. Predicted number of purchases in the last six months
|
User number |
User features (5, 6, 7, 8) |
Number of purchase intentions or behaviors |
|||
|
SDT |
BKNN |
CNN-LSTM |
Our model |
||
|
10 |
(5, 1, 30, 0.033) |
4.655 |
4.684 |
4.747 |
5.759 |
|
390 |
(15, 3, 10, 0.1) |
13.641 |
13.731 |
14.564 |
15.023 |
|
570 |
(29, 8, 5.17, 1.193) |
27.948 |
27.804 |
26.452 |
28.648 |
|
850 |
(21, 4, 7.14, 0.14) |
23.704 |
20.837 |
21.958 |
21.042 |
|
1030 |
(18, 8, 8.33, 0.12) |
16.015 |
19.914 |
18.423 |
18.211 |
|
1210 |
(17, 5, 8.8, 0.113) |
15.439 |
14.468 |
16.854 |
17.975 |
Figure 5. Comparison between predicted and actual number of purchases
Figure 6. Comparison between predicted and actual number of repurchases
Table 3. Comparison of prediction performance
|
Method |
Precision |
Recall |
F-score |
Training time (s) |
|
SDT |
0.88 |
0.90 |
0.86 |
2.320 |
|
BKNN |
0.87 |
0.87 |
0.87 |
1.254 |
|
CNN-LSTM |
0.92 |
0.91 |
0.93 |
4.614 |
|
Our model |
0.96 |
0.95 |
0.95 |
5.214 |
Figure 7. Comparison of prediction accuracies
This paper mainly designs a new prediction model for user purchase intentions. Firstly, the historical data on user purchases were subjected to quality and feature analyses, and preprocessed through cleaning, fusion, and feature update. Based on DenseNet, the architecture of the prediction model was designed, and the features of purchase behaviors, including basic features, purchase features and sales features, were summarized and optimized. Then, the features that affect the purchase intentions were derived and depicted in details. On this basis, a DenseNet purchase intention prediction model was developed under the Bagging strategy, the structure of the RF unit was constructed, and the basic flow of gcForest algorithm was illustrated. Finally, our model was compared with three classification and prediction algorithms through experiments. The comparison shows that the prediction of our model was closer to reality and better in accuracy than that of any contrastive algorithm. Therefore, our model is effective in predicting user purchase intentions.
Supported by General Research project of Economic and Social Development of Liaoning of China (Project No.: 2018lslktyb-026), and General topics of Dalian Federation of Social Sciences of China (Project No.: 2018dlskyb036), and 2019 Discipline Cultivation Project of Dalian Minzu University.
[1] Kaur, R., Singh, S. (2016). A survey of data mining and social network analysis based anomaly detection techniques. Egyptian Informatics Journal, 17(2): 199-216. https://doi.org/10.1016/j.eij.2015.11.004
[2] Kachamas, P., Akkaradamrongrat, S., Sinthupinyo, S., Chandrachai, A. (2019). Application of artificial intelligent in the prediction of consumer behavior from Facebook posts analysis. International Journal of Machine Learning and Computing, 9(1): 91-97. https://doi.org/10.18178/ijmlc.2019.9.1.770
[3] Dingli, A., Marmara, V., Fournier, N.S. (2017). Comparison of deep learning algorithms to predict customer churn within a local retail industry. International Journal of Machine Learning and Computing, 7(5): 128-132. https://doi.org/10.18178/ijmlc.2017.7.5.634
[4] Hwang, S.W., Kim, S., He, Y., Elnikety, S., Choi, S. (2016). Prediction and predictability for search query acceleration. ACM Transactions on the Web (TWEB), 10(3): 1-28. https://doi.org/10.1145/2943784
[5] Li, Y. (2018). Design and implementation of intelligent travel recommendation system based on internet of things. Ingénierie des Systèmes d’Information, 23(5): 159-173. https://doi.org/10.3166/ISI.23.5.159-173
[6] Lo, C., Frankowski, D., Leskovec, J. (2016). Understanding behaviors that lead to purchasing: A case study of pinterest. In Proceedings of the 22nd ACM SIGKDD International Conference on Knowledge Discovery and Data Mining, pp. 531-540. https://doi.org/10.1145/2939672.2939729
[7] Tay, M.C.P.Y. (2017). CIKM analyticup 2017-lazada product title ality challenge: A bag of features for short text classification. Tech report in School of Computer Science and Engineering, Nanyang Technological University.
[8] Zimmermann, T., Djürken, T., Mayer, A., Janke, M., Boissier, M., Schwarz, C., Uflacker, M. (2017). Detecting Fraudulent Advertisements on a Large E-Commerce Platform. In EDBT/ICDT Workshops.
[9] Xia, Y., Di Fabbrizio, G., Vaibhav, S., Datta, A. (2017). A Content-based Recommender System for E-commerce O ers and Coupons. In Proc. SIGIR Workshop eCommerce.
[10] Palotti, J. (2016). Learning to rank for personalized e-commerce search at CIKM Cup 2016. Technical Report. Tech. rep.
[11] Jain, A., Menon, M.N., Chandra, S. (2015). Sales forecasting for retail chains.
[12] Borisov, A., Markov, I., De Rijke, M., Serdyukov, P. (2016). A neural click model for web search. In Proceedings of the 25th International Conference on World Wide Web, pp. 531-541. https://doi.org/10.1145/2872427.2883033
[13] Tang, L., Huang, Q., Puntambekar, A., Vigfusson, Y., Lloyd, W., Li, K. (2017). Popularity prediction of facebook videos for higher quality streaming. In 2017 {USENIX} Annual Technical Conference ({USENIX}{ATC} 17), pp. 111-123.
[14] Hidasi, B., Karatzoglou, A., Baltrunas, L., Tikk, D. (2015). Session-based recommendations with recurrent neural networks. arXiv preprint arXiv:1511.06939.
[15] Joshi, R., Gupte, R., Saravanan, P. (2018). A random forest approach for predicting online buying behavior of Indian customers. Theoretical Economics Letters, 8(3): 448. https://doi.org/10.4236/tel.2018.83032
[16] Barkan, O., Koenigstein, N. (2016). Item2vec: neural item embedding for collaborative filtering. In 2016 IEEE 26th International Workshop on Machine Learning for Signal Processing (MLSP), pp. 1-6. https://doi.org/10.1109/MLSP.2016.7738886
[17] He, R., McAuley, J. (2016). Fusing similarity models with Markov chains for sparse sequential recommendation. In 2016 IEEE 16th International Conference on Data Mining (ICDM), pp. 191-200. https://doi.org/10.1109/ICDM.2016.0030
[18] Korpusik, M., Sakaki, S., Chen, F., Chen, Y.Y. (2016). Recurrent Neural Networks for Customer Purchase Prediction on Twitter. CBRecSys@ RecSys, 1673: 47-50.
[19] Vasile, F., Smirnova, E., Conneau, A. (2016). Meta-prod2vec: Product embeddings using side-information for recommendation. In Proceedings of the 10th ACM Conference on Recommender Systems, pp. 225-232. https://doi.org/10.1145/2959100.2959160
[20] Kaneko, Y., Yada, K. (2016). Fractal dimension of shopping path: Influence on purchase behavior in a supermarket. Procedia Computer Science, 96: 1764-1771. https://doi.org/10.1016/j.procs.2016.08.225
[21] Kulkarni, H. (2017). Intelligent context based prediction using probabilistic intent-action ontology and tone matching algorithm. In 2017 International Conference on Advances in Computing, Communications and Informatics (ICACCI), pp. 656-662.
[22] Robinson, C., Dilkina, B., Hubbs, J., Zhang, W., Guhathakurta, S., Brown, M.A., Pendyala, R.M. (2017). Machine learning approaches for estimating commercial building energy consumption. Applied energy, 208: 889-904.
[23] Mistry, M., Letsios, D., Krennrich, G., Lee, R.M., Misener, R. (2018). Mixed-Integer Convex Nonlinear Optimization with Gradient-Boosted Trees Embedded. arXiv preprint arXiv:1803.00952.