Olumide S. Adesina![]() | Adedayo F. Adedotun*
| Adedayo F. Adedotun*![]() | Femi J. Ayoola
| Femi J. Ayoola![]() | Tolulope F. Adesina
| Tolulope F. Adesina![]() | Semiu A. Alayande
| Semiu A. Alayande![]() | Oluwakemi O. Onayemi
| Oluwakemi O. Onayemi![]()
© 2024 The authors. This article is published by IIETA and is licensed under the CC BY 4.0 license (http://creativecommons.org/licenses/by/4.0/).
OPEN ACCESS
This investigation employs statistical learning techniques to analyze service quality within Nigeria's aviation industry, a sector integral to the nation's economic vitality and connectivity. The industry has faced challenges exacerbated by economic downturns, notably the rise in fuel prices and the devaluation of the Nigerian Naira since early 2022. Previously reported customer dissatisfaction prompted a thorough examination of passenger and stakeholder experiences. A cross-sectional survey methodology was adopted, yielding data subsequently analyzed through advanced machine learning algorithms. A principal component analysis (PCA) model was refined via leave-one-out cross-validation (LOOCV), an unsupervised learning approach. Findings reveal that crew member performance is the most influential factor on service quality, exhibiting an inverse relationship with other variables in the first principal component. In the second principal component, flight rescheduling emerges as a significant negative determinant. Recommendations from this analysis are directed at aviation industry practitioners, policymakers, and stakeholders, emphasizing the enhancement of crew member recruitment and training processes. Additionally, strategies to adhere to scheduled travel times are advocated. These insights are pivotal for advancing service standards in Nigeria's airline industry.
airline, machine learning, Nigeria, principal component analysis, service quality, airline operators
As a cornerstone of contemporary global transportation, the aviation industry catalyzes economic growth, enhances connectivity, and facilitates globalization. Nigeria's aviation sector has witnessed significant expansion, underscoring its role in fostering trade, tourism, and economic progress. Accommodating the dynamic landscape of air travel demands necessitates a comprehensive understanding of service quality, safety, and customer satisfaction. Within this context, statistical learning analysis emerges as an indispensable tool, offering nuanced insights into the operational dynamics and facilitating rigorous performance evaluations [1, 2].
Machine learning, an integral branch of artificial intelligence, enables predictive analytics and decision-making in the absence of explicit programming. Algorithms are trained on historical datasets to discern patterns and relationships that elude human intuition [3, 4]. The capacity of these algorithms to reveal hidden structures within data can significantly contribute to enhancing operational efficiency and customer experience within the aviation domain.
The aviation industry generates extensive datasets, encompassing details on flight operations, maintenance practices, safety records, and customer feedback, among other facets. These repositories of data, when explored through advanced statistical learning techniques, have the potential to elucidate operational complexities, unearth latent patterns, and identify determinants of service effectiveness and consumer satisfaction.
A cross-sectional survey was conducted, independent of the industry-generated data, to capture the perceptions of customers and stakeholders regarding the Nigerian aviation sector's services. Insights from this survey are expected to highlight the industry's strengths, weaknesses, opportunities, and threats, thereby informing strategic decision-making. The application of machine learning techniques to a sample of one hundred and fifteen airline customers and stakeholders introduces a novel methodology to enhance the representativeness and depth of the survey findings.
The use of Principal Component Analysis (PCA), an unsupervised machine learning technique, is particularly promising. PCA serves as an effective dimensionality reduction tool, capable of identifying fundamental structures within a dataset and highlighting salient relationships and variables. This study leverages PCA to illuminate the predominant factors affecting aviation services and stakeholder perceptions in Nigeria, directing attention to critical intervention points.
The research presented herein offers empirical insights with significant implications for policy-making, industry practices, and strategic investments within Nigeria's aviation sector. Results from this investigation are poised to underpin initiatives aimed at bolstering service delivery, enhancing safety management, and refining customer experience. The integration of machine learning techniques into this research not only reflects the current innovation-oriented trajectory of aviation industry analysis but also extends the methodological repertoire of the field.
To situate this research within the broader academic discourse, a comprehensive review of the literature was undertaken, drawing on seminal works within the domains of aviation management, customer experience, and statistical learning. Significant advancements in the application of statistical methods to aviation have been documented [5-10], with a particular emphasis on the sector's evolving operational challenges. The study [11] is instrumental in this domain, having employed data envelopment analysis (DEA) to measure operational efficiency in the airline industry. Their methodology allowed for a nuanced evaluation of performance by considering a range of inputs and outputs, thus shedding light on resource utilization and potential areas for enhancement. Further extending the discourse on operational efficiency, the research by study [12] delved into airline yield management and network optimization, offering substantial contributions to the refinement of revenue management strategies—a critical component for ensuring profitability and operational fluidity. The framework proposed by study [13] for the assessment and enhancement of operational efficiency is particularly noteworthy. By incorporating key performance indicators and benchmarking efficiency, their approach has offered valuable benchmarks for industry practitioners. In the realm of customer satisfaction, the findings by study [14] have provided a detailed examination of factors affecting passenger experiences within the American airline industry, offering insights that are potentially transferable to different contexts, including Nigeria's aviation sector. Additionally, the demand forecasting study by study [15] utilized advanced analytics to optimize resource allocation and flight scheduling, thereby contributing to the broader discourse on improving operational efficiency.
Despite the critical importance of customer satisfaction in the aviation industry, the literature presents a lacuna in methodologically robust studies that systematically identify factors driving this satisfaction. Addressing this gap, the current study harnesses machine learning techniques to decipher complex patterns of customer satisfaction within the airline sector. Previous research efforts, as delineated by study [8], have investigated operational efficiency and strategic imperatives for new market entrants in aviation. However, these studies often circumscribed their focus to traditional performance metrics. The work of the study [10] represents a notable exception, correlating service quality attributes with customer satisfaction and employing established analytical methods to substantiate their findings, encompassing factors such as cleanliness, food and beverage quality, and in-flight entertainment options. The methodologies adopted by the study [11] and study [15] were previously highlighted, with an emphasis on measuring operational efficiency within the airline industry. The present study diverges from these precedents by employing unsupervised machine learning techniques. This approach was chosen for its capacity to impartially evaluate the significance of a wide array of variables, thus providing a comprehensive landscape of influences on customer satisfaction.
In subsequent sections, this paper elucidates the methodology adopted, presents insights gleaned from the application of statistical learning, and discusses the ramifications of these findings for Nigeria's aviation sector. The research is embarked upon with the objective of shedding light on the nuances of service quality, fostering enhancements in industry standards, and contributing to the sustainable development of Nigerian aviation.
2.1 Model specification
2.1.1 Principal component analysis
The assumption underlying the use of $\mathrm{PCA}$ is (i) variables combine in a linear fashion to form the dataset, that is, have a relationship amongst them (ii) attention must be paid to the principal component with high variance and the PCs with lower variance are ignored as noise (iii) the feature set must be correlated (iv) The PCA will represent the original data set but with reduced dimensions.
If the aim is to project from $M$ to $D$ dimension, PCA will define $D$ vectors, $\boldsymbol{W}_d$, each of which is $N$-dimensional. The $d$th element of the projection,
$x_{n d}\left(\right.$ when $\left.x_n=\left[x_{n 1}, \ldots, x_{n D}\right]^T\right)$, is computed as:
$x_{n d}=\boldsymbol{w}_d^T y_n, d \in \mathbb{Z}$ (1)
The PCA would employ the projection space to choose $\boldsymbol{W}_d$. From Eq. (1) $\boldsymbol{w}_d^T$ is the transpose of $\boldsymbol{W}_d$, while $y_n$ represents the original data before dimension reduction. The bold letters represent matrices.
We want to project into $(D)$ and then pick a projection vector, $\boldsymbol{w}_d$, for each.
The eigenvector/eigenvalues for square matrix $A$ is given as:
$\lambda_i u_i=A u_i$ (2)
Find the eigenvectors corresponding to the $\boldsymbol{D}$ highest values, $w_1, \ldots, w_D$.
We create the $d$ th dimension for object $n$ in the projects, $x_{n d}=\boldsymbol{w}_d^T y_n$ (or $\boldsymbol{X}=\boldsymbol{Y} \boldsymbol{W}$, where $\boldsymbol{W}=\left[w_1, \ldots, w_D\right]$, i.e., the $\boldsymbol{M} \times \boldsymbol{D}$ matrix created by placing the $\boldsymbol{D}$ eigenvectors alongside one another and $X$ is the $\boldsymbol{N} \times \boldsymbol{D}$ matrix defined as $\boldsymbol{X}=\left[x_1, \ldots, x_N\right]^T$.
2.1.2 Principal Component Regression
The general form of multiple linear regression is
$Y=X \beta+\varepsilon$ (3)
The least squares solution for (5) is given by
$\beta=\left(X^T X\right)^{-1} X^T Y$ (4)
$\boldsymbol{X}^T \boldsymbol{X}$ is singular matrix, that is, $\left|\boldsymbol{X}^T \boldsymbol{X}\right|=0$, the Principal Component Regression avoid this by decomposing $\boldsymbol{X}$ into orthogonal scores $\boldsymbol{T}$ and loadings $\boldsymbol{P}$.
$X=T P$ (5)
We regress $\boldsymbol{Y}$ on the first " $a$ " columns of the scores $\boldsymbol{T}$, and not on $\boldsymbol{X}$ itself. The Principal Component Regression concentrates on the variance of $\boldsymbol{X}$.
PCR Algorithm
The way PCR work is that $\boldsymbol{X}$ matrix will be approximated by the first ' $a$ ' Principal Components from singular value decomposition.
$X=\dot{X}_{(a)}+\varepsilon_X=T_{(a)} P_{(a)}^T+\varepsilon_X$ (6)
Then, we regress $\boldsymbol{Y}$ on the scores as follows
$\beta=P\left(T^T T\right)^{-1} T^T Y=V D^{-1} U^T Y$ (7)
The $\dot{X}_{(a)}$ represents centering, this can be done by computing the mean deviation of a column or row matrix.
The study [16] showed that PCR behave like shrinkage method.
2.2 Cross-validation
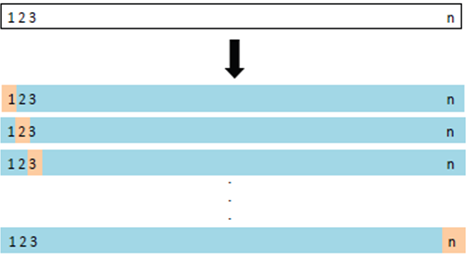
Cross-validations are machine techniques that help our model learn how to fit unseen data to achieve minimal errors, given the seen data. Cross-validation methods such as k-fold CV, Hold-out method of CV, Leave-out-one CV (LOOCV), bootstrap $\mathrm{CV}$, and the leave-out-one cross-validation can be used. This study adopts the LOOCV. In LOOCV, one data point would be left out and used for testing, while the remaining would be used for training, every data point would go through the training process. The LOOCV process is considered computationally expensive because it involves fitting the model $\mathrm{n}$ times, however, it is considered superior to methods such as the k-fold and hold-out methods [17]. To obtain the mean square error based on LOOCV, the model will be trained on every data point except, $i=1, \ldots n$. Then, we compute the test error on the point held out. Lastly, we obtain the mean of the test errors, provided in Eq. (8). It is illustrated in Figure 1.
Figure 1. Procedure for computing LOOCV
$C V_{(n)}=\frac{1}{n} \sum_{i=1}^n M S E_i$ (8)
The implementation was done using the software package by the study [18], R packages such as “pls” by the study [19].
2.3 Data
A cross-section research design was adopted and one hundred and fifteen respondents were obtained. The data was collected using an online questionnaire between April 12th, 2023, and April 27th, 2023. The instrument used an interval scale such as strongly Agree (SA), Agree (A), Neutral, Disagree (D), and Strongly Disagree (SD). There was no case of missing data because all questions were compulsory. Twenty questionnaires were administered to the same set of individuals at the pilot study stage before embarking on the survey proper. The pilot study was to determine the internal consistency of the questionnaire and to determine areas that need correction. The test yielded a Cronbach alpha of 0.8674, the closer to 1.0000 the better. The questionnaires twenty used for the pilot study were retrieved and were not included in the main study.
The dependent variable is Services (rating of their services), while the independent variables include; safe (how safe is the airline), reliable (how reliable is the airline), Comfortable (how comfortable is the airline), Services (rating of their services), Crew (rating of the crew members of the airline), fare (how reasonable is the fare?), Rescheduling (is the airline known for rescheduling without considering their customers?), reputation (rating of their reputation), ancillaries (book and fulfill airline products which are not included in the fare). The distribution of responses by the airline is as follows:
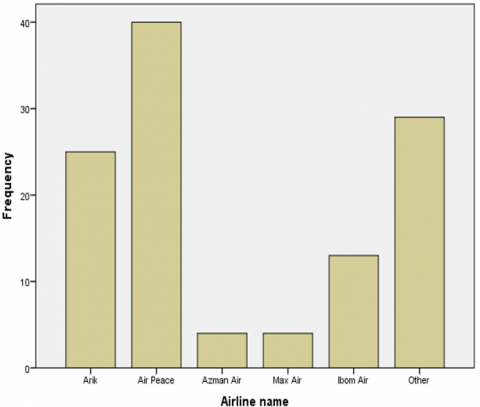
Figure 2. Distribution of stakeholders by airline
Figure 2 represents the distribution of responses. For Arik we have twenty-five (21.7%), for Air Peace, we have forty (38.8%), for Azman Air we have four (3.5%), Max Air, we also have four (3.5%), and for Ibom Air we have thirteen (11.3%), Other we have twenty-nine (25.2%).
Results obtained are discussed accordingly. The results are divided into two; (i) Service (ii) Operations.
Table 1 presents correlation matrix of the predictors variables used to measure quality of service rendered by Nigeria airlines.
The correlation coefficient, a value between and shows the strength of the relationship between two variables. From Table 1, it is observed that there are no very high correlations among the predictor variables which implies that there is no indication of problem of multicollinearity among the predictor variables. If there is the existence of multicollinearity, the results could be biased leading to unreliable estimates. It is observed that safe and comfortable have a fairly high positive correlation (0.55099). Also, reliable and comfortable have a fairly high positive correlation (0.567784), same with comfortable and services (0.557892).
Here, services show a low correlation with all the variables except that it was fairly positive with comfortable.
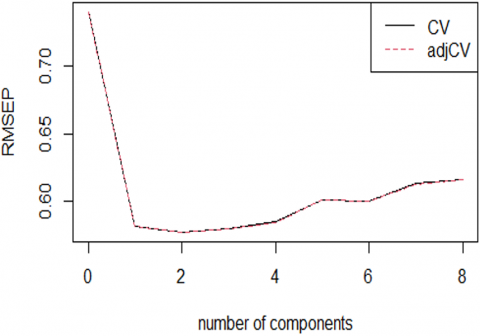
From Table 2, The least LOOCV Root Mean Squared Error of Prediction (RMSEP) is at component 2, meaning that the eight components have been reduced into two. The prediction error can be measured by the Root Mean Squared Error of Prediction since an estimator with a lower error is considered most efficient. So, the component that has the minimum of the RMSEP is at component 2, so at that point, it is satisfactory, all other components beyond component 2 will be discarded, hence reducing the dimension of the data from eight to two.
There are two cross-validation estimates: CV estimate [20], CV is the ordinary CV estimate, and adj CV is a bias-corrected. The concept of LOOCV as provided in section 2.2 provides an opportunity for each datum to be involved in the training and testing process, this method is considered the most effective but computationally expensive [17].
From Table 3, it can be deduced that the variance explained is 56.96% since two components are involved.
The least Root Mean Squared Error of Prediction (RMSEP) LOOCV for test data is 0.6197 in component 1; this is not too far from that of the training error in Comp 1 (0.5820). From Table 4, the test LOOCV in component 2 is 0.6234, which is not so much different from that of the training set LOOCV in Table 2 (0.5772). Though the test LOOCV shows that the component has reduced to one since the smallest LOOCV (0.6197) is in Component 1.
Table 1. Correlation matrix of the predictors variables for service in airline in industry
|
|
Safe |
Reliable |
Comfort |
Services |
Crew |
Fare |
Resch |
Reputation |
Ancillaries |
|
Safe |
1 |
|
|
|
|
|
|
|
|
|
Reliable |
0.39688 |
1 |
|
|
|
|
|
|
|
|
Comfortable |
0.55099 |
0.567784 |
1 |
|
|
|
|
|
|
|
Services |
0.46327 |
0.442735 |
0.557892 |
1 |
|
|
|
|
|
|
Crew |
0.13803 |
-0.25865 |
-0.23378 |
-0.22125 |
1 |
|
|
|
|
|
Fare |
0.37904 |
0.30812 |
0.298128 |
0.44139 |
-0.1869 |
1 |
|
|
|
|
Rescheduling |
0.169017 |
-0.09552 |
0.025986 |
0.01945 |
-0.1471 |
0.087577 |
1 |
|
|
|
Reputation |
0.311154 |
0.501248 |
0.422098 |
0.349317 |
-0.2349 |
0.303797 |
-0.02609 |
1 |
|
|
Ancillaries |
0.524674 |
0.376839 |
0.448649 |
0.400642 |
-0.2934 |
0.409545 |
0.062019 |
0.297923 |
1 |
Table 2. Cross-validated using 95 leave-one-out segments
|
|
Int. |
Comp 1 |
Comp 2 |
Comp 3 |
Comp 4 |
Comp 5 |
Comp 6 |
Comp 7 |
Comp 8 |
|
CV |
0.7401 |
0.5820 |
0.5772 |
0.5802 |
0.5850 |
0.6012 |
0.6002 |
0.6133 |
0.6165 |
|
adj CV |
0.7401 |
0.5819 |
0.5771 |
0.5801 |
0.5848 |
0.6009 |
0.5998 |
0.6129 |
0.6160 |
Table 3. TRAINING: % variance explained
|
|
Comp 1 |
Comp 2 |
Comp 3 |
Comp 4 |
Comp 5 |
Comp 6 |
Comp 7 |
Comp 8 |
|
X |
37.34 |
19.62 |
14.09 |
9.41 |
7.57 |
3.90 |
3.22 |
4.85 |
|
CX |
37.34 |
56.96 |
71.04 |
80.45 |
88.02 |
92.88 |
96.77 |
100.0 |
|
Services |
39.86 |
42.33 |
44.18 |
44.40 |
44.40 |
46.01 |
46.19 |
47.6 |
Table 4. Test LOOCV
|
|
Int. |
Comp 1 |
Comp 2 |
Comp 3 |
Comp 4 |
Comp 5 |
Comp 6 |
Comp 7 |
Comp 8 |
|
CV |
0.6391 |
0.6197 |
0.6234 |
0.6338 |
0.6320 |
0.6326 |
0.6216 |
0.6288 |
0.6225 |
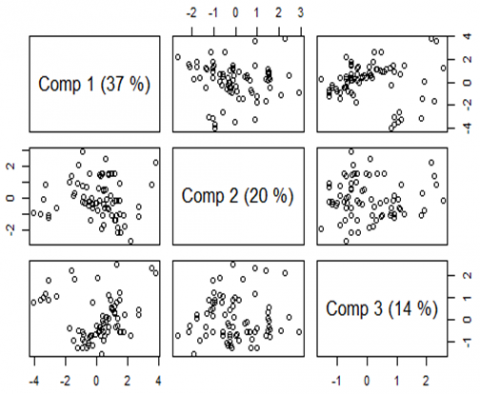
Figure 3 shows that the two lines almost overlap showing that there is no much difference between the CV and adj CV in the training error. Figure 4 shows percentage explained by component.
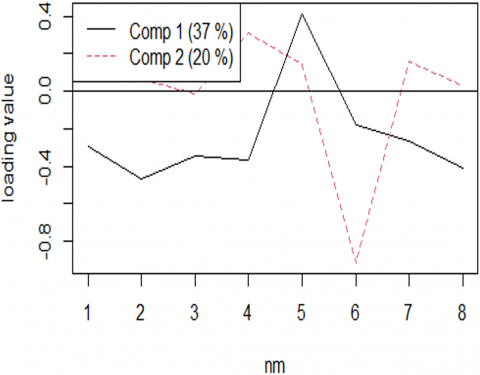
From Figure 4, we can see that 37% of the predictors were explained by the response variable in component 1, 20% in component 2, and 14% in component 3. Figure 5 shows the loading value in various components.
Figure 5, shows the loading value in Component 1 and Component 2. The loading value is about zero at component 2. Variable 5 (Crew) has a very strong positive relationship with services in Component 1, and variable 2 (fare) has a negative relationship with services in Component 1. Variable 6 (rescheduling) has a very strong negative relationship with services in component 2, and variable 4 (reliable) has a strong relationship with services in component 2. Figure 5 shows that in Component 1, Crew have most positive impact (40%) on services provided in Nigerian airlines. While in Component 2, rescheduling has most negative impact (90%) on services provided in Nigerian airlines.
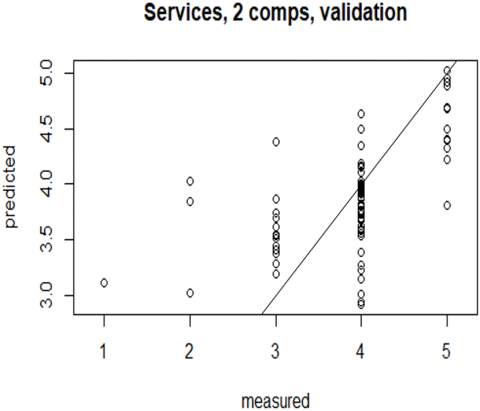
Ninety-five (95) data points were used as training set and twenty (20) data points for prediction and the mean predicted value is 3.7873 (approximately 4) on a scale of 1-5, which indicated that the PCA predicted that the stakeholders/customers would be favorably disposed to the services rendered by the Nigerian airlines, though they find the services currently rendered below somewhat unacceptable. Figure 6 shows the results of the predictions. It can be seen that it is mostly clustered around 4.
The results for the unsupervised learning part are discussed in Table 5, and Table 6. The results are also in Figure 7 and Figure 8.
Figure 3. LOOCV Root Mean Squared Error of Prediction (RMSEP) for CV and adj CV
Figure 4. Percentage explained by component
Figure 5. Loading value in components
Figure 6. Prediction of the services rendered by airline industry
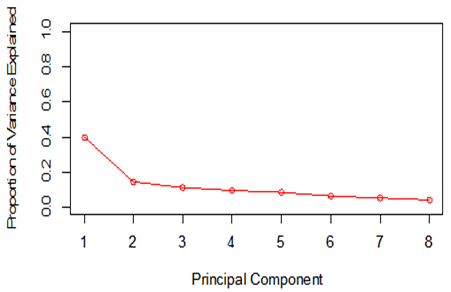
Figure 7. Scree plots for the PCA
Table 5. Importance of components
|
|
PC1 |
PC2 |
PC3 |
PC4 |
PC5 |
PC6 |
PC7 |
PC8 |
|
SD |
1.7874 |
1.0716 |
0.9567 |
0.87194 |
0.83642 |
0.70733 |
0.64395 |
0.60560 |
|
Prop. Var. |
0.3993 |
0.1435 |
0.1144 |
0.09503 |
0.08745 |
0.06254 |
0.05183 |
0.04584 |
|
Cum. Prop. |
0.3993 |
0.5429 |
0.6573 |
0.75233 |
0.83978 |
0.90232 |
0.95416 |
1.00000 |
Table 6. Relationship among variables in components
|
|
PC1 |
PC2 |
|
Comfortable |
-0.43482005 |
0.1200422 |
|
Fare |
-0.33672913 |
-0.1500906 |
|
Safe |
-0.40989242 |
-0.1667249 |
|
Reliable |
-0.41283160 |
0.3269709 |
|
Crew |
0.24611115 |
0.2545793 |
|
Rescheduling |
-0.05578553 |
-0.8230891 |
|
Reputation |
-0.36319726 |
0.2606937 |
|
Ancillaries |
-0.40436161 |
-0.1345663 |
Table 5 shows the important components, Row 1 represents the standard deviation, row 2 is the proportion of variables in each component, and row 3 is the cumulative proportion in row 2. Table 6 shows the relationship between the variables in components 1 and component 2. In the unsupervised learning technique, no variable is more important than the other as opposed to supervised learning where we have a dependent and independent variable(s).
The relationships among variables are measured without one variable or a set of variables depending on the other.
The result shows that in PC1, the crew has an inverse relationship with all other variables (Comfortable, fare, safe, reliable, rescheduling, reputation, ancillaries) which may be interpreted as; the fact that airline crew good does not imply that the aircraft would be comfortable, the fare would be reasonable, safe, reliable. Airline crew does not impart on flight rescheduling, airline reputation as well or decisions for ancillaries. However, in PC2 crew have an inverse relationship with fare, safe, rescheduling, and ancillaries. The implications of these results for the airline industry are that attention should be paid to crew staffing and training, as well as being on top of their game to avoid flight cancelations, delays, or rescheduling since the ‘loading’ in Figure 5 shows that flight rescheduling has a very strong negative impact on the services provided by the airline industry in Nigeria.
The scree plot shows that the second principal component is sufficient to explain the variation anticipated.
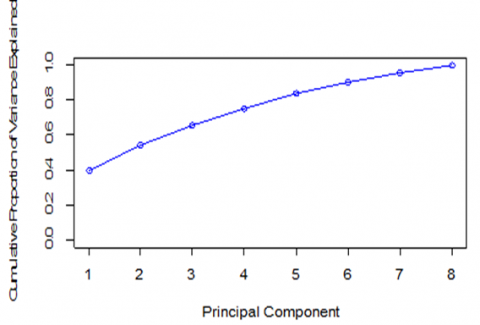
Figure 8 shows the Cumulative proportion of variance explained in each component.
Figure 8. Cumulative proportion of variance explained
This study adopted the machine learning technique to draw inferences from the services provided by the airline industry in Nigeria. Machine learning methods, based on the principal component analysis have shown suitable and robust applicability to the data obtained. The study shows that the stakeholders and airline customers thought the services were satisfactory it is projected to be better. Better services can only be achieved if the government and stakeholders are intentional about creating measures that will improve the services of the aviation industry in Nigeria. Therefore, this study recommends that the government and stakeholders should be involved in ensuring that better services are provided for airline customers such as being involved in the recruitment of crew and hostesses. If services are improved, customers will receive value for their money. They will advertise the services, and there will be higher turnover and profit for the airline industry in Nigeria. Therefore, the government and stakeholders should have strict rules and regulations against flight cancelation, flight delay, or flight rescheduling, thereby protecting customers’ interests. This study also recommends that future research should adopt robust statistical analyses to measure the operational efficiency of the Airline Industry with methods such as Principal Component Regression, and support vector machines. This study is without limitations, one of the limitations such as the inability to sample an adequate number of stakeholders in the government and industry, whilst the majority of the stakeholders were airline customers.
The authors wish to express my acknowledgment to Covenant University Centre for Research, Innovation, and Discovery (CUCRID) for their valuable support in facilitating the completion of this research.
[1] Mitchell, T.M. (1997). Machine Learning. McGraw Hill. Maidenhead, U.K.
[2] Jonathan, O., Misra, S., Osamor, V. (2021). Comparative analysis of machine learning techniques for network traffic classification. IOP Conference Series: Earth and Environmental Science, 655(1): 012025. https://doi.org/10.1088/1755-1315/655/1/012025
[3] Iyiola, T.P., Okagbue, H.I., Adedotun, A.F., Akingbade, T.J. (2023). The effects of decomposition of the goals scored in classifying the outcomes of five English Premier League seasons using machine learning models. Advances and Applications in Statistics, 87(1): 13-27. https://doi.org/10.17654/0972361723026
[4] Enoma, D.O., Bishung, J., Abiodun, T., Ogunlana, O., Osamor, V.C. (2022). Machine learning approaches to genome-wide association studies. Journal of King Saud University-Science, 34(4): 101847. https://doi.org/10.1016/j.jksus.2022.101847
[5] Melnyk, M., Leshchukh, I., Prytula, K., Chirodea, F., Maksymenko, A., Kurowska-Pysz, J., Kalat, Y., Michniak, D. (2023). Adapting multimodal transportation infrastructure to changing transport and logistics routes. International Journal of Transport Development and Integration, 7(2): 77-84. https://doi.org/10.18280/ijtdi.070202
[6] Aksh, P., Parita, O., Smita, A. (2023). Sentiment analysis of customer feedback and reviews for airline services using language representation model. Procedia Computer Science, 218: 2459-2467. https://doi.org/10.1016/j.procs.2023.01.221
[7] Claussen, J., Essling, C., Peukert, C. (2018). Demand variation, strategic flexibility and market entry: Evidence from the U.S. airline industry. Strategic Management Journal, 39(11): 2877-2898. https://doi.org/10.1002/smj.2940
[8] Vitetta, A. (2022). Network design problem for risk reduction in transport system: A models specification. International Journal of Transport Development and Integration, 6(3): 283-297. https://doi.org/10.2495/TDI-V6-N3-283-297
[9] Park, S., Lee, J.S., Nicolau, J.L. (2020). Understanding the dynamics of the quality of airline service attributes: Satisfiers and dissatisfiers. Tourism Management, 81: 104163. https://doi.org/10.1016/j.tourman.2020.104163
[10] Matthew, O.A., Babajide, A.A., Osabohien, R., Adeniji, A., Ewetan, O.O., Adu, O., Adegboye, F., Olokoyo, F.O., Adediran, O., Urhie, E., Edafe, O., Itua, O. (2020), Challenges of accountability and development in Nigeria: An auto-regressive distributed lag approach. Journal of Money Laundering Control, 23(2): 387-402. https://doi.org/10.1108/JMLC-10-2019-0086
[11] Babikian, R., Lukachko, S.P., Waitz, I.A. (2002). The historical fuel efficiency characteristics of regional aircraft from technological, operational, and cost perspectives. Journal of Air Transport Management, 8(6): 389-400. https://doi.org/10.1016/S0969-6997(02)00020-0
[12] Chaharbaghi, K. (2007). The problematic of strategy: A way of seeing is also a way of not seeing. Management Decision, 45(3): 327-339. https://doi.org/10.1108/00251740710744981
[13] Dožić, S., Kalić, M. (2015). Three-stage airline fleet planning model. Journal of Air Transport Management, 46: 30-39. https://doi.org/10.1016/j.jairtraman.2015.03.011
[14] Kumar, J. (2020). Case analysis I: How Icarus paradox doomed Kingfisher airlines. Vision: The Journal of Business Perspective, 24(1): 125-127. https://doi.org/10.1177/0972262920903901
[15] Kottas, A.T., Madas, M.A. (2018). Comparative efficiency analysis of major international airlines using Data Envelopment Analysis: Exploring effects of alliance membership and other operational efficiency determinants. Journal of Air Transport Management, 70: 1-17. https://doi.org/10.1016/j.jairtraman.2018.04.014
[16] Hastie, T., Tibshirani, R., Friedman, J.H. (2009). The Elements of Statistical Learning: Data Mining, Inference, and Prediction. Springer, New York. https://doi.org/10.1007/978-0-387-21606-5
[17] James, G., Witten, D., Hastie, T., Tibshirani, R. (2013). An Introduction to Statistical Learning with Applications in R. Springer, New York. https://doi.org/10.1007/978-1-0716-1418-1
[18] R Core Team. (2013). R: A Language and Environment for Statistical Computing. R Foundation for Statistical Computing, Vienna, Austria.
[19] Liland, K.H., Mevik, B.H., Wehrens, R., Hiemstra, P. (2023). Partial least squares and principal component regression. Package ‘pls’, version 2.8-3. https://CRAN.R-project.org/package=pls.
[20] Mevik, B.H., Cederkvist, H.R. (2004). Mean squared error of prediction (MSEP) estimates for principal component regression (PCR) and partial least squares regression (PLSR). Journal of Chemometrics, 18(9): 422-429. https://doi.org/10.1002/cem.887