Rendy A. Rachmanto![]() | Farel J. Regannanta
| Farel J. Regannanta![]() | Ubaidillah
| Ubaidillah![]() | Zainal Arifin*
| Zainal Arifin*![]() | Denny Widhiyanuriyawan
| Denny Widhiyanuriyawan![]() | Eflita Yohana
| Eflita Yohana![]() | Singgih D. Prasetyo
| Singgih D. Prasetyo![]()
© 2023 IIETA. This article is published by IIETA and is licensed under the CC BY 4.0 license (http://creativecommons.org/licenses/by/4.0/).
OPEN ACCESS
Indonesia, abundant in solar energy, poses significant potential for harnessing this renewable resource for electricity generation. This study investigates the feasibility of employing photovoltaic (PV) modules, powered by solar energy, for electric vehicle (EV) charging stations in Surakarta, Yogyakarta, Semarang, Surabaya, and Malang. Utilizing the Hybrid Optimization Model for Electric Renewable (HOMER) software, simulations were conducted to assess on-grid Solar Power Plants (PLTS) systems that leverage both PV modules and grid power. This research enhances existing studies on solar energy potential in Indonesia, emphasizing profitable renewable energy business models. Economic evaluations were conducted based on the Net Present Cost (NPC) and the Cost of Energy (COE), integral metrics for determining investment feasibility. Preliminary capital for PLTS development was estimated at Rp 5,399,387,501.00. Results indicate Semarang City as the most promising location for a PLTS system with an NPC value of Rp 23,243,190,000.00 and a COE value of Rp 1,108.11. The designed PLTS system in Semarang City is projected to generate 982.090 kWh/year of electricity, with estimated consumption at 922.467 kWh/year. This study offers novel insights into the potential of solar-powered EV charging stations in Indonesia.
solar power plants, electric vehicles, charging stations, on grid
Indonesia is a tropical country located right on the equator. Indonesia is located at 6° north latitude-11° south latitude, and 95° east longitude-141° longitude. This can indicate that Indonesia will be illuminated by the sun throughout the year. Therefore, Indonesia has enormous potential for developing solar resources [1, 2]. This abundant solar resource must be balanced with maximum utilization, one of which is as a source of electrical energy. Electrical energy is one of the most needed energy by everyone. Electricity can be used as a benchmark for the level of welfare in an area where the community's welfare can be said to increase if the need for the use of electrical energy increases. The source of electrical energy is still dependent on fossil fuels, whose existence is increasingly depleted [3]. The conventional power plants is a separate problem for certain areas, because of which air pollution is getting worse, fossil fuels tend to be limited, so that fuel prices always go up and cause large investment costs in the future. Therefore, alternative energy sources are needed for electrical energy generation.
Solar energy is an alternative energy that can be used as a source of electricity generation, one of which is for the needs of an electric vehicle charging station [4]. Solar energy is an alternative energy that can be used as a source of electricity generation. Currently, the use of solar energy is still limited to supporting household activities such as drying clothes, as well as supporting industries that require drying activities. The potential of solar energy for electricity generation has not been fully utilized in Indonesia. The solar power plant (PLTS) uses sunlight to generate electricity DC (Direct Curent), which can be converted into AC (Alternating Curent) power [5]. The generation of electricity from the sun can be achieved using solar PV (SPV) systems or through concentrating solar-thermal power (CSP) systems that drive conventional turbines [6, 7]. Even though the initial investment costs are much more expensive in the short term, installing PLTS will provide sustainable electricity cost savings and financial benefits in the long term for up to 25 years [8-10]. In an era of climate change and the need for more sustainable mobility, electric vehicles offer a promising solution for reducing greenhouse gas emissions, air pollution, and dependence on fossil fuels [11, 12]. With ever-evolving technology and growing government support, electric vehicles are becoming attractive for drivers worldwide. To achieve sustainable economic development in the future, we need to secure electrical energy at a minimum cost and be safe for the environment. The main advantage of electric vehicles lies in their environmentally friendly nature. Unlike conventional motor vehicles that use internal combustion engines, electric vehicles do not produce direct emissions. This has a positive impact on air quality, reduces noise pollution, and reduces its contribution to global climate change [13, 14]. In addition, electric vehicles also offer strong performance, fast acceleration, and lower operating costs compared to fossil fuel vehicles.
This research aims to simulate the use of PV as a source of electrical energy for electric vehicle charging stations in several cities in Indonesia, namely Surakarta City, Semarang City, Yogyakarta City, Surabaya City, and Malang City. The research used the Hybrid Optimization Model for Electric Renewable (HOMER) software. The research on the design of solar home systems using HOMER has been carried out to determine the most optimal results in designing Solar Power Plants [15]. The design was carried out in two ways, namely manual design and design using HOMER software. The design using HOMER has more optimal results, although it has a higher cost than manual design. Using HOMER, results can be obtained to review the factors determining the cost-effectiveness of on-grid PV systems [16, 17]. On-grid PV system is an energy source that uses solar radiation to generate electricity. The system is connected to the PLN network by optimizing solar energy utilization through solar or photovoltaic modules to generate as much electricity as possible [8, 18]. Essential factors such as load requirements, renewable energy potential, and the capacity and composition of the power generation system, this research can address challenges related to the possibility of using grid-connected PV systems based on household power demand [19]. The output of this study is to determine the most potential areas for utilizing solar energy for EV Charging Stations by looking at several aspects of value, namely Net Present Cost (NPC), Cost of Energy (COE), electricity production per year, consumption power per year, and the return on investment after the business or break event points (BEP).
2.1 Model description
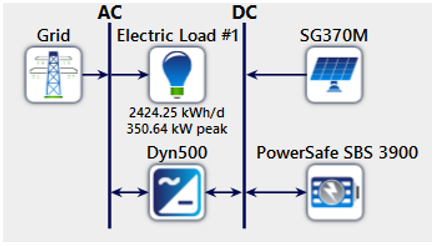
The PLTS configuration implemented at the electric vehicle charging station uses an on-grid configuration. In making a PLTS charging station, several supporting components are needed to optimize the performance of the PLTS system. This design uses HOMER software to model the generated generator system. The components needed are PV solar panels, batteries, and converters. The PLTS system modeling in the HOMER software can be seen in Figure 1.
Figure 1. PLTS modeling scheme
Figure 2. Electrical load profile for charging station
The consumption of the electric load in the HOMER software is estimated using the consumption load for 10 electric vehicles (EV) with a battery capacity of 26.7 kWh each day, so the total daily load is around 267 kW. Details of the electric load profile at the charging station are shown in Figure 2.
The simulated test for charging the Wulling Air-EV Long Range car with a battery capacity of 26.7 kWh and full specifications are shown in Table 1.
To carry out an economic analysis of this PLTS, it is necessary to know the initial investment costs of each component. The initial investment costs required to build a PLTS Charging Station can be seen in Table 2.
Table 1. Willing air-EV long-range specifications
|
Parameter |
Specification |
|
Engine power |
30 kW |
|
Engine torque |
9.34 Nm |
|
Battery capacity |
Lithium Ferro-Phosphate; IP67 Rating 26.7 kWh |
Table 2. PLTS initial investment cost
|
Parameter |
Peimar SG370M |
Enersys PowerSafe SBS 3900 |
Dynapower IPS-500 |
|
Capital Cost |
RP 4,980,000,000.00 |
RP 412,200,000.00. |
RP 7,187,501.00 |
|
Replacement Cost |
- |
RP 412,200,000.00. |
RP 7,187,501.00 |
|
O&M Cost |
RP 5,000,000.00 |
RP 4,000,000.00 |
RP 700,000.00 |
|
Lifetime |
30 |
15 |
15 |
2.2 Description of PLTS design location
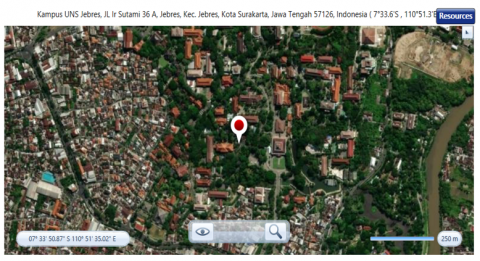
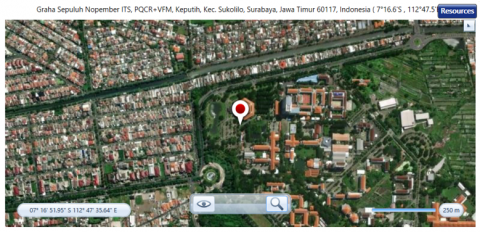
PLTS for this charging station will be simulated in several cities, namely Surakarta City, Yogyakarta City, Semarang City, Surabaya City, and Malang City, to find out which areas have the best economic potential among these cities. The HOMER application has a feature for searching and determining project locations so that from this data, Homer can download the required sources through NASA Prediction of Worldwide Energy Resources (POWER). The location of the installation plan location can be seen in Figure 3.
(a) Location of PLTS at Surakarta City
(b) Location of PLTS at Yogyakarta City
(c) Location of PLTS at Semarang City
(d) Location of PLTS at Surabaya City
(e) Location of PLTS at Malang City
Figure 3. Location of PLTS installation
2.3 Potential utilization of solar energy
The intensity of solar radiation affects the level of heat generated. It affects the amount of energy a power plant creates [20]. Data obtained from the NASA (National Aeronautics and Space Administration) website regarding the intensity of solar radiation and regional temperature can be used to process data regarding the potential use of solar energy for PLTS in Surakarta City, Yogyakarta City, Semarang City, Surabaya City, and Malang City. Data on the intensity of solar radiation in several cities can be seen in Table 3.
Table 3. Solar radiation intensity data
|
Month |
1 |
2 |
3 |
4 |
5 |
|
January |
2.457 |
2.622 |
2.535 |
2.618 |
2.758 |
|
February |
2.596 |
2.603 |
2.603 |
2.827 |
2.919 |
|
March |
3.139 |
3.008 |
3.266 |
3.157 |
3.363 |
|
April |
3.432 |
3.365 |
3.565 |
3.521 |
3.839 |
|
May |
3.960 |
3.688 |
4.174 |
4.385 |
4.219 |
|
June |
4.254 |
3.789 |
4.327 |
4.821 |
4.533 |
|
July |
4.700 |
3.814 |
4.759 |
5.532 |
4.640 |
|
August |
5.018 |
3.826 |
5.060 |
6.144 |
4.876 |
|
September |
4.997 |
3.514 |
5.059 |
6.218 |
5.026 |
|
October |
4.022 |
2.958 |
4.041 |
5.101 |
4.320 |
|
November |
3.029 |
2.410 |
3.144 |
3.379 |
3.234 |
|
December |
2.576 |
2.231 |
2.400 |
2.295 |
2.679 |
|
Average |
3.682 |
3.152 |
3.744 |
4.166 |
3.867 |
|
At a minimum |
2.457 |
2.231 |
2.400 |
2.295 |
2.679 |
Notes: 1. Surakarta, 2. Yogyakarta, 3. Semarang, 4. Surabaya, 5. Malang; Radiation intensity data in kWh/m2 units
The more excellent value of the intensity of solar radiation, the greater the level of output power efficiency that can be produced by the PLTS [21, 22]. Based on the data, it is known that the highest average intensity of solar radiation is Surabaya City, with an average radiation intensity of 4.166 kWh/m2.
2.4 Design of PLTS component specifications
2.4.1 Methodology limitations
The configured lifespan for the created system is estimated to be 25 years. The types of components used are made same, such as the types of photovoltaic modules, inverters and batteries. The analysis of the projected return on investment is conducted using data provided in HOMER. Input data in the economic window include discount rates, inflation rates, project length, and currency. Due to the project's location in Indonesia, the currency is rupiah, a discount rate of 5.75%, and an inflation rate of 4.97% are obtained through data from Bank Indonesia [23].
2.4.2 Total load
The initial step in this design is to determine the total daily load used. The total daily load data is based on the electrical load at the charging station in general in a Solar Home System circuit in Table 4.
Table 4. Daily total load data
|
Afternoon (07.00-17.00) |
Evening (17.00-07.00) |
||
|
O'clock |
Load (kW) |
O'clock |
Load (kW) |
|
7 |
10 |
18 |
13 |
|
8 |
26.7 |
19 |
10 |
|
9 |
26.7 |
20 |
3 |
|
10 |
26.7 |
21 |
3 |
|
11 |
26.7 |
22 |
3 |
|
12 |
26.7 |
23 |
3 |
|
13 |
26.7 |
0 |
3 |
|
14 |
26.7 |
1 |
3 |
|
15 |
26.7 |
2 |
3 |
|
16 |
26.7 |
3 |
3 |
|
17 |
26.7 |
4 |
3 |
|
|
|
5 |
3 |
|
|
|
6 |
3 |
|
Total (kW) |
277 |
|
56 |
|
30% load increase, so the total power (kW) |
285.31 |
|
57.68 |
|
Total load per day (kW) |
342.99 |
||
2.4.3 Solar panels
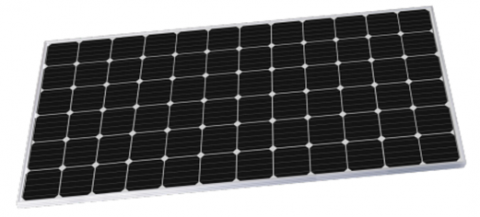
Solar panels, also known as solar or photovoltaic modules (PV modules), work by using the photovoltaic effect of the semiconductor material in the panel to convert solar radiation directly into electrical energy [24]. This time, the type of solar panel used in the PLTS system is a solar panel with the Peimar SG370M brand. This solar cell has the specifications shown in Table 5; the object can be seen in Figure 4.
Table 5. Solar panel specifications
|
Technical Specifications |
Mark |
|
Maximum power (Pmax) |
370Wp |
|
Maximum voltage (Vmp) |
40.1V |
|
Maximum current (Imp) |
9.23A |
|
Open circuit voltage (Voc) |
48.93V |
|
Short circuit current (Isc) |
9.81A |
|
Frequency |
50Hz |
|
Module efficiency |
19.07% |
|
Derating factor |
80% |
To find out the total capacity requirements of the solar panels to be able to supply the EV charging station, it must first know the losses in the system, the total energy of the PV module, and the capacity of the PV module along with the amount needed if the nominal power of the module is 370 Wp according to the specifications of the PV module. The amount of losses in the system can be seen in Table 6.
Figure 4. Peimar SG370M solar panel
Table 6. System losses
|
Type of Loss |
Percentage |
|
PV module |
11.5% |
|
Network inverters |
3% |
|
Battery inverters |
6% |
|
Wiring |
2% |
|
Battery |
15% |
|
Total loss at night |
37.5% |
|
Total daylight losses |
22.5% |
So that the capacity of the solar module is obtained as follows.
$\begin{gathered} { Total \,module \,energy }=\frac{ { Night\, energy }}{100 \%-\text { losses at night }}+ \frac{ { Daytime \,energy }}{100 \% \text {-losses at noon }}\end{gathered}$
$Total\, module\, energy$ $=\frac{57.68 \mathrm{kWh}}{62.5 \%}+\frac{285.31 \mathrm{kWh}}{77.5 \%}$
$Total \,module \,energy$ $=460.43 \mathrm{kWh}$
Determination of the number of solar panels based on total load usage per day, total hours per day during peak sun hours of 1000 W/m2/h through data on average solar radiation potential of 4.80 kWh/m2/h, and the capacity of the solar panels used is 370 Wp. A simple calculation to determine the number of solar panels is as follows.
$P V=\frac{\text { Total modul energy }}{\text { Capacity of solar panel }}$
$P V=\frac{460430}{370}=1244.4$ or $1245 P V$
With a 370 Wp solar panel specification, 1245 PV module units are needed to meet the load requirements at the EV charging station. The cost required for 1245 units of 370 Wp solar panels is RP 4,980,000,000.00 with an operation & maintenance cost of RP 50,000,000.00. The PV module has a lifetime of 30 years, so it does not require replacement costs.
2.4.4 Inverters
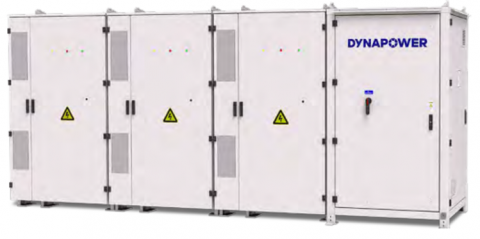
An inverter is a tool used to convert DC (direct current) generated from solar panels into AC (alternating current) for use by household appliances in general [25]. The inverter output power does not depend on the load's magnitude connected with the inverter. However, it is proportional to the amount of power generated by solar panels at that time [26]. The total of all electrical loads is 342.99 kW, while the inverter used is Dynapower IPS-500. This inverter has the specifications shown in Table 7, and the object can be seen in Figure 5.
Table 7. Dynapower IPS-500 specifications
|
Types of Technical Specifications |
Mark |
|
Output power |
500 kW |
|
Maximum power |
500 kW |
|
Output frequency |
50/60 Hz |
|
Input dc voltage |
100-1500 V |
|
Efficiency |
98.2% |
Figure 5. Dynapower IPS-500
Then the power and the number of inverters needed are:
$P_{\text {inverter }}=\frac{\text { Total electrical loads } × 125 \%}{\text { Maximum power }}$
$P_{\text {inverter }}=\frac{342990 \times 125 \%}{500000}=0.857$ or 1 inverter
Therefore, the number of inverters to be used in HOMER is one inverter, which has a capacity of 500 kW. The cost required for 1 unit of this type of inverter is Rp 7,187,501.00, with an operation & maintenance cost of Rp 700,000.00. The inverter used has a lifetime of 15 years, so it requires a replacement cost of Rp 7,187,501.00.
2.4.5 Battery
Batteries are components that function as energy storage devices generated by solar panels. The battery aims to store excess electrical energy when the load requirements are low, supply electrical energy when needed at high loads, and supply energy electricity at night [27]. Without a battery, PLTS can only be used during the day or when the sun shines. The battery that will be used in the design of this PLTS system is EnerSys PowerSafe SBS 3900. The battery used is a lead acid-type battery with a voltage of 12 V and a current of 4300 Ah, which has a power capacity of 51.6 kWh. This type of battery has the specifications shown in Table 8; the object can be seen in Figure 6.
Table 8. Energy PowerSafe SBS 3900 battery specifications
|
Types of Technical Specifications |
Mark |
|
Normal voltage |
2 V |
|
Internal holding capacity |
0.18 mΩ |
|
Nominal capacity |
4300 Ah |
Figure 6. Energy PowerSafe SBS 3900 battery
The number of batteries to be used is based on the total load per day and the capacity of the batteries used. A simple calculation to determine the number of batteries is as follows.
Battery $=\frac{\text { Total electrical loads }}{\text { Power capacity battery } × 80 \%}$
Battery $=\frac{342990}{51600 \times 80 \%}=8.31$ or 9 batteries
Therefore, the number of batteries to be used in HOMER is 9. The cost required for 9 units of this type of battery is Rp 412,200,000.00, with operation & maiXntenance costs per year of Rp 4,000,000.00. The battery used has a lifetime of 15 years, so it requires a replacement fee of Rp 412,200,000.00.
3.1 HOMER simulation results
The simulation process is carried out to get the best system configuration through the optimization process on HOMER. The simulation process models and designs the system configuration specifically, then the optimization process is carried out to determine the best possibility in the system configuration. The system configuration results in the HOMER application having a solar panel with a capacity of 460.65 kW, a total of 9 batteries of 51.6 kWh, a 500 kW converter, and an on-grid type network.
Based on the simulation that has been carried out, the results of the energy produced by the system each year can be seen in Table 9.
Table 9. Electricity production per year
|
City |
Production |
Production Power (kWh/year) |
Total Production (kWh/year) |
|
Surakarta |
PV |
515.579 |
954.959 |
|
Grids |
439.380 |
||
|
Yogyakarta |
PV |
516.967 |
959.188 |
|
Grids |
442.221 |
||
|
Semarang |
PV |
586.287 |
982.090 |
|
Grids |
395.803 |
||
|
Surabaya |
PV |
548.088 |
964.960 |
|
Grids |
416.873 |
||
|
Malang |
PV |
552.710 |
972.037 |
|
Grids |
419.327 |
In addition, there are also results of the consumption of electricity loads per year, which can be seen in Table 10.
Table 10. Electric power consumption per year
|
City |
Consumption |
Power Consumption (kWh/year) |
Total Consumption (kWh/year) |
|
Surakarta |
AC primary load |
884.852 |
908.220 |
|
Grid sales |
23.368 |
||
|
Yogyakarta |
AC primary load |
884.852 |
907.722 |
|
Grid sales |
22.870 |
||
|
Semarang |
AC primary load |
884.852 |
922.467 |
|
Grid sales |
37.615 |
||
|
Surabaya |
AC primary load |
884.852 |
912.890 |
|
Grid sales |
28.038 |
||
|
Malang |
AC primary load |
884.852 |
916.099 |
|
Grid sales |
31.247 |
Based on Table 9, the most potential city with the highest total power production is Semarang City with 982.090 kWh/year. Meanwhile, based on Table 10, the most potential data with the lowest total power consumption is Yogyakarta City, which is 907.722 kWh/year.
3.2 Net Present Cost (NPC)
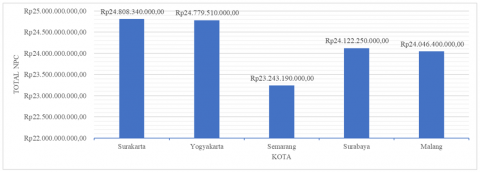
The most optimal system configuration results are determined by the magnitude of the NPC (Net Present Cost) because NPC is the cost of the entire system over a certain period; for that, Homer sorts the optimization results from the lowest NPC [28]. The total NPC cost includes all costs incurred during the project, consisting of component, replacement, maintenance, fuel, and interest rate costs; the amount of NPC generated by this configuration is shown in Figure 7.
Figure 7. Total NPC per city
Based on Figure 7, the most potential city with the lowest total NPC is Semarang City, which is Rp 23,243,190,000.00. Meanwhile, the largest total NPC is Surakarta City, with a total NPC of Rp 24,808,340,000.00.
3.3 Cost of Energy (COE)
The COE of the system is obtained after knowing the annual cost of the system and the amount of electricity consumption per year [28]. The COE value compares the annual cost and the amount of electricity consumption per year, so the COE value obtained in each city can be seen in Table 11.
Table 11. COE value
|
City |
COE |
|
Surakarta |
Rp 1,201.28 |
|
Yogyakarta |
Rp 1,200.55 |
|
Semarang |
Rp 1,108.11 |
|
Surabaya |
Rp 1,162.09 |
|
Malang |
Rp 1,154.37 |
Based on Table 11, the most potential city with the lowest total COE is Semarang City, which is Rp 1,108.11, while the most considerable COE value was for Surakarta City, Rp 1,201.28.
3.4 Break event points (BEP)
BEP is a condition where the value of investment and income is at point 0, or it can be said to be in a condition with no losses and no profits [28]. The BEP value in units is needed to estimate in what year investors start to experience profits. The system simulation results using HOMER in each city are shown in Table 12.
Table 12. BEP for each city
|
City |
BEP Occurred Year |
|
Surakarta |
11.87 |
|
Yogyakarta |
11.55 |
|
Semarang |
10.09 |
|
Surabaya |
11.07 |
|
Malang |
10.83 |
Based on Table 12, the most potential city with the lowest BEP is Semarang City, which is 10.09 years. It shows that Semarang City is a profitable city for the solar energy-based EV charging station business.
The research with the same model has been carried out by Wurangian et al. [15] in Manado City. Through the configuration of the HOMER system, the best possibility is obtained in the configuration of PLTS in Manado City. Therefore, with the same method, the most optimal design comparison can be obtained among several cities studied by considering the total power production, total power consumption, NPC value, COE value, and BEP value.
This research compares the design of EV charging stations in several cities in Indonesia, namely Surakarta City, Semarang City, Yogyakarta City, Surabaya City, and Malang City. This research uses the Hybrid Optimization Model for Electric Renewable (HOMER) software by comparing several factors, namely total power production, total power consumption, NPC value, COE value, and BEP value. The most optimal design is the city that produces the highest total power production, the lowest total power consumption, the lowest NPC, the lowest COE, and the lowest BEP. Based on the results of the simulation that has been carried out, the city with the highest potential value is Semarang City. The initial investment for PLTS development for the EV charging station is Rp5,399,387,501.00. The design of the EV charging station in Semarang City is capable of producing a total production power of 982.090 kWh/year with a total consumption power of 922.467 kWh/year. This design has NPC value of Rp23,243,190,000.00, COE value of Rp1,108.11, and the return on investment after the business has been running for 10.09 years. This research is expected to help explore the utilization of solar energy in locations that face challenges in accessing electricity.
This research was fully supported by the PNBP grant from the Sebelas Maret University, Indonesia, with contract number 228/UN27.22/PT.01.03/2023 of the Mandatory Riset (mr-uns) scheme.
[1] Amalia, D., Abdillah, H., Hariyadi, T.W. (2022). Analisa perbandingan daya keluaran panel surya tipe monokristalin 50wp yang dirangakai seri dan paralel pada instalasi plts off-grid. Jurnal Elektro dan Mesin Terapan, 8(1): 12-21. https://doi.org/10.35143/elementer.v8i1.5187
[2] Amrizal, Winardi, W., Prasetyo, J., Irsyad, M. (2022). Performance analysis of PV/T-TEC collector for the tropical climate conditions of Indonesia. Journal of Advanced Research in Fluid Mechanics and Thermal Sciences, 95(2): 72-83. https://doi.org/10.37934/arfmts.95.2.7283
[3] Arifin, Z., Prasetyo, S.D., Tjahjana, D.D.D.P., Rachmanto, R.A., Prabowo, A.R., Alfaiz, N.F. (2022). The application of TiO2 nanofluids in photovoltaic thermal collector systems. Energy Reports, 8: 1371-1380. https://doi.org/10.1016/j.egyr.2022.08.070
[4] Breeze, P. (2016). Solar photovoltaic technologies. Solar Power Generation, 2016: 51-55. https://doi.org/10.1016/B978-0-12-804004-1.00008-7
[5] Ramadhana, R.R., Iqbal, M., Hafid, A., Adriani, A. (2022). Analisis PLTS on grid. VERTEX ELEKTRO, 14(1): 12-25. https://doi.org/10.26618/jte.v14i1.9143
[6] Mohammed, M.O., Simon, S.P., Kumar, K.A., Sundareswaran, K., Nayak, P.S.R., Padhy, N.P. (2020). Impact and economic assessment on solar PV mirroring system-a feasibility report. Energy Conversion and Management, 203: 112222. https://doi.org/10.1016/j.enconman.2019.112222
[7] Ghirardi, E., Brumana, G., Franchini, G., Perdichizzi, A. (2021). The optimal share of PV and CSP for highly renewable power systems in the GCC region. Renewable Energy, 179: 1990-2003. https://doi.org/10.1016/j.renene.2021.08.005
[8] Christopher, D.P.H., Mochamad, S., Putri, G.P.A. (2022). Kajian industri energi terbarukan tenaga listrik di Indonesia berdasarkan arah kebijakan dan potensi alam. G-Tech: Jurnal Teknologi Terapan, 6(2): 276-283. https://doi.org/10.33379/gtech.v6i2.1690
[9] Kusuma, D.Y. (2023). Pelatihan operasional dan pemeliharaan pembangkit listrik tenaga surya (plts) grid-tie utility scale sebagai upaya edukasi masyarakat kalurahan serut, gedangsari, gunung kidul menuju desa mandiri energi. Dharmakarya: Jurnal Aplikasi Ipteks Untuk Masyarakat, 12(1): 134-140. https://doi.org/10.24198/dharmakarya.v12i1.36584
[10] Nugraha, I.M.A., Serihollo, L.G.G., Siregar, J.S.M., Desnanjaya, I.G.M.N. (2022). Kajian pemanfaatan dan ketersediaan PLTS sebagai sumber energi listrik pada kapal 5 GT di Nusa Tenggara Timur. Jurnal Kelautan Nasional, 17(2): 123-130. https://doi.org/10.15578/jkn.v17i2.8831
[11] Prasetyo, S.D., Prabowo, A.R., Arifin, Z. (2023). The use of a hybrid photovoltaic/thermal (PV/T) collector system as a sustainable energy-harvest instrument in urban technology. Heliyon, 9(2): e13390. https://doi.org/10.1016/j.heliyon.2023.e13390
[12] Prasetyo, S.D., Prabowo, A.R., Arifin, Z. (2022). Investigation of thermal collector nanofluids to increase the efficiency of photovoltaic solar cells. International Journal of Heat & Technology, 40(2): 415-422. https://doi.org/10.18280/ijht.400208
[13] Koesalamwardi, A.B., Eldrian, A., Irene, Tjahyadi, W. (2020). Kelayakan finansial near zero energy building dengan peraturan kementerian energi dan sumber daya mineral no. 49 Tahun 2018 mengenai insentif energi terbarukan. Jurnal Infrastruktur, 6(1): 69-75. https://doi.org/10.35814/infrastruktur.v6i1.1421
[14] Fagerström, J., Kvalbein, L., Danebergs, J., Uberg Nærland, T., Øgaard, M., Aamodt Espegren, K. (2022). Hybrid PV systems and colocalization of charging and filling stations for electrification of road transport sector. Solar RRL, 6(5): 2100461. https://doi.org/10.1002/solr.202100461
[15] Wurangian, J.A., Rumbayan, M., Tulung, N.M. (2021). Perancangan solar home system menggunakan HOMER. Jurusan Teknik Elektro, 1-7.
[16] Arifin, Z., Suyitno, Tjahjana, D.D.D.P., Muqoffa, M., Prasetyo, S.D., Alfaiz, N.F., Sanusi, A. (2022). Grid-connected hybrid PV-wind system simulation in Urban Java. Journal Européen des Systèmes Automatisés, 55(4): 477-483. https://doi.org/10.18280/jesa.550406
[17] Asfar, J.A., Atieh, A., Al-Mbaideen, R. (2019). Techno-economic analysis of a microgrid hybrid renewable energy system in Jordan. Journal Européen des Systemes Automatisés, 52(4): 415-423. https://doi.org/10.18280/jesa.520412
[18] Halim, L. (2022). Analisis teknis dan biaya investasi pemasangan PLTS on grid dan off grid di Indonesia. RESISTOR (Elektronika Kendali Telekomunikasi Tenaga Listrik Komputer), 5(2): 131-136. https://doi.org/10.24853/resistor.5.2.131-136
[19] Hader, M., Hanbali, M., Al‐Kouz, W. (2021). Feasibility study of a hybrid photovoltaic/thermal collector system in the climate of Jordan. Heat Transfer, 50(5): 4435-4461. https://doi.org/10.1002/htj.22082
[20] Esfe, M.H., Toghraie, D. (2022). Numerical study on the effect of solar radiation intensity on the fresh water productivity of solar still equipped with thermoelectric cooling system (TEC) for hot and dry areas of Semnan. Case Studies in Thermal Engineering, 32: 101848. https://doi.org/10.1016/j.csite.2022.101848
[21] Wijanarko, P.H., Agus Supardi, S.T. (2022). Evaluasi efektifitas pemanfaatan panel surya pada penerangan jalan umum (PJU) kec. selo, kab. boyolali. Universitas Muhammadiyah Surakarta.
[22] Matahari Untuk PLTS di Indonesia. (2012). ESDM, https://www.esdm.go.id/id/media-center/arsip-berita/matahari-untuk-plts-di-indonesia, accessed on Jul. 17, 2023.
[23] Sulaiman, S. (2023). Indonesia’s April annual inflation eases to 4.33%, below forecast. https://www.reuters.com/markets/asia/indonesias-april-annual-inflation-433-2023-05-02/.
[24] Gilbile, P., Pisal, R., Dagade, T., Digole, S. (2023). Numerical investigation of heat transfer characteristics of spiral, helical, and conical tubes. Materials Today: Proceedings, 72: 1556-1560. https://doi.org/10.1016/j.matpr.2022.09.386
[25] Ceylan, C., Devrim, Y. (2023). Green hydrogen based off-grid and on-grid hybrid energy systems. International Journal of Hydrogen Energy. https://doi.org/10.1016/j.ijhydene.2023.02.031
[26] Santoso, H.B., Budiyanto, B. (2014). Microgrid development using a grid tie inverter. Makara Journal of Technology, 17(3): 4. https://doi.org/10.7454/mst.v17i3.2927
[27] Prayogo, S. (2019). Pengembangan sistem manajemen baterai pada PLTS menggunakan on-off grid tie inverter. Jurnal Teknik Energi, 9(1): 58-63. https://doi.org/10.35313/energi.v9i1.1646
[28] Bagaskoro, B., Windarta, J., Denis, D. (2019). Perancangan dan analisis ekonomi teknik pembangkit listrik tenaga surya sistem offgrid menggunakan perangkat lunak homer di kawasan wisata pantai pulau cemara. Transient: Jurnal Ilmiah Teknik Elektro, 8(2): 152-157. https://doi.org/10.14710/transient.v8i2.152-157