I Gede Tunas*![]() | Muhammad Galib Ishak
| Muhammad Galib Ishak![]() | Saparuddin | Rudi Herman
| Saparuddin | Rudi Herman![]()
© 2024 The authors. This article is published by IIETA and is licensed under the CC BY 4.0 license (http://creativecommons.org/licenses/by/4.0/).
OPEN ACCESS
The phenomenon of local scour downstream of irrigation weir energy dissipators is one of the basic degradation problems in hydraulic structures on rivers. The hydraulic jump in the stilling basin, which is triggered by flow turbulence due to energy dampening, forms current vortices in horizontal and vertical directions. Eddy currents that are not fully controlled and damped in the stilling basin can cause scouring, especially in the vertical direction just downstream of the energy dissipators construction. Simultaneous accumulation of scour in the long term can endanger buildings around the weir, especially the stilling basin, both downstream wings and the main weir. This paper aims to assess weir safety by predicting scour characteristics under end sill energy dissipators using the hybrid model: HEC-RAS and Scour Empirical Equation. The simulation is carried out on three conditions, namely minimum, average and maximum discharges with input of sediment grain gradations obtained from field measurements. The three types of discharge are obtained from the transformation of daily rainfall into daily discharge using the HEC-HMS Model. The results of scour predictions in the 3 scenarios were compared with the results of scour measurements at the study location. The results of the study indicate that the greatest scour depth at the maximum discharge of almost 1.5 meters has reached the depth of the end sill of the energy dissipator. This prediction result was also verified by the observation scour depth of more than 1.5 meters. Observation results also show that the Energy Dissipator II has collapsed massively both in the center and on the left and right sides of the energy dissipator. Based on the results of the study and investigation, it can be concluded that the weir safety at the study location can be categorized as low with the potential for very large scour.
local scour, weir safety, stilling basin, HEC-RAS, hydraulic jump
A weir is a hydraulic structure that functions to raise the water level in a river by damming the flow [1]. This flow damming aims to direct the flow to enter the intake structure and then flow to the primary channel with a wider service range [2]. The adequacy of flow distribution throughout the irrigation area is very dependent on the stability of the discharge entering the channel in accordance with the water level controlled by the weir spillway [3, 4].
One of the important components of the weir as a complement to the spillway and intake is the stilling basin. This structure functions to dissipate the flow energy created above the spillway due to very drastic changes in slope [5]. This weir component is very susceptible to damage due to bottom scouring initiated at the end of the stilting basin floor. Residual energy attenuation in the stilling basin is thought to be the trigger for scour [6]. The scour pattern starts in a vertical downward direction and then propagates in a horizontal direction both sideways towards the river bank and upstream beneath the stilling basin floor. The stability and resilience of this structure is an indicator for monitoring the safety of the weir. Moreover, the effective age of a weir can also be measured from the reliability of the energy dissipator against damage triggered by flow turbulence [7, 8].
Studies on weir safety by monitoring bed scour downstream of the end sill of the weir have been carried out by a number of researchers. Farhoudi et al. [9] developed a neuro-fussy based artificial intelligence model to predict the depth of scour downstream of the energy dissipator of the weir at various discharge levels, tail water depth above the end sill, channel bed material and model size. The study results only confirm that the tested model performs well in estimating local scour depth. Mehnifard et al. [10] studied local scour downstream of an under-sluice gate using Flow-3D. The scour depth profile resulting from the simulation was validated with laboratory experimental results as a phenomenon similar to the scour profile resulting from flow over the weir spillway. The use of this numerical model shows good performance with low errors.
El-Hazek et al. [11] conducted a laboratory experimental study regarding the optimal position and dimensions of stilling basins to reduce bed scour in relation to increasing weir safety. A regression equation was developed to calculate the optimal floor length of the stilling basin as a function of several independent parameters, especially the length of the hydraulic jump. A similar study was also carried out by Hojjati and Zarrati [12] by performing numerical analysis to investigate local scour phenomena downstream of the energy dissipator. Scour estimation based on the developed numerical model shows the similarity of predictions with laboratory experimental results.
It is indicated that the studies that have been carried out by a number of researchers have not yet been compared and verified with the results of field investigations over a long period of time. Moreover, the safety of the weir as evaluated from the potential for scour has not been discussed in more detail in these publications. This paper is important in relation to the evaluation of weir safety due to local scour by comparing the results of predictions and field investigations. Various cases in the field show damage to the weir construction starting from the scouring bed downstream of the stilling basin and then propagating horizontally to the left and right sides and upstream approaching the spillway foundation. In the long term, this local scouring can cause the dam construction to collapse. Therefore, the results of this study can be used as a reference in evaluating Weir security.
2.1 Study area
This study was carried out at Sibado Weir, one of the irrigation weirs in Indonesia, precisely in Sibado Village, Sirenja District, Donggala Regency, Central Sulawesi Province, Indonesia (Figure 1). This weir supplies water needs for irrigation of approximately 127 hectares on the left side and 230 hectares on the right side. Geographically, this weir is located at coordinates 119°50'15.62"E, 0°13'7.12"S with an elevation of 120 meters above sea level.
This weir was built in 1997 by the Central Sulawesi Irrigation Project with the aim of developing a technical irrigation system in the Donggala Regency area to support rice productivity in Central Sulawesi Province. This weir was installed in a catchment outlet covering an area of approximately 103.47 km2 with a fixed weir construction type equipped with tapping structures on both sides of the weir.
The Sibado River also supplies clean water for communities in several villages in Sirenja District. The water flow enters through a tapping structure located upstream of the weir on the right side of the river bank. Next, the water is distributed to the service area through a pipeline network with a gravity drainage system which is placed parallel to the irrigation canal. The discharge for providing clean water is relatively much lower than the discharge for irrigation, around 10% of the total dependable discharge of the Sibado River. This water demand is predicted to continue to increase due to population growth and an increase in the area of functional irrigated land.
Based on field observations, this weir has been rehabilitated several times due to damage to several components such as the spillway, downstream wing, gate and stilling basin. Very large discharge fluctuations are one of the factors causing damage to this structure, apart from the stilling basin capacity which is not yet optimal. Actually, the stilling basin construction has been improved by extending the floor in Segment II. This is intended to prevent scour under the end sill in the stilling basin in Segment I. However, the additional construction of energy dissipators has not been able to protect the foundation due to scouring.
Figure 1. Detail location of research site
Based on field documentation for the 2018-2022 period, in the last five years damage to the stilling floor has increased along with the increase in flood discharge and sediment transport originating from the upstream catchment (Figure 2). Changes in rainfall patterns and land cover are predicted to be the main triggers for large discharge fluctuations at the weir site. In 2018, it was seen that the floors of Stilling Basin I and II were still in good condition (Figure 2(a)), although there was erosion of the top layer of the two weir components. The floor of Stilling Basin II is covered by coarsely graded sediment with an uneven distribution. Furthermore, the 2020 documentation shows several points of damage on the Stilling Basin II floor with a moderate level of damage (Figure 2(b)). However, two years later, damage to Stilling Basin II increased massively throughout the stilling basin construction. The damage has even spread to Stilling Basin I, marked by the collapse of the stilling basin construction, especially in the middle part.
2.2 Data
The main data of this research is the original design of the Sibado Weir as shown in Figure 3. This irrigation weir is a permanent construction consisting of several components such as upstream apron, upstream wings on both sides, spillway, energy dissipator consisting of Stilling Basin I and Stilling Basin II. This weir with a 40-meter-long spillway is supported by intake structures on both the left and right sides to direct the flow to the primary channel.
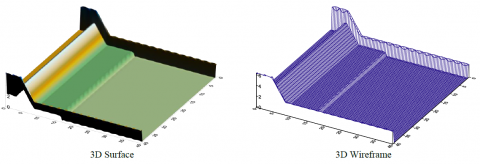
The perspective view of the weir as in Figure 4 both 3D Surface and 3D Wireframe informs that the elevation difference between the spillway crest and the floor of Stilling Basin I is 3.5 meters. The peak elevation requirement for the spillway is based on the elevation and area of the rice fields to be served. The spillway elevation must be able to guarantee sufficient water entering through the intake according to needs based on the area served.
Figure 2. Condition of stilling basin of Sibado Weir 1998-2022
Figure 3. Detail of Sibado Weir (non-scale): (a) Long section, (b) Plan view. S1, S2 and S3 are the site location of sediment survey
Figure 4. Perspective view of Sibado Weir
Figure 5. Observed scouring pattern of Sibado Weir
After operating for more than 20 years, the performance of this weir is indicated to have decreased, especially the durability of the energy dissipators protecting the river bed from local scouring. High flow turbulence flowing from the top of the spillway triggers large energy due to the transformation of the flow regime from sub-critical flow to supercritical flow. Sudden changes in flow velocity on the downstream side of the spillway create flow instability which causes great damage to the media it passes through, especially banks and riverbeds.
Another important data for this study is the bathymetry downstream of the weir which was measured using a single geodetic GPS receiver with a 0.5-meter grid (Figure 5). The results of topographic mapping of the river bed show the impact of flow turbulence on the stability of the river bed even though the energy has been reduced in Stilling Basin I. Local scouring due to this residual energy has caused the river bed to decrease by more than 1.5 meters. Flow turbulence not only erodes the middle of the river bed, but also spreads to the left and right sides.
Other important data to support this study is discharge data which is transformed from rainfall data using the HEC-HMS Model. This rainfall data is recorded in the Karya Mukti Rainfall Gauge installed by the Sulawesi III River Basin Board. Apart from that, a field survey has also been carried out to take bed sediment samples S1, S2 and S3 as shown in Figure 3(b).
2.3 Method
Analysis of scour downstream of the energy dissipator can be performed using a hydrodynamic model, in this case the hybrid model: HEC-RAS, Scour Empirical Equation and Flow-3D. The use of these two approaches is intended to overcome the weaknesses of each approach. Analysis of scour depth downstream of the energy dissipator cannot specifically be performed in the HEC-RAS Model. This model can accurately analyze the water level profile in all hydraulic structures including weirs. The use of HEC-RAS for this analysis is only to obtain flow characteristics upstream of the weir, above the spillway, on the stilling basin floor and downstream of the end sill. The main input for this analysis is the minimum, average and maximum discharge which is transformed from daily rainfall data using the HEC-HMS Model. Each discharge input produces the parameters needed to predict the depth of scour using an empirical approach, namely the difference in energy height upstream and downstream $(\Delta h)$ [13].
HEC-RAS is a hydraulics model developed by USACE-HEC for modeling flow in open channels, both one dimensional steady flow and one/two dimensional unsteady flow. The governing equations used in this model are the energy equation and the momentum equation. An important parameter that can be calibrated and validated in this model is the Manning roughness coefficient by evaluating the calculated water level at each cross-section based on the observed water level. This model is only performed to determine parameters as input for Scour Empirical Equation and Flow-3D to predict scour.
To date, several empirical equations have been developed to calculate the depth of scour, each with its respective advantages and disadvantages. The simplest formula for predicting the depth of scour downstream of the energy dissipator is the Lacey method, which is expressed as the function of two parameters [14]:
$d_s=0.47\left(\frac{Q}{f}\right)^{1 / 3}$ (1)
$f=1.76 D_{50}^{0.5}$ (2)
where: $d_s=$ scour depth $(\mathrm{m}), Q=$ discharge $\left(\mathrm{m}^3 / \mathrm{s}\right), f=\operatorname{mud}$ factor of Lecay dan $D_{50}=$ average diameter of sediment particle (m).
The weakness of the Lacey Method is that it does not take into account differences in water level upstream and downstream of the weir. This weakness can be anticipated using the Eggenberger et Muller Formula by accommodating the difference in energy height but is limited to vertical structures which is expressed by the formula [15]:
$h+d_s=w+\frac{\Delta h^{0.5} q^{0.6}}{D_{90}^4}$ (3)
$h=$ normal depth (m), $w=$ scour factor which depends on the diameter of the sediment grains, $d_{90}$ where $\mathrm{w}=22.88 \mathrm{~s}^{0.6} / \mathrm{m}^{0.3}$ if $D_{90}$ in $\mathrm{mm}, \Delta h=$ difference in upstream and downstream energy levels $(\mathrm{m}), q=$ discharge per unit width $\left(\mathrm{m}^3 / \mathrm{s}^2\right)$ and $D_{90}$ $=$ diameter of sediment particle $90 \%(\mathrm{~mm})$. Another formula was also developed by Katoulas (1967) to predict the depth of scour by adding the gravitational acceleration parameter, as follows [16,17] :
$h+d_s=1.9 \frac{1}{g^{0.35}} \frac{\Delta h^{0.35} q^{0.7}}{D_{95}^4}$ (4)
where: g= gravitational acceleration (m/s) and D95= diameter of sediment particle 95% (mm) which can be represented by D90. The scour prediction results using these empirical equations are then also combined with analysis using Flow-3D Model.
In detail, the scour modeling procedure is as follows:
1) Rainfall-runoff transformation to determine minimum, average and maximum flow using HEC-HMS model.
2) Determination of flow parameters based on the three discharge conditions using the HEC-RAS model based on the optimal Manning roughness coefficient as input for Scour Empirical Equation and Flow-3D.
3) Calculation of maximum scour using the Scour Empirical Equation.
4) FLOW-3D simulation to visualize the depth of scour throughout the domain downstream of the stilling basin.
3.1 Discharge
As previously informed, the daily discharge of the Sibado River is obtained from the transformation process. The HEC-HMS Model has been assigned to simulate daily discharge based on daily rainfall input for the 2011-2022 period. The sub models used for simulation are Clark UH (transformation method), SCS Curve Number (loss method) and recession (baseflow method). Catchment characteristics represented by topography, land use and land cover (LC) and soil texture (soil type) are transformation parameters that determine discharge estimates [18-20]. The analysis results show that the minimum, average and maximum discharges of the Sibado River are 4.32 m3/s, 15.45 m3/s and 125.9 m3/s respectively.
Based on the interpretation of rainfall data, the Sibado River discharge in the last ten years has been very fluctuating. In the dry season, river discharge can drop to a minimum, likewise during the rainy season, river discharge can reach a maximum. These discharge fluctuations greatly influence the characteristics of sediment transport, especially aggradation and degradation. Moreover, the durability of the weir also depends greatly on the stability of the discharge.
3.2 Sediment gradation
Sediment surveys were carried out at three points upstream of the weir: S1, S2 and S3 using bed sediment traps. The duration of taking each sediment sample ranges from 4 to 5 hours until the instrument is completely filled with sediment. The next stage, all sediment samples were examined at the Structure Laboratory of the Civil Engineering Department, Tadulako University using a sieve test. Analysis of the three samples produced an average grain size as shown in Table 1, in accordance with the modeling input requirements.
In general, sediment grains deposited upstream of the weir are categorized as fine and coarse sand. This is characterized by an escape percentage of 50 percent of sediment grains with a diameter of 2.5 mm. Coarse sediment is generally deposited downstream of the weir, especially on the floor of the stilling basin. On the other hand, fine sediment is generally deposited in the downstream segment around the river outlet. The distribution of sediment grain deposits in the Sibado River is very dependent on the flow discharge and slope of the river bed which affects the sediment velocity.
Table 1. Grainsize of sediment sample
|
Grainsize |
Unit in mm |
|
d35 |
0.8 |
|
d50 |
2.5 |
|
d60 |
5.4 |
|
d90 |
12.1 |
3.3 Local scouring
Local scour downstream of the energy dissipator of Sibado Weir has been performed using a hybrid HEC-RAS model, Scour Empirical Equation and Flow 3D. The most important thing in running this model is determining the most appropriate parameters to obtain a realistic water surface profile due to limited data for calibration. Sensitivity parameter analysis has been performed to determine the roughness coefficient of the river bed and bank as a determinant of flow speed. Sensitivity analysis of the model with respect to parameter calibration is performed by setting several surface roughness coefficients with reference to standard material roughness coefficients. The optimal roughness parameter of 0.0232 is determined by comparing the simulated water depth with the observed water depth. This calibration is carried out simultaneously until the two types of water depth do not differ significantly.
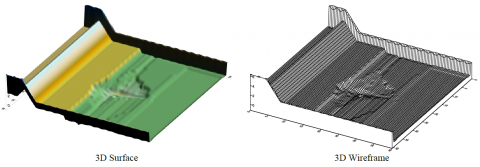
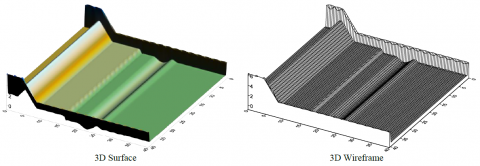
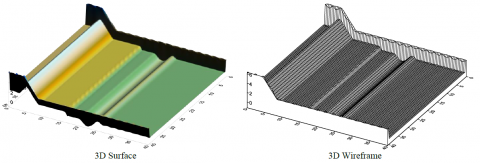
Simulations using the optimal roughness coefficient for three conditions: minimum, average and maximum discharge produce scour patterns as in Figure 6, Figure 7 and Figure 8. The maximum scour depth in each discharge category is 0.69 m, 1.035 m and 1.38 m respectively with a distance of approximately 6 meters from the end sill of the energy dissipator. The scour depth at the maximum discharge is not significantly different from the observed maximum scour depth as in Figure 6.
The scour depth results using the Scour Empirical Equation are not much different from the prediction results using Flow 3D. However, the reference in this study is the depth of scour using the Scour Empirical Equation because the input parameters have been calibrated using the HEC-RAS model. The results of the prediction of scour depth using these two approaches are then presented in 1 graph.
Basically, this type of scour is a form of local scour. An increase in flow velocity over a spillway with a supercritical regime has a very strong scouring force so it must be reduced until it reaches normal conditions again. Even though the dissipator energy has been provided, it is not uncommon for flow energy to remain due to strong turbulence, which triggers scouring at the end of the dissipator energy.
The scour formation that occurs downstream of the stilling basin is a combination of scour depth and flow velocity so that the scour hole is a function of time. The hydraulic jump in the stilling basin as the flow regime changes from supercritical to subcritical creates a sudden rise in water level and large energy losses and ultimately forms a turbulent vortex. This turbulent vortex often reaches stability far downstream from the end of the stilling pool. This residual energy often triggers scours of varying depths.
The scour depth profile in the three discharge categories is shown in Figure 9. This scour pattern is in line with the results of studies carried out by several researchers such as Farhoudi et al. [9], Mehnifard et al. [10], and Hojjati and Zarrati [12]. These researchers are of the opinion that scouring is indicated as a process of deepening of the river bed due to the interaction between the flow and the river bed material. This process is caused by changes in flow patterns that pass through a river cross-section so that river bed particles will be picked up and transported from their area of origin in layers and this process occurs simultaneously until a new river bed balance is reached.
The depth of scour as shown in Figure 9 indicates that the dissipator energy condition is unstable. When compared with real conditions in the field, the energy dissipator has collapsed with damage to the floor of the stilling basin up to the foundation of the weir. This proves that the safety factor of Sibado Dam is in the low category with indicators of high scour depth and very serious damage to the stilling basin floor.
Figure 6. Predicted scouring pattern of Sibado Weir on minimum discharge (Qmin)
Figure 7. Predicted scouring pattern of Sibado Weir on average discharge (Qave)
Figure 8. Predicted scouring pattern of Sibado Weir on maximum discharge (Qmax)
Figure 9. Longitudinal profile of the bed scour at minimum, average and maximum discharge
Hydrodynamic simulations have been performed to predict scour patterns downstream of irrigation weir energy dissipators. Scour characteristics consisting of depth, length and damage pattern are used as parameters to assess the safety of the hydraulic structure. These simulations have been executed using a hybrid approach: HEC-RAS, Scour Empirical Equation and Flow-3D based on three (3) discharge conditions: minimum, average and maximum. Calibration has been carried out to determine the Manning roughness coefficient in the HEC-RAS model by evaluating the difference between simulated water depth and observed water depth. Based on this calibration, the optimal Manning roughness coefficient was obtained at 0.0232.
The analysis results show that the depth of scour at maximum discharge almost reaches the depth of the energy dissipator foundation under the end sill at a depth of 1.5 meters. This indicates that the energy dissipator condition is unstable. Scour under the end sill can propagate upstream until it reaches the weir foundation due to flow turbulence. This is also proven by the results of field investigations which show that the maximum scour depth has reached more than 1.5 meters. Most of the floor of Energy Dissipator II of 4 meters length has collapsed. If this condition is not addressed, damage can increase to reach Energy Dissipator I. The final conclusion from this study is that the irrigation weir at the study site indicates a low level of safety as indicated by the depth of scouring under the end sill.
This research is supported by DIPA Pascasarjana Research Grant of Universitas Tadulako Number: 6805/UN28/KU/2023, May 23rd, 2023. We acknowledge the head of Pascasarjana for funding this research.
|
$g$ |
gravitational acceleration (m/s) |
|
$h$ |
normal depth (m) |
|
$f$ |
mud factor of Lecay |
|
$q$ |
discharge per unit width (m3/s2) |
|
w |
scour factor which depends on the diameter of the sediment grains |
|
$Q$ |
scour depth (m) |
|
FLOW-3D |
FLOW - Three Dimensional |
|
HEC |
Hydrologic Engineering Center |
|
HMS |
Hydrologic Modeling System |
|
RAS |
River Analisys System |
|
$D_{50}$ |
average diameter of sediment particle (m) |
|
$D_{90}$ |
diameter of sediment particle 90% (m) |
|
$D_{95}$ |
diameter of sediment particle 95% (m) |
|
$d_s$ |
scour depth (m) |
|
$Q_{\min }$ |
minimum discharge (m3/s) |
|
Qave |
average discharge (m3/s) |
|
$Q_{\max }$ |
maximum discharge (m3/s) |
|
Greek symbols |
|
|
$\Delta h$ |
difference in upstream and downstream energy levels (m) |
[1] Aminpour, Y., Farhoud, J. (2015). Investigation of local scour phenomenon downstream of stilling basins in the presence of stepped spillway. Journal of Hydraulics, 9(4): 25-38. https://doi.org/10.30482/jhyd.2014.11131
[2] Aminpour, Y., Farhoudi, J., Shayan, H.K., Roshan, R. (2018). Characteristics and time scale of local scour downstream stepped spillways. Scientia Iranica, 25(2): 532-542. https://doi.org/10.24200/sci.2017.4187
[3] Eghlidi, E., Barani, G.A., Qaderi, K. (2020). Laboratory investigation of stilling basin slope effect on bed scour at downstream of stepped spillway: Physical modeling of Javeh RCC Dam. Water Resources Managemen, 34: 87-100. https://doi.org/10.1007/s11269-019-02395-5
[4] Kumala, Y.E., Lestari, S., Zulfan, J. (2018). Study to minimize local scour downstream of the stilling basin. In Proceeding of the 21st IAHR-APD Congress, pp. 115-122.
[5] Mesbahi, M., Talebbeydokhti, N., Hosseini, S.A., Afzali, S.H. (2016). Gene-expression programming to predict the local scour depth at downstream of stilling basins. Transactions on Civil Engineering, 23(1): 102-113. https://doi.org/10.24200/sci.2016.2101
[6] Shayan, H.K., Farhoudi, J., Hamidifar, H. (2015). Estimation of maximum scour depth downstream of horizontal and adverse stilling basins using a semi-theoretical approach. International Journal of Civil Engineering, 13(1): 1-15. https://doi.org/10.22068/IJCE.13.1.1
[7] Taebi, H., Fathi-Moghadam, M. (2017). Scouring control of the eroded stilling basin: Case study, Namrood Dam. African Journal of Water Conservation and Sustainability, 1(2): 27-34.
[8] Zaffar, M.W., Hassan, I., Latif, U., Jahan, S., Ullah, Z. (2023). Numerical investigation of scour downstream of diversion barrage for different stilling basins at flood discharge. Sustainability, 15(14): 11032. https://doi.org/10.3390/su151411032
[9] Farhoudi, J., Hosseini, S.M., Sedghi-Asl, M. (2010). Application of neuro-fuzzy model to estimate the characteristics of local scour downstream of stilling basins. Journal of Hydroinformatics, 12(2): 201-211. https://doi.org/10.2166/hydro.2009.069
[10] Mehnifard, M., Dalfardi, S., Baghdadi, H., Seirfar, Z. (2015). Simulation of local scour caused by submerged horizontal jets with Flow-3D numerical model. Desert, 20(1): 47-55. https://doi.org/10.22059/jdesert.2015.54082
[11] El-Hazek, A.N, Abdel-Mageed, N.B., Ali, A.M., Mahgoub, E.S. (2021). Studying the best location and dimensions of stilling basin pool downstream hydraulic structures. Al-Azhar University Civil Engineering Research Magazine, 43(2): 94-108.
[12] Hojjati, S.H., Zarrati, A.R. (2021). Numerical study of scouring downstream of a stilling basin. Environmental Fluid Mechanics, 21: 465-482. https://doi.org/10.1007/s10652-021-09781-x
[13] Moussa, Y.A.M. (2013). Modeling of local scour depth downstream hydraulic structures in trapezoidal channel using GEP and ANNs. Ain Shams Engineering Journal, 4(4): 717-722. https://doi.org/10.1016/j.asej.2013.04.005
[14] Abdelhaleem, F.S.F. (2013). Effect of semi-circular baffle blocks on local scour downstream clear-overfall weirs. Ain Shams Engineering Journal, 4(4): 675-684. https://doi.org/10.1016/j.asej.2013.03.003
[15] Pagliar, S., Palermo, M., Carnacina, I. (2009). Scour and hydraulic jump downstream of block ramps in expanding stilling basins. Journal of Hydraulic Research, 47(4): 503-511. https://doi.org/10.1080/00221686.2009.9522026
[16] Elnikhely, E.A., Fathy, I. (2020). Prediction of scour downstream of triangular labyrinth weirs. Alexandria Engineering Journal, 59(2): 1037-1047. https://doi.org/10.1016/j.aej.2020.03.025
[17] Joolaeian, H., Nohani, E., (2015). Assessment of scour phenomena in the weirs' downstream and ways to retrofit and reduce scour. International Journal of Civil and Structural Engineering, 3(1): 141-145.
[18] Tunas, I.G., Herman, R., Arafat, Y. (2024). Performance quantification of flood hydrograph models based on catchment morphometry derived from 30 m SRTM DEM. In: Sabtu, N. (eds) Proceedings of AWAM International Conference on Civil Engineering 2022 - Volume 3. AICCE 2022. Lecture Notes in Civil Engineering, vol 386. Springer, Singapore. https://doi.org/10.1007/978-981-99-6026-2_37
[19] Haider, S., Masood, M.U., Rashid, M., Alshehri, F., Pande, C.B., Katipoğlu, O.M., Costache, R. (2023). Simulation of the potential impacts of projected climate and land use change on runoff under CMIP6 scenarios. Water, 15(19): 1-26. https://doi.org/10.3390/w15193421
[20] Tunas, I.G. (2019). The application of ITS-2 model for flood hydrograph simulation in large-size rainforest watershed. Indonesia. Journal of Ecological Engineering, 20(7): 112-125. https://doi.org/10.12911/22998993/109882