Hery Leo Sianturi*![]() | Adi Susilo
| Adi Susilo![]() | Juliany N. Mohamad
| Juliany N. Mohamad![]() | Redi K. Pingak
| Redi K. Pingak![]()
© 2023 IIETA. This article is published by IIETA and is licensed under the CC BY 4.0 license (http://creativecommons.org/licenses/by/4.0/).
OPEN ACCESS
Tolnaku, a village situated in the Kupang Regency, East Nusa Tenggara, Indonesia, is an area susceptible to landslides. An investigation into the likelihood of slope failures in this locality is imperative for landslide mitigation. This study endeavors to elucidate the subsurface conditions and evaluate the physical parameters and contributing factors that could precipitate landslides in this territory. The method of geoelectric resistivity, employing the Schlumberger configuration, has been applied to discern the varieties of rocks and cavities present in this area. The data amassed through the resistivity survey has been processed and analyzed to delineate the subsurface strata and assess their stability. The findings indicate that clay and limestone are the predominant materials in this area, and are deemed unstable. Furthermore, cavities and voids were identified in this area, amplifying the probability of landslide occurrences therein. Ultimately, the Safety Factor (SF) was ascertained to be less than 1, robustly suggesting that the slopes are perilous and vulnerable to landslides. To alleviate landslide risks in Tolnaku, Continuous Monitoring, Infrastructure Strengthening, Community Education, Coordination with Local and National Authorities, and the Development of Spatial Regulations are advocated for the future.
landslide, safety factor, resistivity
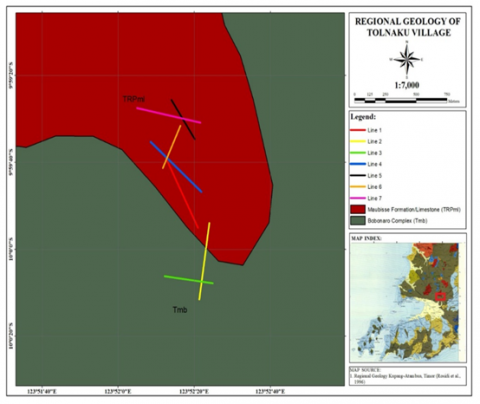
The instability of slopes in areas prone to landslides requires thorough investigation to understand the underlying geological and geophysical factors contributing to soil instability. One such area is the Tolnaku Village, situated in the Kupang Regency, East Nusa Tenggara, Indonesia, where significant landslides in 2009 highlighted the urgent need for a comprehensive landslide vulnerability analysis. The geology of this region showcases a complex stratigraphic composition, including the Bobonaro Complex (Tmb) and the Maubisse formation (TRPml), which potentially exacerbate the landslide risk.
The stratigraphy in Tolnaku exhibits an intriguing juxtaposition of scaly clay, sandstone, and limestone as components of the geological composition of the region, along with the presence of holes or cavities within the limestone that may form as a result of groundwater flow within the limestone. These holes or cavities can lead to the possibility of subsidence in the area, as explained by Park et al. [1]. Previous studies have investigated the presence of holes or cavities in the limestone region using resistivity methods [1-3].
Prior landslide analysis has been carried out utilizing geoelectric resistivity data. The research area consists of clay that can cause instability on the slopes and trigger soil deformations, such as landslides [4, 5]. The application of geoelectric resistivity data for slope stability analysis in landslide areas has been carried out by Di Maio and Piegari [6]. Additionally, several researchers have also utilized geoelectric data for landslide mitigation or landslide disaster [7, 8]. Research on soil peak acceleration on landslides in Tolnaku Village has been conducted by Sianturi et al. [9].
However, the relationship between the geological properties of the Bobonaro Complex (Tmb) and the Maubisse formation (TRPml) and landslide vulnerability has not yet been sufficiently explored. Recent advancements in geotechnical studies have revealed more information about clay behavior on slopes and soil deformations associated with landslides, yet, the utilization of geoelectric resistivity data for slope stability analysis and identification of landslide potential is still relatively new in Indonesia.
This study brings forth two novelties. Firstly, our innovative approach combines regional geological knowledge with geoelectric resistivity methodology, building upon the work of Di Maio and Piegari [6], to unravel the complex relationship between stratigraphic components and landslide risk in Tolnaku. Secondly, we tailor this methodology within the geological diversity of Indonesia and its potential natural disasters.
By synergizing geological understanding with modern technology, our research aims not only to identify the factors contributing to landslides in Tolnaku Village but also to significantly contribute to disaster risk mitigation in the future. Through this interdisciplinary approach, we anticipate deeper insights into landslide threats in Indonesia, inspiring more effective disaster mitigation strategies.
This study aims to investigate the factors affecting landslides in Tolnaku Village. To identify the types of rocks in this region, a resistivity method with Schlumberger configuration was applied. This is expected to provide useful information for landslide mitigation in the research area.
The geoelectric resistivity measurements were performed on seven trajectories in the research area. One trajectory is at the Bobonaro complex, one trajectory passes through the Bobonaro complex and Maubisse formation, and five trajectories are in the Maubisse formation (Figure 1). The Schlumberger configuration is used with a space of 20 meters. The Schlumberger configuration possesses characteristics that enable this survey to measure resistivity up to a deeper extent compared to some other configurations. This is carried out to obtain information about the deeper subsurface layers, which is crucial for a better understanding of the geological structures and hydrogeological properties beneath the surface.
The electrode spacing of 20 meters between the source electrode and the receiver electrode is a sufficiently large distance to measure the properties of rocks and groundwater at significant depths. If the electrode spacing is too small, the survey will only provide information about very shallow layers. With an electrode spacing of 20 meters, a fairly good lateral resolution is achieved, which can provide a better picture of the resistivity variations along the survey line.The rock layer patterns and slope of the slip field are determined based on the resistivity value using Res2Dinv software. Interpretation of resistivity values is made by referring to the data in Table 1.
Figure 1. The regional geological map of the study area
Slope stability analisys to evaluate landslide susceptibility in the study area was based on the safety factors (SF) on the trajectory.
The safety factors with saturated soil conditions was calculated using Eq. (1) [10], where c, φ, α, γ and γ' are cohesion, friction angle, slope angle, volume weight of the saturated soil, and the volume weight of the effective soil, respectively. The safety factor >1 are considered safe in this study.
SF=(c/(γ*H*〖cos〗^2 (α)*tgα)+(γ^'*tgφ)/(γ*tgα)) (1)
Description:
SF=safety factor
c=cohesion (KN/m2)
φ=friction angle (°)
α=slope angle (°)
γ=volume weight of soil saturated (kN/m3)
γ'=volume weight of soil effective (kN/m3)
H=thickness of the soil to be landslide (m)
Table 1. Resistance and conductivity of rock type [11]
|
Type of Rocks |
Resistance (Ωm) |
Conductivity (Siemen/m) |
|
|
Igneous and metamorphic rocks |
Granite |
5×10³-106 |
10-6-2×10⁻⁴ |
|
Basalt |
103-106 |
10-6-10-3 |
|
|
Slate |
6×10²-4×10⁷ |
2.5×10⁻⁸ -1.7×10⁻³ |
|
|
Marble |
102-2×10⁸ |
5×10⁻⁹-10-2 |
|
|
Sedimentary rock |
Sandstone |
8-4×10³ |
2.5×10⁻⁴-0.125 |
|
Shale |
20-2×10³ |
5×10⁻⁴-0.05 |
|
|
Limestone |
50-4×10³ |
2.5×10⁻⁴-0.02 |
|
|
Soils and waters |
Clay |
1-100 |
0.01-1 |
|
Alluvium |
10-800 |
1.25×10⁻³-0.1 |
|
|
Groundwater (fresh) |
10-100 |
0.01-1 |
|
|
Sea Water |
0.2 |
5 |
|
|
Chemical |
Iron |
9.074×10⁻⁸ |
1.102×10⁷ |
|
0.01M Potassium Chloride |
0.708 |
1.413 |
|
|
0.01M Sodium Chloride |
0.843 |
1.185 |
|
|
0.01M Acetic Acid |
6.13 |
0.163 |
|
|
Xylene |
6.998×10¹⁶ |
1.429×10⁻¹⁷ |
|
3.1 Underground structure based on resistivity map
Based on the resistivity values, it was found that regions with a resistivity value of 0-100 Ωm are clay, those of 100-4000 Ωm are limestone, and those of larger than 4000 Ωm contain a hole or cavity in limestone. Trajectories 1 and 2 relatively cut the height contours and tend to be in the direction of ground movement. Since only trajectories 1 and 2 have slip fields, the analysis of landslide susceptibility was only performed on these two trajectories. Res2DInv will generate images or 2D resistivity profiles reflecting the subsurface structures. The 2D resistivity profiles are used to determine the layering pattern of rocks and the slope of the slip plane. The rock layering will be reflected in the resistivity value variations at different depths. The slope of the slip plane can be identified as a sudden change in resistivity along the measurement trajectory.
Trajectory 1 is oriented from northwest to southeast, relatively cuts the contours of the altitude, and tends to be in the direction of ground movement. The inversion results (Figure 2) show that the resistivity values range from 1.38-149.08 Ωm, indicating that this trajectory is mainly clay.
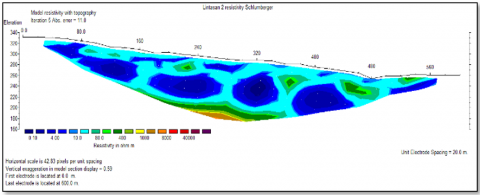
Trajectory 2 is oriented from northeast to southwest, cuts the altitude contours, and tends to be in the direction of ground movement. The inversion result (Figure 3) reveals that the resistivity range from 0.0 to 5636.2 Ωm. Similar to trajectory 1, clay is the majority material along this trajectory. Clay, with resistivity values between 0 and 100 Ωm, dominates to a height of 220 m with 80 m thickness. Meanwhile, limestone was found at altitudes of 220-190 m with resistivity values ranging from 100 to 4000 Ωm. Relatively high resistivity values (>4000 Ωm) observed in limestone at around 190 m were interpreted as a hole or hollow.
Figure 2. Inversion result of trajectory 1
Figure 3. Inversion result of trajectory 2
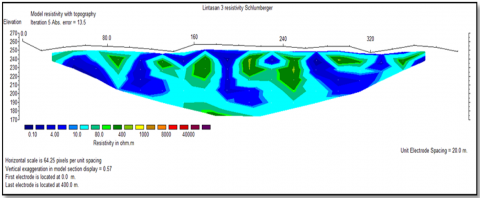
Figure 4. Result inversion of trajectory 3
Figure 5. Result inversion of trajectory 4
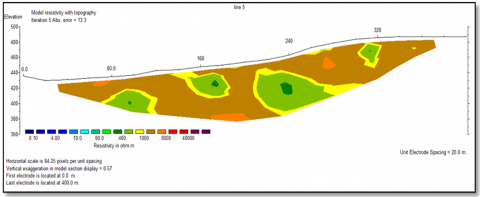
Figure 6. Inversion result of trajectory 5
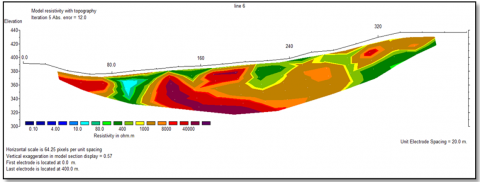
Figure 7. Inversion result of trajectory 6
Figure 8. Inversion result of trajectory 7
Trajectory 3 is oriented from west to east, is relatively parallel to the height contour, and tends to cut the direction of ground movement. The inversion results in trajectory 3 (Figure 4) show that the resistivity value in trajectory 3 ranges from 0.39 to 530.68 Ωm. Therefore, it can be interpreted that clay material is the majority of the material on this trajectory.
Trajectory 4 is oriented from northwest to southeast and relatively cuts the contours of altitude. The inversion results in trajectory 4, as presented in Figure 5, show that the resistivity values in trajectory 4 range from 17.1 to 298476.19 Ωm. It can be seen from the figure that the majority of the material on this trajectory is limestone with a resistivity value of 100 – 4000 Ωm. Similar to trajectories 1 and 2, there is a high resistivity value (larger than 4000 Ωm) observed in trajectory 4, interpreted as a hole or cavity found in limestone at 310 m. Holes and cavities are also found in limestone along trajectories 5, 6, and 7 as shown in Figures 6, 7, and 8, respectively.
The inversion results in trajectory 5 are shown in Figure 6, where resistivity values in the trajectory are between 322.29 and 7722.1 Ωm. On trajectory 5, it can be interpreted that the majority of the material on this trajectory is limestone with a resistivity value of 100-4000 Ωm.
Trajectory 6 is oriented from northeast to southwest and relatively cuts the contours of altitude. The inversion results (Figure 7) show that the resistivity value ranges from 16.79-358918.31 Ωm. The result can be interpreted to mean that most of the material on this trajectory is limestone with a resistivity value of 100-4000 Ωm.
Trajectory 7 is oriented from northwest to southeast and relatively cuts the contours of altitude and cuts off one of the rivers in the research area. The inversion results (Figure 8) show that the resistivity value ranges from 322.81-4647.4 Ωm. The majority of the material on this trajectory is limestone with a resistivity value of 100-4000 Ωm.
3.2 Safety factors
From the laboratory test, we obtained a cohesion value (c) of 18.73 KN/m2, a friction angle (φ) of 13°, a volume weight of soil saturated (γ) of 19.97 kN/m3 and a volume weight soil effective (γ') of 9.78 kN/m3. The slope angle, average soil thickness, and safety factor calculated using Eq. (1) are presented in Table 2.
Table 2. Slope angle, average soil thickness, and safety factor
|
Parameter |
Trajectory 1 |
Trajectory 2 |
|
Slope angle ($\alpha$) (°) |
7.7° |
9° |
|
Average soil thickness (H) |
100 m |
80 m |
|
Safety factor (SF) |
0.92 |
0.81 |
Table 2 reveals that the safety factors (SF) on slopes of trajectories 1 and 2 are 0.92 and 0.81, respectively, signifying that both slopes on these trajectories are categorized as unsafe, posing a potential threat of landslides. Observed from the perspective of rock slope inclinations, both slopes on trajectories 1 and 2 exhibit a tendency to ramp. The principal cause attributing to the unsafe status of these slopes is the presence of clay material, which induces instability. Corroborating discussions from the preceding section have highlighted that, according to resistivity values, five trajectories manifest holes or cavities within the limestone strata. These geological anomalies may lead to subsidence within the research area.
The Safety Factor (SF) emerges as an indispensable metric for gauging the stability of a slope or a region susceptible to landslides [12-15]. It quantifies the capability of geotechnical constituents of slope materials, such as soil or rock, to resist forces prone to trigger a landslide, juxtaposed against the actual forces prevailing on the slope. The analytic underpinning of the safety factor lies in a comprehensive examination of geotechnical capacities. A battery of laboratory assays and in-situ explorations provide an in-depth assessment of the slope materials' shear strength, delving into critical shear strength parameters including cohesion and the angle of internal friction. These parameters are central to understanding material behavior under various stress regimes.
Transitioning beyond mere comprehension, the essence of the safety factor encapsulates a rigorous scrutiny of forces with potential to initiate a landslide [16, 17]. Governed predominantly by gravitational pull, these forces could be intensified by additional external loads from construction, water saturation, or vegetation. The equilibrium, or lack thereof, between these forces and the geotechnical prowess of slope materials encapsulates the quintessence of the safety factor. At a more detailed level, the safety factor emerges as a numerical elucidation, derived from the ratio of the slope material's shear strength to the shear stress imposed upon it. A safety factor exceeding 1 denotes a relatively stable slope, whereas a value below 1 portrays a heightened propensity for instability, delineating an escalated risk of landslides.
Furthermore, the importance of the safety factor isn't confined to theoretical analyses. It finds tangible resonance in the realms of geotechnical engineering and environmental safety. Through rigorous analysis of the safety factor, engineering and environmental practices can cultivate robust mitigation strategies to augment slope stability or demarcate regions of high landslide susceptibility. This proactive methodology accentuates the pragmatic utility of the safety factor, spearheading initiatives to safeguard against landslide hazards and significantly contribute to ensuring environmental and human safety.
In conclusion, the safety factor operates as a linchpin in assessing the stability of slopes and landslide-prone regions. Its nuanced understanding lays a robust foundation for fostering a harmonious interface between human establishments and the often capricious natural terrains. Through the thorough exploration and application of the safety factor, strides towards ameliorating the detrimental impacts of landslides can be significantly realized, heralding a safer and more sustainable interaction with our natural milieu.
These findings harbor immediate and far-reaching implications for the future of the region. Firstly, there's a clear necessitation for thorough geotechnical analysis and continuous monitoring to better understand the evolving nature of these risks and the specific areas most threatened. Secondly, these findings should act as a catalyst for the development and implementation of robust landslide and subsidence mitigation strategies aimed at reducing risks and protecting both human and natural assets.
The dire need for proactive intervention cannot be overstated. Potential preventive measures could encompass soil stabilization techniques, drainage improvements to alleviate water saturation issues, and reinforcement of slopes using retaining structures. Also, establishing a monitoring system for early detection of soil movement could significantly mitigate risks. This system could incorporate state-of-the-art technologies like ground-penetrating radar and satellite imagery to provide real-time data on ground movements, enabling timely interventions before catastrophic events occur. Moreover, these findings suggest a crucial need for regional planning and policy formulation geared towards minimizing the potential impacts of landslides and subsidence. This could include zoning laws that restrict construction or other human activities in identified high-risk areas, coupled with rigorous building standards that demand construction practices designed to withstand such geotechnical challenges. Furthermore, community awareness and education programs about the inherent risks and the requisite preparedness measures are indispensable. Engaging local communities in disaster risk reduction activities and educating them on evacuation procedures during emergencies will foster a culture of readiness and resilience. Lastly, these insights beckon collaboration between governmental agencies, geotechnical engineers, environmentalists, and the local communities. A holistic approach, pooling expertise and resources from diverse stakeholders, will undoubtedly amplify the effectiveness of the mitigation strategies devised.
In conclusion, the revelation of this data signals a clarion call for a concerted effort aimed at not only understanding the intricate dynamics contributing to the geotechnical instability of the area but also actively engaging in multidimensional strategies to avert a possible geotechnical disaster. The multidisciplinary approach in addressing these concerns heralds a stride towards a safer and more sustainable future for the region.
[1] Park, M.K., Park, S., Yi, M.J., Kim, C., Son, J.S., Kim, J.H., Abraham, A.A. (2014). Application of electrical resistivity tomography (ERT) technique to detect underground cavities in a karst area of South Korea. Environmental Earth Sciences, 71: 2797-2806. https://doi.org/10.1007/s12665-013-2658-7
[2] Park, S., Kim, C., Son, J.S., Yi, M.J., Kim, J.H. (2009). Detection of cavities in a karst area by means of a 3D electrical resistivity technique. Exploration Geophysics, 40(1): 27-32. https://doi.org/10.1071/EG08114
[3] Torrese, P. (2020). Investigating karst aquifers: Using pseudo 3-D electrical resistivity tomography to identify major karst features. Journal of Hydrology, 580: 124257. https://doi.org/10.1016/j.jhydrol.2019.124257
[4] Vannucchi, P., Bettelli, G. (2010). Myths and recent progress regarding the Argille scagliose, Northern Apennines, Italy. International Geology Review, 52(10-12): 1106-1137. https://doi.org/10.1080/00206810903529620
[5] Martins, B.H., Suzuki, M., Yastika, P.E., Shimizu, N. (2020). Ground surface deformation detection in complex landslide area—Bobonaro, Timor-Leste—Using SBAS DinSAR, UAV photogrammetry, and field observations. Geosciences, 10(6): 245. https://doi.org/10.3390/geosciences10060245
[6] Di Maio, R., Piegari, E. (2012). A study of the stability analysis of pyroclastic covers based on electrical resistivity measurements. Journal of Geophysics and Engineering, 9(2): 191-200. https://doi.org/10.1088/1742-2132/9/2/191
[7] Ariyanto, S.V., Zuhri, M.D., Kasanova, R., Darmawan, I., Hari, N.H. (2019). Investigation of landslide zones with geoelectric methods for disaster mitigation in Pamekasan. IOP Conference Series: Earth and Environmental Science, 243(1): 012001. https://doi.org/10.1088/1755-1315/243/1/012001
[8] Susilo, A., Fitriah, F., Ayu Rachmawati, E.T., Suryo, E.A. (2020). Analysis of landslide area of Tulung subdistrict, Ponorogo, Indonesia in 2017 using resistivity method. Smart and Sustainable Built Environment, 9(4): 341-360. https://doi.org/10.1108/SASBE-06-2019-0082
[9] Sianturi, H.L., AdiSusilo, Sunaryo. (2019). The study of peak ground acceleration with Probabilistic Seismic Hazard Analysis (PSHA) method in the Tolnaku Landslide Area of Kupang Regency - NTT. Eco. Enc. & Cons, 25(3): 415-422.
[10] Hardiyatmo, H.C. (2006). Penanganan Tanah Longsor Dan Erosi. Yogyakarta: Gadjah Mada University Press.
[11] Loke, M.H. (2000). Electrical imaging surveys for environmental and engineering studies. A Practical Guide to 2-D and 3-D Surveys, 61.
[12] Telford, W.M., Geldart, L.P., Sheriff, R.E. (1990). Applied Geophysics. Cambridge University Press.
[13] Ismail, N.N., Ramli, A.B., Pami, S.N.M. (2021). Comparison of factor of safety using different method of analysis for slope stability. Journal of Applied Engineering Design and Simulation, 1(1): 52-58. https://doi.org/10.24191/jaeds.v1i1.28
[14] Dai, F., Lee, C.F., Ngai, Y.Y. (2002). Landslide risk assessment and management: An overview. Engineering Geology, 64(1): 65-87. https://doi.org/10.1016/S0013-7952(01)00093-X
[15] Yang, Y.Y. (2020). Grey relational analysis on influencing factors of highway slope safety in Ankang mountain area. International Journal of Safety and Security Engineering, 10(5): 721-726. https://doi.org/10.18280/ijsse.100518
[16] Cardarilli, M., Lombardi, M., Corazza, A. (2019). Landslide risk management through spatial analysis and stochastic prediction for territorial resilience evaluation. International Journal of Safety and Security Engineering, 9(2): 109-120. https://doi.org/10.2495/SAFE-V9-N2-109-120
[17] Gillen, H.F. (2017). Landslide mitigation using granular shear keys: Observations from a review of 38 case studies. Master Thesis, University of Alberta Libraries. https://doi.org/10.7939/R3D795Q97