Rossi Passarella*![]() | Muhammad Dion Iqbal
| Muhammad Dion Iqbal![]() | Muhammad Ali Buchari
| Muhammad Ali Buchari![]() | Harumi Veny
| Harumi Veny![]()
© 2023 IIETA. This article is published by IIETA and is licensed under the CC BY 4.0 license (http://creativecommons.org/licenses/by/4.0/).
OPEN ACCESS
Despite the Bureau of Transportation Statistics affirming the relative safety of air travel, with the lowest annual accident rate among various transportation modes, the importance of analyzing and mitigating aviation accidents remains paramount for the sustained safety and comfort of air travelers. This study leverages data from the Bureau of Aircraft Accident Archives (BAAA-acro) website, transformed into a dataset that encapsulates commercial airplane accident data spanning the period from 1918 to 2020. The dataset, comprising 110 observations across four variables, was subjected to K-means clustering to categorize the causes of airplane accidents. The optimal number of clusters for this analysis was determined using the Silhouette index. The investigation focused on two accident groups within the dataset. The first cluster, consisting of 106 observations, demonstrated a considerable degree of heterogeneity, indicative of a broad distribution and significant variation. The second cluster, comparatively smaller, comprised only four observations. The clustering exercise underscored that technical factors predominantly contribute to commercial airplane accidents. The findings of this study thus suggest that future efforts by aviation regulatory bodies to decrease aviation accident occurrences could benefit significantly from a concerted focus on these technical factors.
accident prevention, aviation safety, commercial airplane accidents, data analysis, K-means clustering, the bureau of aircraft accidents archives (BAAA-acro), technical factors
Airplanes, recognized for their efficiency and speed, stand as a predominant mode of transportation. Their ability to traverse vast distances in significantly truncated time frames compared to other modes of transportation underpins their importance. In addition to their role in public transportation, aircraft are instrumental in freight transport and military applications, such as combat aircraft [1].
Commercial air transportation is consistently lauded as the safest mode of transportation in comparison to others, as substantiated by annual statistics from the Bureau of Transportation Statistics. These statistics reveal that air transportation consistently records the lowest proportion of accidents compared to other modes of transportation such as buses, cars, motorcycles, trains, and ships [2]. Despite its relative safety, it is imperative that any incidents that do occur in air transportation are comprehensively investigated. The identification of causal factors and the location of accidents is crucial to inform strategies aimed at reducing future incidents, thereby enhancing the safety and comfort of air transportation users. However, notwithstanding the comparatively safe nature of air travel, data from the Bureau of Aircraft Accident Archives (BAAA) shows that between 1920 and 2021, 595 aircraft accidents occurred, resulting in a total of 5481 casualties, with the most devastating incident recorded on June 23, 1985, claiming 329 lives.
Statistical analyses reveal a significant reduction in aircraft accidents, with an 82% decrease observed between 1982 and 2019 [3]. This dramatic decline, from 3593 accidents in 1982 to a mere 640 in 2019, is often attributed to the regulatory measures introduced by the International Civil Aviation Organization (ICAO) in 1947 to standardize commercial aviation [4]. The decrease in accidents accounts for an annual rate of 70.9%. However, an intriguing paradox emerges from the data: Despite the decrease in commercial aircraft accidents, the number of fatalities appears to have increased. This trend may be attributed to shifts in the design of commercial airplanes that prioritize fuel efficiency and accommodate increased passenger capacity [4].
Scientific investigations have sought to analyze past aircraft accidents in a bid to understand the factors and locations contributing to these incidents, with the ultimate goal of reducing future occurrences [5]. However, the scope of these analyses has been regionally constrained [6], thus limiting their effectiveness as flight activities span not only within a single region, but also inter-regionally within a single country, inter-nationally, and even inter-continentally. A notable limitation is the exclusively Euro-centric focus of the study conducted by Valdés et al. [6], which analyzed flight data within European airspace across 10 countries, utilizing a data-driven methodology. In contrast to these regionally confined analyses, the present study adopts a more globally encompassing perspective, analyzing aviation accident data on a worldwide scale.
Historically, the analysis of aircraft accidents has predominantly relied on expertise and experiential knowledge. Such an approach, however, is susceptible to misinterpretation of analysis results [7]. Additionally, it has been observed that these traditional methods are incapable of extracting hidden knowledge from the utilized data [8]. Consequently, analysis results based on expert insights and experiences often neglect to categorize features with similar characteristics. This oversight results in a challenge to identify groups of accident locations or accident causes with shared attributes.
A plethora of factors contribute to aircraft accidents, as evidenced by the data. To facilitate seamless analysis and conclusion drawing, these causative factors need to be categorized into clusters. To address these issues, a novel method that can analyze aircraft accidents over an extensive area and group accidents with similar characteristics into a specified number of clusters is required. Furthermore, the accuracy level of this method must be superior to that of traditional methods. In response to these requirements, an artificial intelligence method, specifically the clustering method, is adopted. Contrary to supervised learning, clustering is an unsupervised method that eliminates the need for developing models for training and testing data [9]. This is primarily due to the aim of this method, which is to uncover hidden insights and knowledge within the used data. In this study, K-means clustering is utilized to analyze data by grouping data with similar characteristics into one cluster or group, and data with distinct features into different clusters or groups [10]. The K-means method iteratively clusters the data until all data in a specific cluster does not migrate to another [11]. Importantly, the data used by the clustering method in this study is global, not merely regional, expanding the scope and potential impact of the findings. Moreover, the use of the K-means method is anticipated to enhance the accuracy of the assessment, offering a marked improvement over traditional experience-based and intuition-driven methods.
The K-means algorithm was selected for this study due to its compelling advantages, including ease of implementation, assurance of convergence, and capability for warm-starting of centroids' positions in large datasets. The necessity for a clustering algorithm that is straightforward to implement and guarantees convergence underpinned the choice of the K-means algorithm. As the number of distances to the center decreases with each iteration, the algorithm's convergence is facilitated. This convergence is achieved as a result of the method employed for selecting the cluster center in each iteration, which is the mean of all nodes within the cluster. This process diminishes the number of distances in each iteration, culminating in the algorithm's convergence as each node is assigned to the nearest center.
The principal objective of this study is to unearth hidden information from the global dataset of commercial airplane accidents by employing a simple clustering approach, thereby shedding light on the data's clustering and its underlying rationale.
The structure of this study is delineated into four primary sections: The introduction briefly elucidates the study's objectives. The methodology section delineates the data sources and the approach implemented to achieve the study objectives, and outlines the technique deployed to validate the study's outcomes. The results section presents the analysis of the acquired data. Lastly, the conclusions section provides the findings and outcomes derived from the study.
The raw aircraft accident data has been obtained from the website BAAA-acro. In 1990, the BAAA website was launched in Geneva, Switzerland, with the primary goal of collecting, organizing, and storing information on aviation accidents worldwide from 1918 to the present. A secondary goal of this website is to promote aviation safety through knowledge, training, and information action plans, allowing the BAAA to participate in investigations, publish procedures, and send specific recommendations. The third goal is to educate the public and professionals about the risks associated with aircraft operations and train them in psychological preparedness for disasters such as accidents.
In this study, the BAAA database consisted of 592 rows with 14 column variables. The variables were date, operator, A/C_type, location, crew_on_board, crew_fatalities, PAX_on_board, PAX_fatalities, total_on_board, total_fatalities, flight_type, flight_phase, continent, and probable_causes. which were then simplified in accordance with the research objectives to only 4 variables, namely total_on_board, flight_type, total_fatalities, and probable_causes. Additionally, the variables for total_fatalities and total_on_board are of numeric data type. By employing either Spearman's or Pearson's correlation, the results showed correlation values of 0.75 and 0.97, respectively. These variables possess the highest degree of correlation in comparison to other numeric variables, which is why they were chosen.
2.1 K-means algorithm
K-means is an unsupervised learning clustering method used to analyze data by grouping data with similar characteristics into one cluster or group. Data with distinct characteristics are classified into different clusters or groups [10]. The K-means method requires the user to set three parameters: the number of K clusters to be used, cluster initialization, and system distance. The K-means method determines the number of clusters K to be formed and then finds the initial center of the cluster by averaging the data in each cluster. Subsequently, the distance between cluster members and each centroid is calculated. If all data in a particular cluster is not moved to another cluster, then the iteration in K-means will end [11].
In general, the K-means algorithm begins by determining an arbitrary centroid. It calculates the distance of the data points from the centroid, assigns the data points to the nearest centroid, and updates the centroid based on the new cluster assignment. The algorithmic process is described in detail as follows [12].
|
Algorithm 1 K-means clustering |
|
|
1: |
Initialize Cluster Centers |
|
2: |
for each iteration l do |
|
3: |
Compute $r_{n k}$: |
|
4: |
for each data point $x_n$ do |
|
5: |
Assign each data point to a cluster: |
|
6: |
for each cluster k do |
|
7: |
if $\mathrm{k}=\operatorname{argmin}\left\|x_n-\mu_k^{l-1}\right\|$ then |
|
8: |
$r_{n k}=1$ |
|
9: |
else |
|
10: |
$r_{n k}=0$ |
|
11: |
end if |
|
12: |
end for |
|
13: |
end for |
|
14: |
for each cluster k do |
|
15: |
Update cluster centers as the mean for each cluster: |
|
16: |
$\mu_k^l=\frac{\sum r_{n k} x_n}{\sum r_{n k}}$ |
|
17: |
end for |
|
18: |
end for |
2.2 Cluster testing
The goal of the clustering process is to determine the number of clusters. The primary goal of cluster validation is to ensure that the clusters are high quality. Cluster validation is one of the most important issues and requirements for successful clustering implementation, as it evaluates the quality of clustering findings. Two metrics are presented to evaluate and select the best clustering algorithm [13].
After testing the data for clustering, the Silhouette index and elbow methods can be used to determine how accurate they are. Sum Square Error (SSE) is a statistical method for calculating the total difference between the achieved and actual values [10].
$S S E=\sum_{i=1}^n(d)^2$ (1)
In Eq. (1), “d” represents the distance between the data and the cluster center. The SSE formula calculates the difference between the obtained data and the previous prediction model. SSE is frequently used as a research reference when deciding on the best cluster.
In this study, the elbow method is used to determine the optimum amount of K, where the optimum location of the K value is at the "elbow" [14]. The elbow method is a popular approach to ascertain the best number of clusters. It computes the within-cluster sum of squared errors (WSS) for various K values and selects the K at which WSS initially decreases. The WSS versus. K plot outlines the process in detail, where each point's squared error equates to: Its distance from its predicted cluster center. Secondly, the WSS score is calculated as the sum of squared errors for all points. Thirdly, any distance metric, such as the Euclidean Distance or the Manhattan Distance, can be utilized.
In addition to the elbow method, the second method for determining the K value is using the Silhouette index [5]. Silhouette analysis is a means of interpreting and validating the consistency of data clusters. The silhouette value measures a data point's similarity to its own cluster (its cohesion) relative to other clusters (its separation). The process of calculating the Silhouette index involves determining the average distance between a data point and all other data points in the nearest cluster, which is referred to as its nearest cluster distance. Next, compute the silhouette score for each data point by dividing the difference between its nearest cluster distance and its intra-cluster distance by the maximum value of this difference.
3.1 Data preprocessing
Preparing raw data for use is an integral part of the preprocessing stage because the quality of the input data greatly influences the quality of the output data produced [10]. Several stages are conducted at this point, including data cleaning, integration, and reduction. Subsequently, the data cleaning process is run on the eight existing variables, and the ones to be used are chosen. The data with null or empty values are cleaned after determining the variables used.
The next stage is data integration, which is performed if there is more than one data source at this stage to make it easier to process the data in one place using the .csv extension.
Furthermore, at this stage, data reduction will include a StandardScaler process to standardize the value of the total passenger and total victim columns, and a PCA process will be implemented to reduce the data dimensions of the total passenger and total victim variable columns. Finally, flight types other than the previously described commercial flight were deleted.
3.1.1 Data cleaning
The first step is to eliminate variables that are no longer in use or will not be required in the future. There are 14 variables in the initial data, but only the total on board, flight type, fatalities, and probable cause variables are used.
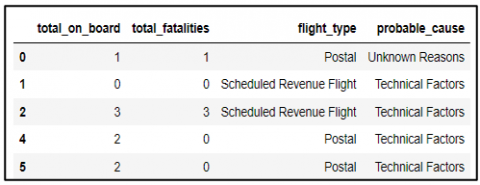
The second process deleted missing data values in the variable columns used, namely total on board, flight type, total fatalities, and probable cause, and then filtered from 592 based on flight type, where only commercial flights are used, and other types of flights are not. The total data is 110, as identified after filtering by flight type. Finally, the data is double-checked to identify null values. The cleaned data frame data is then displayed again, as shown in Figure 1.
Figure 1. After-cleaning data frame display example
3.1.2 Data reduction
Principal Component Analysis (PCA) is the technique used for this data reduction, which predicts data with a high dimension to a low dimension, intending to reduce the data dimensions.
The StandardScaler process is used to standardize the value in the variable column of the total passengers on the aircraft and the total number of victims in the first stage of this data reduction. Furthermore, non-commercial flight types are deleted, so only commercial flight types are used in this study.
3.2 Test number of cluster
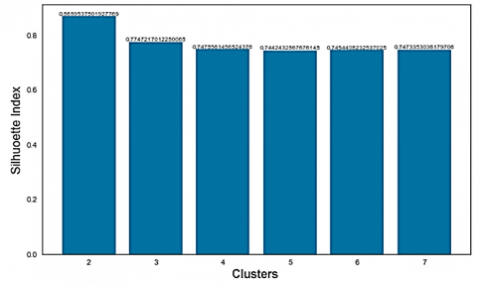
We must determine the optimal number of clusters based on the used data using the elbow method (Figure 2) and the Silhouette index method before analyzing the distribution results of each cluster. According to the results of the validation test of the number of clusters using the elbow, the “elbow” gives the representative number of K as 2. To validate this number of K, the Silhouette index method with a value range from 2 to 10, as shown in Figure 3, the closer the value is to 1, the better the data grouping will be. Therefore, cluster 2 has the optimal number of clusters for use in this study, with a value of 0.86, which is closest to the value of 1 compared to the value of other clusters.
3.3 K-means clustering
After cleaning and reducing the data, testing the number of clusters, and beginning the clustering process, the K-means cluster was used in this study, as explained in the previous chapter. The K-means method determines the number of clusters to be formed and then finds the initial center of the cluster by averaging the data in each cluster. The distance between cluster members and each centroid is then calculated. When all data in a particular cluster does not move to another cluster, iteration in K-means ends [8].
Figure 2. Test the number of clusters using the elbow method
Figure 3. Test the number of clusters using the Silhouette index
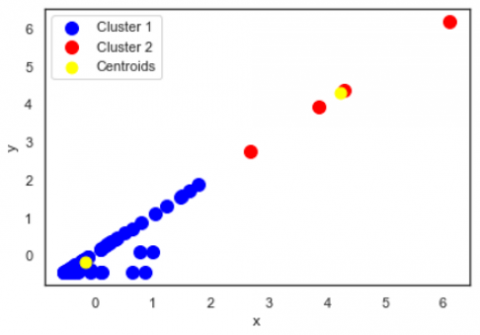
Figure 4. Visualization of K-means clusters
Table 1. The number of data points in each K-means cluster
|
Cluster |
Total Data |
|
1 |
106 |
|
2 |
4 |
Figure 4 shows two clusters-denoted by blue circles for data in cluster 1, red circles for data distribution in cluster 2, and yellow circles for the centroid in each cluster. Table 1 shows the amount of data in each cluster.
3.3.1 Data analysis on cluster 1
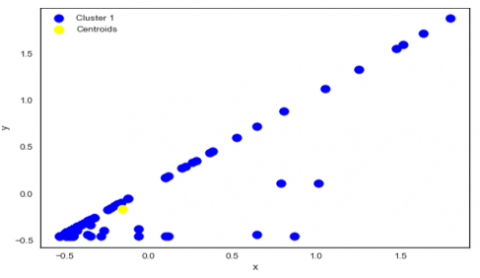
The results of the data distribution form points that are scattered to form a pattern in Figure 5, which depicts a visualization of the distribution of data in cluster 1. The blue dot in the image represents the data distribution in this cluster 1, and the yellow dot represents the centroid. The centroid is the cluster’s initial center point, determined by the randomly chosen K value. Table 2 details the number of each cause in cluster 1. With 39 data points, it is clear that technical factors are the most common causes.
Figure 5. Data visualization of cluster 1
Table 2. Number of each cause of accident in cluster 1
|
Probable Cause |
Total Data |
|
Technical factors |
39 |
|
Unknown reason |
19 |
|
Disappeared without a trace |
18 |
|
Poor weather |
12 |
|
Conflict factors |
10 |
|
Human factors |
7 |
|
Crashing the other objects |
1 |
3.3.2 Data analysis on cluster 2
The results of the data distribution form points that are scattered to form a pattern in Figure 6, which depicts a visualization of the distribution of data in cluster 2. The red dot in the image represents the data distribution in this cluster 2, and the yellow dot represents the centroid. The centroid is the cluster’s initial center point, determined by the randomly chosen K value. Table 3 shows that there are only four causal factors in cluster 2.
Figure 6. Data visualization of cluster 2
Table 3. Number of each cause of accident in cluster 2
|
Probable Cause |
Total Data |
|
Technical factors |
1 |
|
Human factors |
1 |
|
Disappeared without a trace |
1 |
|
Crashing the other objects |
1 |
As an overview, the data grouping obtained the following information: In cluster 1, it was found that in 1985, the Air India Boeing 747-200 aircraft crashed on the European continent, precisely in the Atlantic Ocean, by crashing into an object. This flight carried a total onboard of 329 passengers with total fatalities of 329 passengers, while in cluster 2 data found in 1940, a Handley Page H.P.42 type aircraft operated by Imperial Airways crashed the other object in Asia precisely in the Gulf of Oman, carrying a total onboard of 8 passengers and as many as 8 passengers with total fatalities. Based on the overview of the data details of these two clusters, it can be seen that a large number of total fatalities and totals on board tend to be in cluster 1, while the opposite will be included in cluster 2.
While in the distribution of clustering results data points when viewed from the accident location variables, for cluster 1, most occurred in the Mediterranean Sea, followed by the Atlantic Ocean. As for cluster 2, the location of the incident caused as many as two events in the Pacific Ocean, while the Atlantic Ocean and the Gulf of Oman each had one event. The visualization of the data distribution for each cluster is depicted in Figure 7.
Figure 7. The visualization of the data distribution for each
3.4 Visualization of the severity of an aircraft crash based on causal factors
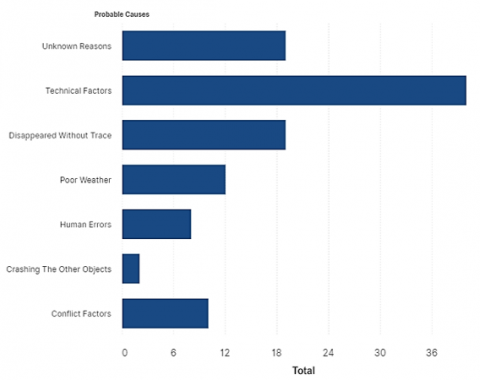
The data used in this study range from 1918 to 2020 and includes 593 accidents. However, after preprocessing the data with commercial aircraft flight data variables, only 110 data points with different accident causes have been identified. Figure 8 shows the data visualization results of the accident cause variable or probable cause.
According to Figure 8 of the visualization results of the distribution of the number of causes of accidents, the factor caused by technical factors is 40 accidents, followed by unknown causes, and each of these factors is lost without a trace 19 times.
Table 4 shows the data distribution results based on severity. cluster 1 has each severity level, and this cluster is formed with data with the highest number of accident victims. On the other hand, cluster 2 has the least number of victims, and the severity of cluster 2 is only at the severe level. No accidents have been identified for moderate and mild severity.
According to Figure 8, the dominant factor in this data is technical factors, which total 40 in the two clusters of technical factors, with details of 15 entering the severe category, 6 entering the moderate category, and 18 entering the mild category for cluster 1 and cluster 2 technical factors.
Figure 9 shows the visualization results of the causes of accidents based on severity. cluster 1 dominates the distribution of these two variables. On the other hand, cluster 2 is very small and has a very large data difference from cluster 1, implying that the distribution of each cluster is based on the number of victims.
Figure 8. Visualization of the distribution of the number of causes of accidents
Table 4. The results of cluster 1 and cluster 2 based on accident severity and causal factors
|
Probable Cause |
Level of Severity |
|||||
|
Cluster 1 |
Cluster 2 |
|||||
|
Severity |
Moderate |
Mild |
Severity |
Moderate |
Mild |
|
|
Unknown reason |
16 |
1 |
2 |
0 |
0 |
0 |
|
Technical factors |
15 |
6 |
18 |
1 |
0 |
0 |
|
Disappeared without a trace |
18 |
0 |
0 |
1 |
0 |
0 |
|
Poor weather |
11 |
0 |
1 |
0 |
0 |
0 |
|
Human errors |
3 |
0 |
4 |
1 |
0 |
0 |
|
Conflict factors |
10 |
0 |
0 |
0 |
0 |
0 |
|
Crashing the other objects |
1 |
0 |
0 |
1 |
0 |
0 |
Figure 9. Distribution of point cluster data by severity category with causal factors
Based on the results of research and discussion, it is found that the most clustering of data occurs in cluster 1, and one of the most common causes is technical factor problems; this is also reported by Passarella and Nurmaini [2], Herkert et al. [15], apart from human error. This shows that the clustering data has the same conclusion.
To note, the current findings reflect a fundamental analysis utilizing the widely adopted K-means clustering method. However, alternative unsupervised clustering techniques, such as hierarchical clustering or density-based clustering, should be explored to attain optimal insights from the data. This topic warrants discussion as K-means suffers from drawbacks including the assumption that clusters are spherical with similar variance, making it unviable for complex or irregular clusters. Furthermore, it is sensitive to outliers, skewed features, and correlated variables that necessitate data preprocessing or normalization.
The K-means clustering method was used in this study, and the number of clusters was determined using the Silhouette index method and the distortion score elbow method. The Silhouette index using two clusters yielded an optimal value of 0.86, and the distortion score elbow method yielded an optimal value of k=2 with WSS score of 68.081. The data distribution in cluster 1 obtained 106. This cluster contains heterogeneous data, which means that the data varies greatly and has a wide distribution.
Upon further analysis, it was discovered that cluster 1 experienced more severe accidents, primarily due to technical factors, with a total of 39 data points. In contrast, cluster 2 had only 4 data points and exhibited less severe accidents based on accident severity. Based on the location of accident variables for cluster 1, the analysis revealed that the majority of accidents occurred in the Mediterranean Sea with the Atlantic Ocean following behind. For cluster 2, the location of the accident caused two events in the Pacific Ocean and one event each in the Atlantic Ocean and the Gulf of Oman.
The results of this research on clustering commercial aircraft accident history data using the K-means machine learning algorithm can be useful information for commercial aviation observers, airlines, and aviation authorities, so that the results of this analysis can prevent severe accidents by addressing technical issues in flight operations.
For further investigation, it is imperative to incorporate weather data and pilot records into the analysis to enhance the cluster model and obtain more profound cluster insights. Additionally, the implementation of the DBSCAN algorithm can be considered to detect clusters with arbitrary shapes.
This work was supported by members of the Transportation Research-Aircraft Accident Cluster, Faculty of Computer Science. Sriwijaya University.
[1] Peysakhovich, V., Lefrançois, O., Dehais, F., Causse, M. (2018). The neuroergonomics of aircraft cockpits: The four stages of eye-tracking integration to enhance flight safety. Safety, 4(1): 8. https://doi.org/10.3390/safety4010008
[2] Passarella, R., Nurmaini, S. (2022). Data analysis investigation: Papua is the most unsafe province in Indonesia for aviation: An exploratory data analysis study from KNKT-Database Accidents and Incidents (1988-2021). Journal of Engineering Science and Technology Review, 15(3): 158-164. https://doi.org/10.25103/jestr.153.17
[3] Panish, Shea, Boyle, Ravipudi LLP. Aviation and plane crash statistics. https://www.psbr.law/aviation_accident_statistics.html, accessed on Sep. 28, 2023.
[4] Passarella, R., Veny, H., Fachrurrozi, M., Samsuryadi, S., Vindriani, M. (2023). Evaluating the influence of the international civil aviation organization on aircraft accident rates and fatalities: A seven-decade historical data analysis. Acadlore Transactions on Applied Mathematics and Statistics, 1(1): 33-43. https://doi.org/10.56578/atams010104
[5] Sikora, I., Hari, B.L., Hanusch, M. (2020). Human factors approaches and models in LOC-I accident analysis and prevention: Flight crew resource management techniques as a risk mitigation tool. International Journal of Safety and Security Engineering, 10(3): 301-310. https://doi.org/10.18280/ijsse.100301
[6] Valdés, R.M.A., Comendador, V.F.G., Castán, J.A.P., Sanz, A.R., Sanz, L.P., Ayra, E.S., Nieto, F.J.S. (2019). Development of safety performance functions (SPFs) to analyse and predict aircraft loss of separation in accordance with the characteristics of the airspace. Reliability Engineering & System Safety, 186: 143-161. https://doi.org/10.1016/j.ress.2019.02.007
[7] Illankoon, P., Tretten, P., Kumar, U. (2019). A prospective study of maintenance deviations using HFACS-ME. International Journal of Industrial Ergonomics, 74: 102852. https://doi.org/10.1016/j.ergon.2019.102852
[8] Oehling, J., Barry, D.J. (2019). Using machine learning methods in airline flight data monitoring to generate new operational safety knowledge from existing data. Safety Science, 114: 89-104. https://doi.org/10.1016/j.ssci.2018.12.018
[9] Peng, C.C., Tsai, C.J., Chang, T.Y., Yeh, J.Y., Hua, P.W. (2020). A new approach to generate diversified clusters for small data sets. Applied Soft Computing, 95: 106564. https://doi.org/10.1016/j.asoc.2020.106564
[10] Sunardi, Kusuma, R.S. (2023). Digital evidence security system design using blockchain technology. International Journal of Safety and Security Engineering, 13(1): 159-165. https://doi.org/10.18280/ijsse.130118
[11] Brusco, M.J., Shireman, E., Steinley, D. (2017). A comparison of latent class, K-means, and K-median methods for clustering dichotomous data. Psychological Methods, 22(3): 563-580. https://doi.org/10.1037/met0000095
[12] Unzueta, D. (2023). Unsupervised Learning: K-means clustering - K-means clustering intuitively explained. https://towardsdatascience.com/unsupervised-learning-K-means-clustering-6fd72393573c, accessed on Sept. 28, 2023.
[13] Rasid Mamat, A., Susilawati Mohamed, F., Afendee Mohamed, M., Mohd Rawi, N., Isa Awang, M. (2018). Silhouette index for determining optimal K-means clustering on images in different color models. International Journal of Engineering & Technology, 7(2.14): 105. https://doi.org/10.14419/ijet.v7i2.14.11464
[14] Barus, O.P., Nathasya, C., Pangaribuan, J.J. (2023). The implementation of RFM analysis to customer profiling using K-means clustering. Mathematical Modelling of Engineering Problems, 10(1): 298-303. https://doi.org/10.18280/mmep.100135
[15] Herkert, J., Borenstein, J., Miller, K. (2020). The Boeing 737 MAX: Lessons for engineering ethics. Science and Engineering Ethics, 26: 2957-2974. https://doi.org/10.1007/s11948-020-00252-y