Muhammad Arif*![]() | Jasman Saripuddin Hasibuan
| Jasman Saripuddin Hasibuan![]() | Nadia Ika Purnama
| Nadia Ika Purnama![]() | Jufrizen
| Jufrizen![]()
© 2024 The authors. This article is published by IIETA and is licensed under the CC BY 4.0 license (http://creativecommons.org/licenses/by/4.0/).
OPEN ACCESS
This study aims to test the influence of destination image on tourist loyalty satisfaction in Lake Toba, Indonesia. This study uses an explanatory research approach. The population of this study is all Domestic Tourists visiting the Lake Toba Region. Determination of the number of samples using the formula and obtained as many as 96 respondents. Primary data collection is done by questionnaire (questionnaire). The data analysis method used is Partial Least Square (PLS) based Structural Equation Modelling (SEM). The study results show that cognitive, unique, and affective images positively and significantly affect on tourist satisfaction in tourist destinations in the Lake Toba Region. Cognitive Image, Unique Image, and Tourist Satisfaction positively and significantly affect Tourist Loyalty in Lake Toba Tourism Destinations. However, the Affective Image only significantly affects Tourist Loyalty in Lake Toba Tourism Destinations. Cognitive Image and Unique Image have a positive and significant effect on Tourist Loyalty Through Tourist Satisfaction at Tourist Destinations in Lake Toba Tourism Destinations, and Affective Image has no significant effect on Tourist Loyalty Through Tourist Satisfaction at Tourist Destinations in the Lake Toba Tourism Destinations. Lake Toba Area managers must carry out various relevant programs and maintain good relations with stakeholders in maintaining tourism destinations.
destination image, satisfaction, loyalty, SEM-PLS, Indonesia
Tourism is one of Indonesia's largest sources of foreign exchange. Tourism plays a significant role in boosting the economy and the income of individuals. The tourism potential in Indonesia needs to be appropriately maximized. This is due to the need for more attention from the local and central government in managing existing natural and human resources [1].
The role of tourist destinations is to improve people's welfare. Tourism has a positive impact on the local community's economy, leading to people's income, employment opportunities, increased distribution of benefits and profits, ownership and control over the community's economy, and impact on regional development [2]. The effect of tourism development, namely employment, creating business opportunities, encouraging infrastructure development, increasing tax revenues, improving the community's economy, and increasing investment in the tourism sector [3].
The destination image of Lake Toba as the largest lake in Southeast Asia is an important point in the decision of tourists to visit. With a good and well-known destination image, it makes it easier for tourists to plan their vacations [4]. Image is an idea, impression, feeling, and belief in a tourist destination [5]. Destination image is a place impression or area perception [6], while according to a previous study [7], image is an indicator value of the potential of an area.
A good destination image will increase tourist visits because the image influences visiting decisions and intentions to make repeat visits [6]. Factors contributing to image formation include improved quality and reliability, trustworthiness, usability and benefits, service, risk perception, and pricing [8-13]. The dimensions used to measure destination image are friendly behavior, security posts, tourist activities, tourist information, tourist maps, cleanliness, tourist facilities, restaurants, lodging, art activities, and souvenirs [14-16]. The dimensions of image measurement are attributes, personality, and benefits. The dimensions used to measure the image, according to a previous study [17], are symbols, logos, names, citizens, and slogans, while according to a previous study [18], measuring image seen from popularity, good word of mouth, and commodities offered. Destination imagery can increase the number of tourist visits because it makes it easier to search for information on places to visit [5]. Indicators of destination image formation are divided into cognitive (belief), affective (feeling), and conative. Cognitive image refers to the quality and friendliness of residents, cultural attractions, climate and weather, and price of services. In contrast, the affective image refers to one's imagination, hope, and emotion about tourist attractions. In contrast, conative is a combination of cognitive and affective decision-making [19]. The same is explained [20, 21] that cognitive, affective, and conative components form an image.
Tourism destinations are widely acknowledged to belong in the consumer-generated set from which the final decision is made [22-24]. On the other hand, consumers frequently offer a variety of locations with similar characteristics, such as great accommodations, stunning scenic views, and friendly people. Consequently, more effort is required for the objective to be included in the elicited set; alternatively, the goals must be distinct and distinct for the final selection to be chosen. From this perspective, destination branding is essential for destinations to be recognized and differentiated from alternatives in the consciousness of their target market. Although destination image is not explicitly examined in the context of branding, it must be considered a pre-existing concept following destination branding [25]. In contrast, the crux of destination branding is creating a positive destination image that defines and differentiates the location using a consistent blend of brand materials [26]. The brand destination image can be defined as "a perception of a place based on the memories of tourists" [27].
Branding is now widely regarded as a significant tool for firms to gain competitiveness through strengthening markets because it provides value for producers and consumers [28]. In order to affect the destination brand, the location's distinctive image must be perceived as a significant brand association. Creating a destination's image is crucial for survival in a global market where goals compete fiercely [29]. Destination branding selects a combination of components to identify and differentiate a location by constructing a positive image. Destination branding promises a memorable experience about a location [30]. Tourism is an integral aspect that cannot be ignored when discussing a location. As one of the biggest drivers of the economy, tourism generates a large amount of state revenue. By seeing the importance of destination branding, countries compete to show their unique character in the eyes of the world [31]. The competition for destination branding is increasing, especially in Indonesian tourism, which still needs to be improved in other countries, particularly neighboring countries like Singapore, Malaysia, and Thailand.
This study aims to create and evaluate a theoretical destination branding model based on destination image studies and standard branding principles and practices. The current study, in particular, investigates the relationship between brand associations (images of cognitive, unique, and cognitive components), brand image (total image of a destination), and future visitor behavior. For this purpose, an empirical study was conducted at Lake Toba, Indonesia, with the aim of successfully brand the destination and counter its negative image.
The location of Lake Toba in North Sumatra is the most valuable national assets and significant tourist destination, alongside Bali and Lombok, that brings national pride. Lake Toba's designation as a tourist destination is predicated on the belief that it offers a breathtaking natural vista [32]. The Lake Toba Region has several tourist destinations, including Parapat, Simarjarunjung, Tanjung Camel, Haranggaol, and others. One of the most famous and popular areas is Parapat City, which is also the capital of Girsang Sipangan Bolon District. Parapat is the primary entrance to the island of Samosir and is often referred to as Parapat Tourism City. The condition of the Covid-19 pandemic precipitated a steep decline in visitor visits in 2020. Based on information from the Central Statistics Agency for Samosir Regency, foreign tourist visits in June 2020 were around 99 visits or a decrease of 99.53 percent from 21,143 visits in June 2019.
Local governments and Micro, Small, and Medium Enterprises (MSMEs) are attempting to thrive so visitors can visit Lake Toba while adhering to health guidelines. The tourism business is expected to grow, one way being to improve the image of Lake Toba as a tourist destination in the eyes of the general public, both domestic and foreign. Enhancing the image of the Lake Toba destination is one approach to promote local and foreign visitor visitation. The tourism industry is expected to rise, one of which is by increasing the image of the tourist destination of Lake Toba in the eyes of the public, both domestic and foreign. One way to increase domestic and foreign tourist visits is by enhancing the image of the Lake Toba destination. The destination's image is one of the tourist’s most essential deciding factors. This research seeks to quantify the impact of images on tourist visit decisions in Samosir Regency. Improving the image of the Lake Toba destination is one strategy to promote local and foreign visitor visitation. Tourists believe destination image is one of the most essential elements when selecting a destination. This research aims to determine the impact of the image (Image) on tourist visit decisions in Samosir Regency.
One of the efforts made to create uniqueness in the Lake Toba Region is, of course, by fulfilling the concept of the destination branding model, which has three dimensions: cognitive image, unique image, and affective image [29, 33]. Several research results show that destination image is a total impression of cognitive and affective evaluation [34]. It is suggested that brand association should include both cognitive image and affective image components [25]. These two components are indicators that influence the destination image [33, 34].
2.1 Destination branding
Destination branding communicates a destination's distinct identity by distinguishing it from its competitors [33]. Based on this definition, a destination needs a brand as a medium to communicate to consumers about the product's type or purpose, which differentiates the product from other products. As with general brand recognition, destination brands serve two essential functions: identification and differentiation. The definition of "identification" in brand literature is "explaining the source of the product to consumers." While a product generally refers to a physical offering that can be readily altered, a place as a product refers to a large entity that contains various material and non-material elements to represent it [35]. For instance, a location includes tangible features, such as historical sites and beaches, and ineffable features, such as culture, customs, and history [33]. Destination branding is a strategy for marketing an area's potential [7]. There are five (5) stages to carry out destination branding in changing the image of a region, namely: 1) market investigation, analysis, and strategic recommendations; 2) brand identity development; 3) brand launch and introduction: communicating the vision, 4) brand implementation, and 5) monitoring, evaluation, and review [36].
2.2 Brand identity and brand image
According to a previous study, brand identity and image are critical to successful destination branding. There is a significant distinction between the sender and recipient perspective [37]. Brand identity is a distinct collection of brand associations developed by strategists [5]. The brand identity is a distinct brand association that conveys promise to customers [38]. On the other hand, the brand image refers to how consumers perceive a brand, which is influenced by its connections embedded memory. The sender (the destination marketer) portrays the destination brand identity for destination brands through all of the characteristics and activities that set it apart from competing locations.
In the meantime, recipients (consumers) construct and store in their minds a mental image of the destination [35]. It is important to note that the destination brand identity and brand image are reciprocal. Brand image plays a crucial role in establishing brand identity [39], and reflects brand identity [35]. People form mental images of destinations depending on the brand identity marketers convey. Then, based on their knowledge of the brand image of consumers at a specific destination, objective marketers build and enhance brand identity. As a result, the destination image is critical in developing a favorable and recognizable brand character.
2.3 Brand association
Brand associations are everything that directly or indirectly appears and is related to the consumer's memory of a brand [38]. Regarding destination branding, attitude can be a brand association to build a destination image [39]. Destination image is also regarded as an attitudinal construct composed of cognitive and emotive assessments [40]. This assessment supports the idea that destination branding's cognitive and affective image components should be included [38]. Nonetheless, it is asserted that the cognitive and affective image components are hierarchically linked to form a destination image [39]. However, it is still possible that each cognitive and emotional brand image component will contribute uniquely to formulating the overall image. To investigate the effects of cognitive and affective components on consumer’s attitude structure and future behaviors, cognitive and affective components must be treated independently [41]. This study concludes that positive cognitive, unique, and brand associations will positively affect a destination's overall image (e.g., branding). Multiple studies examined the cognitive and affective image components of brand associations that influence brand image (i.e., destination image). The use of a unique image is suggested to establish a prominent brand image. Unlike ordinary images, a distinctive image can better convey the essence of the destination [42]. Uniqueness is critical because it is influenced by the similar differences between goals in the target consumer's mind [39]. Similarly, destination branding must promote the location's distinct image for consumers to distinguish it from competing places. In reality, destination branding is partly described as communicating a fulfilling travel experience distinctively associated with a specific destination [38].
2.4 Tourist behavior
The image of a destination directly impacts the intention to return and the inclination to recommend it to others. Meanwhile, a destination's quality and satisfaction indirectly affect its intention to return and willingness to recommend it to others [43]. The image of a destination has a direct impact on trip quality and behavioral intention. Furthermore, destination image influences behavioral intention indirectly through trip quality, perceived value, and satisfaction [44]. The cognitive destination image has a direct effect on tourist behavioral intention.
In contrast, the functional image is associated only with the intention to return, the psychological image is associated only with the intention to recommend, and the mixed image is not related to the two behavioral intentions [27]. Other studies have discovered a robust indirect relationship between destination image and intention to visit, moderated by service quality and tourist satisfaction [14], by testing a theoretical model to see if the destination image directly or indirectly affects loyalty. According to the research, the destination image is associated with loyalty indirectly through satisfaction [12].
2.5 The relationship destination image with satisfaction and loyalty
Creating a good image of a tourist destination will positively contribute to the development and progress of a tourist attraction. According to a previous study [45], ways that can be done to improve the image of tourist destinations are by strengthening cognitive image, unique image, and affective image. That cognitive image is knowledge obtained through the cognitive learning process, likewise with the learning carried out by the community (consumers) when selecting an area as a tourist destination [46]. Tourists search for information regarding tourist attractions through multiple sources. Their research will be assessed, and ultimately, they will choose a destination based on the best image. The image of a tourist destination is also determined by image or affective evaluation. Affective images are based more on feelings than beliefs and knowledge about objects. People who believe and believe that a tourist destination will be able to provide high value for them will improve the image of a tourist area. In this case, it shows that the affective image, trust, and knowledge of a tourist attraction will improve the image of a tourist attraction.
Apart from cognitive and affective images, another factor that influences the image of a tourist area is a unique image. The image of tourist attraction is built by its uniqueness. The uniqueness that a tourist attraction has and that other tourist attractions need to have will differentiate that tourist attraction. This attraction’s appeal is what entices visitors and transforms it into favored spot for tourist. The significance of image for a tourist destination, namely the creation of optimism, can be utilized as a marketing strategy and market segmentation, is a form of consumption, influences prospective markets, and influences satisfaction and destination choice [47]. That image will influence consumer loyalty, which is manifested in the form of an intention to revisit and an intention to recommend. Studies show that consumers with a positive image of an area or tourist attraction tend to visit again, tell stories, and provide recommendations to others to visit that attraction [47].
This study employs the explanatory research strategy to elucidate the causal relationships between the research variables and to test the hypotheses by presenting section titles and other headings [48]. This research was conducted in seven districts in the Lake Toba Region of North Sumatra, Indonesia, namely Simalungun Regency, Toba Samosir Regency, Samosir Regency, North Tapanuli Regency, Humbang Hasundutan Regency, Karo Regency, and Dairi Regency. The population of this study is all Domestic Tourists visiting the Lake Toba Region. Since the number of tourists visiting was huge and the population was unknown, a sample was selected using the Lemeshow formula, and 96 respondents were obtained. Researchers used primary data and online research techniques using a web-based electronic questionnaire (Google form).
Furthermore, the constructs of this study's evaluation were graded using a scale (1 - disagree, 5 - strongly agree). The partial least squares (PLS) method was chosen because the most frequent PLS applications involve non-normal data, limited sample sizes, and constructive ideas [49]. The hypotheses and proposed research model were evaluated using the PLS method [49].
4.1 Evaluation of measurement models
The item-level reliability, internal consistency or composite reliability, extracted average variance, and discriminant validity are all evaluated as part of the indicator measurement model evaluation. There is convergent validity for the first three measurements.
4.1.1 Convergent validity
(a) Item reliability
The item's dependability is often known as the indicator's validity. The value of the loading factor (standardized loading) can be used to test the item's reliability (indicator validity). The factor loading value represents the correlation size between each indicator and the construct. The loading factor value greater than 0.7 is considered excellent, implying that the indicator is suitable for measuring constructions. Nonetheless, a standardized loading factor greater than 0.5 is acceptable. Meanwhile, values of the standardized loading factor less than 0.5 can be excluded from the model [50]. The following are the reliability item values present in the standardized loading column:
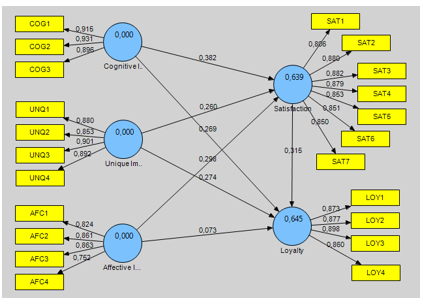
Figure 1. Standardized loading factor inner and outer model
Figure 1 shows that all loadings have a value greater than 0.5, so nothing needs to be set aside. Consequently, each indicator adequately explains each latent variable, namely cognitive image, unique image, affective image, satisfaction, and loyalty.
The cognitive image indicator with the most significant loading is COG2. As for the unique image, the most significant loading factor is UNQ3.The most significant loading factor for indicators on the affective image is AFC3. Indicators of satisfaction: the most significant loading factor is SAT3. Loyalty indicator, the biggest loading factor is LOY3.
(b) Composite reliability
Cronbach's alpha and DG rho (PCA) are the statistics employed for composite or construct reliability. Cronbach's alpha and DG rho (PCA) values greater than 7.0 indicate that the construct is a highly reliable measurement tool. A limit value of 0.7 or higher indicates acceptability, whereas 0.8 or higher indicates extreme satisfaction [51]. The results of the composite reliability can be seen in Table 1:
Table 1. Composite reliability results
|
Composite Reliability |
|
|
Affective Image |
0896 |
|
Cognitive Images |
0.938 |
|
Loyalty |
0.930 |
|
Satisfaction |
0.951 |
|
Unique Image |
0.933 |
The five latent obtained a composite reliability value above 0.7, so all factors have good reliability as a measuring tool.
(c) Average variance extracted (AVE)
Average variance extracted (AVE) defines the variance that an item can explain in comparison to the variance resulting from measurement errors.
Table 2. Results of average variance extracted (AVE)
|
AVE |
|
|
Affective Image |
0.683 |
|
Cognitive Images |
0.836 |
|
Loyalty |
0.769 |
|
Satisfaction |
0.736 |
|
Unique Image |
0.778 |
Table 2 shows that the AVE value for the cognitive image equals 0.683, the unique image is 0.836, and the affective image is 0.769. Meanwhile, satisfaction and loyalty were 0.736 and 0.778. The AVE of the five variables is greater than 0.5, indicating that the construct has acceptable convergent validity when the latent variable can explain an average of more than fifty percent of the variance of the indicators.
4.1.2 Discriminant validity
The discriminant validity of the reflective measurement model is determined by cross-loading and comparing the AVE value to the square of the correlation between constructs. Good discriminant validity will better explain the indicator variable variance than other construct indicators variance. The value of discriminant validity for every indicator is shown in Table 3 below.
Based on the Table 3, it shows that the value of discriminant validity or loading factor for AFC1 is 0.824. The correlation of the AFC1 indicator is higher for affective mages than for unique images, which is equal to 0.542, especially on the cognitive image (0.553), and on satisfaction by 0.607 and loyalty (0.530). The COG1 indicator correlation was higher for the cognitive image (0.915) than the affective image, which was 0.529, especially on the unique image (0.508), satisfaction 0.649 and loyalty (0.619), and so on. All loading factor values for each variable have a stronger correlation with the variable than other variables, similarly, for each variable's indicators. This demonstrates that each variable's indicator positioning is appropriate.
Table 3. Discriminant validity
|
Affective Image |
Cognitive Images |
Loyalty |
Satisfaction |
Unique Image |
|
|
AFC1 |
0.824 |
0.553 |
0.530 |
0.607 |
0.542 |
|
AFC2 |
0.861 |
0.466 |
0.531 |
0.627 |
0.511 |
|
AFC3 |
0.863 |
0.407 |
0.513 |
0.542 |
0.565 |
|
AFC4 |
0.752 |
0.438 |
0.422 |
0.428 |
0.410 |
|
COG1 |
0.529 |
0.915 |
0.619 |
0.649 |
0.508 |
|
COG2 |
0.547 |
0931 |
0.685 |
0.640 |
0.540 |
|
COG3 |
0.472 |
0896 |
0.569 |
0.623 |
0.501 |
|
LOY1 |
0.488 |
0.575 |
0.870 |
0.670 |
0.584 |
|
LOY2 |
0.624 |
0.617 |
0879 |
0.631 |
0.586 |
|
LOY3 |
0.480 |
0.609 |
0898 |
0.625 |
0.587 |
|
LOY4 |
0.531 |
0.600 |
0.861 |
0.643 |
0.624 |
|
SAT1 |
0.524 |
0.571 |
0.596 |
0.806 |
0.545 |
|
SAT2 |
0.622 |
0.557 |
0.638 |
0.880 |
0.622 |
|
SAT3 |
0.605 |
0.638 |
0.656 |
0.882 |
0.610 |
|
SAT4 |
0.593 |
0.579 |
0.613 |
0.880 |
0.577 |
|
SAT5 |
0.629 |
0.620 |
0.647 |
0.852 |
0.524 |
|
SAT6 |
0.542 |
0.585 |
0.563 |
0.852 |
0.522 |
|
SAT7 |
0.529 |
0.637 |
0.677 |
0.848 |
0.556 |
|
UNQ1 |
0.468 |
0.458 |
0.597 |
0.531 |
0.880 |
|
UNQ2 |
0.557 |
0.513 |
0.572 |
0.554 |
0.853 |
|
UNQ3 |
0.592 |
0.536 |
0.668 |
0.626 |
0.901 |
|
UNQ4 |
0.557 |
0.483 |
0.550 |
0.611 |
0892 |
4.2 Structural model evaluation
4.2.1 Path coefficient
The route coefficient can be utilized to ascertain the significance of the influence between the constructs. The sign of the path coefficient must be consistent with the hypothesis; the t-test (critical ratio) derived from the bootstrapping procedure (resampling method) can be used to ascertain the significance of the path coefficient. The inner and exterior models' t-test results are presented in Table 4 below.
Table 4. Direct and indirect effects
|
T-Statistics |
T-Table |
Information |
|
|
Direct Effect |
|||
|
Affective Image -> Satisfaction |
2,685 |
1.986 |
Supported |
|
Cognitive Image -> Satisfaction |
3,757 |
1.986 |
Supported |
|
Unique image -> Satisfaction |
2,438 |
1.986 |
Supported |
|
Affective Image -> Loyalty |
0.600 |
1.986 |
Supported |
|
Cognitive image -> Loyalty |
2,870 |
1.986 |
Supported |
|
Satisfaction -> Loyalty |
2,193 |
1.986 |
Supported |
|
Unique image -> Loyalty |
2,529 |
1.986 |
Supported |
|
Indirect Effect |
|||
|
Affective Image -> Loyalty |
1.965 |
1.986 |
Supported |
|
Cognitive image -> Loyalty |
3.661 |
1.986 |
Supported |
|
Unique image -> Loyalty |
3.325 |
1.986 |
Supported |
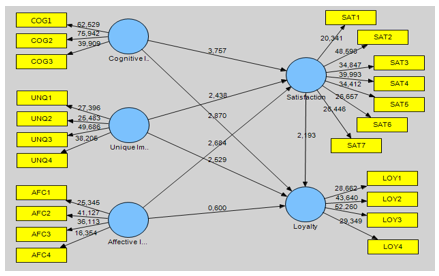
The t-test that was conducted is the result of bootstrap calculations. The t-test results depicted in the preceding diagram will then be compared to the t-table values. The results of hypothesis testing can be seen in Figure 2 below:
Figure 2. Inner and outer T-value models
The study results indicate that using a specific combination of marketing strategies positively impacts tourist satisfaction in the Lake Toba Region. Our study suggests a positive correlation between Cognitive Image and Tourist Satisfaction, where a stronger Cognitive Image corresponds to higher satisfaction level. Conversely, if the cognitive image is poor, the tourist will be more dissatisfied. The results of this study do not agree or are in line with the results of researches [14, 44, 52] prove that the image of the destination consisting of a cognitive image, unique image, and affective image does not affect tourist satisfaction. This study's results align with the study's results [53], which concluded that cognitive image has a positive and significant effect on tourist satisfaction. In determining customer satisfaction, especially in service companies such as tourist attractions, the customer’s experience are diverse, such as the costs incurred and the services of managers of existing tourist attractions [54].
Based on the study's results, Unique Image positively and significantly affects Tourist Satisfaction in Lake Toba Tourism Destinations. This study suggests that tourist satisfaction is positively correlated with the quality of the Unique Image, therefore, striving for huigh-quality images to enhance the overall tourist experience is important. Conversely, the more unfavorable the unique image is, the more dissatisfied the tourist. This study aligns with the study's results [10, 53], which concluded that a unique image positively and significantly affects tourist satisfaction.
This research is contrary to the results of research from a previous study [41]. In the earlier study, it was observed that destination images, including cognitive images, unique images, and affective images did not directly impact satisfaction due to different locations in the study where the Lake Toba Region is indeed very unique compared to with other tourist attractions. Visiting time to enjoy tourism in the Lake Toba area is also unique because visitors who come specifically intend to take a vacation, this is what makes the unique image the satisfaction of visitors to the Lake Toba area. Visitors satisfaction in their ability to find unique offering on the site using online marketing information system [41, 55].
The study results show that Affective Image positively and significantly affects Tourist Satisfaction in Tourist Destinations in the Lake Toba Region. The results of this study mean that the better the affective image, the higher the Tourist Satisfaction. On the other hand, the more deficient the affective image is, the more dissatisfied the tourist will be. This study showed the same results as previous research [56] and concluded that affective image positively and significantly affects tourist satisfaction. So are the research results [57]. From the results analyzed using path statistical analysis, research indicated a direct effect of affective image on the intention of tourists to return.
The study results show that cognitive image positively and significantly affects tourist loyalty in Lake Toba Tourism Destinations. The results of this study mean that if the Cognitive Image is more reasonable, it will increase tourist loyalty. Conversely, if the Cognitive Image is not good, the tourist will be more disloyal. Empirically, the findings of this research study support the results of the research conducted [58], which concluded that cognitive image has a positive and significant effect on tourist loyalty. Research results contradict the study's [59], revealing that cognitive image does not directly affect loyalty.
Based on the study results, tourist loyalty can be strengthened by using high-quality unique images. Conversely, the more unfavorable the Unique Image, the more disloyal the tourist will be. Research [33] highlights the importance of a destination’s overall image and uniqueness in influencing tourist or customer loyalty. This study's results align with research conducted by authors who investigated a unique image does not directly affect tourist loyalty [56].
The study results show that affective image positively and significantly affects tourist loyalty in Lake Toba Tourism Destinations. The results of this study mean that the better the affective image, the more tourist loyalty will increase. Conversely, the more deficient the affective image is, the more disloyal the tourist will be. The research results support the research conducted [45], which shows that affective image positively influences the image of tourist visits where customers will recommend the area, which means the loyalty of tourists or customers. So are the research results [56], who concluded that affective image positively and significantly affects tourist loyalty.
Based on the results of the study shows that Tourist Satisfaction has a positive and significant effect on tourist loyalty in Lake Toba Tourism Destinations. The results of this study denote that the higher the perceived Tourist Satisfaction, the higher the tourist loyalty. Conversely, the lower the Tourist Satisfaction, the more disloyal the tourist will be. The results of this study are in line with the results of research that has been done [60-62], which shows that Tourist Satisfaction has a significant effect on tourist loyalty.
Based on Table 4, it is known that the t-statistic value for the cognitive image of loyalty through satisfaction is 3.661. When compared with the value of t-table, then t count (3.661) > t table (1.986) so that Ho is rejected. Thus, there is a significant influence of cognitive image on loyalty through satisfaction. The magnitude of the effect of cognitive image on loyalty through satisfaction is 0.389. The positive value of the path coefficient indicates that the better the cognitive image, the better the loyalty through satisfaction. This research illustrates a destination's importance in creating customer satisfaction, which will create customer loyalty [56, 63]. Research conducted [52] also agrees that satisfaction arising from affective effects creates customer loyalty. The same thing was conveyed by former researchers [59], where cognitive image affects loyalty through satisfaction.
Table 4, present the t statistic value for a unique image on loyalty through satisfaction is 3.325. When compared with the value of t-table, then t count (3.325) > t table (1.986) so that Ho is rejected. Thus, there is a significant effect of a unique image on loyalty through satisfaction. The magnitude of the influence of a unique image on loyalty through satisfaction is 0.356. The positive path coefficient indicates that the better the unique image, the better the loyalty through satisfaction.
This research aligns with a previous study [64], which found that the unique image of each destination contributes to customer satisfaction loyalty. Similar results are carried out by previous studies [65, 66], suggest that the unique image of the destination is an important driver of customers return and loyalty and an important indicator of customer satisfaction. The uniqueness of tourist attractions can cooperate with local tourism groups such as Tourism Awareness Groups so that these destinations will feel more natural and support the economy of local community groups [67, 58].
Based on Table 4, it is known that the t statistic value for an affective image on loyalty through satisfaction is 1.965. When compared with the value of the t table, then t count (1.965) < t table (1.986) so that Ho is rejected. Thus, there is no significant effect of affective image on loyalty through satisfaction. The influence of affective image on loyalty through satisfaction is 0.167. The positive path coefficient indicates that the better the affective image, the better the loyalty through satisfaction.
This can happen because affective images such as safe, comfortable, and pleasant conditions obtained by tourists satisfy tourists. It is worth noting that this research collaborates the finding of study [68], which highlights the affective image, part of the destination image, influences loyalty through visitor satisfaction. From the results of the existing analysis, when observed from the direct and indirect influence, the image of the destination is decisive in customer satisfaction and loyalty.
Based on data analysis and discussion, cognitive, unique, and affective images have a positive and significant effect on tourist satisfaction in tourist destinations in the Lake Toba Region. Cognitive Image, Unique Image, and Tourist Satisfaction positively and significantly affect Tourist Loyalty in Lake Toba Tourism Destinations. However, affective image does not significantly affect Tourist Loyalty in Lake Toba Tourism Destinations. Cognitive Image and Unique Image have a positive and significant effect on Tourist Loyalty Through Tourist Satisfaction at Tourist Destinations in Lake Toba Tourism Destinations, and affective image has no significant effect on Tourist Loyalty Through Tourist Satisfaction at Tourist Destinations in the Lake Toba Tourism Destinations.
The management of places and tourist attractions located in the community and managed by the local community must also be under government supervision, and there is also a need for cooperation between the government and the community. The government must think carefully before taking direct action, such as holding an audience with the tourism business community, to reduce the chance of conflicting interests between the government and the tourism community. In addition, the public needs to be educated about tourism awareness in order to improve the quality of tourism services that leave positive and unforgettable impressions on tourists. The community and government must work together well so that existing strengths and opportunities can be utilized and developed into solid potential to attract tourists. The existing weaknesses and challenges must be used as lessons to improve the development of Lake Toba's tourism potential by making the weaknesses and challenges benchmarks that must be faced and overcome together.
[1] Saleh, H., Surya, B., Annisa Ahmad, D.N., Manda, D. (2020). The role of natural and human resources on economic growth and regional development: With discussion of open innovation dynamics. Journal of Open Innovation: Technology, Market, and Complexity, 6(4): 103. https://doi.org/10.3390/joitmc6040103
[2] Zhang, J. (2021). The effects of tourism on income inequality: A meta-analysis of econometrics studies. Journal of Hospitality and Tourism Management, 48: 312-321. https://doi.org/10.1016/j.jhtm.2021.07.009
[3] Habibi, F., Rahmati, M., Karimi, A. (2018). Contribution of tourism to economic growth in Iran's Provinces: GDM approach. Future Business Journal, 4(2): 261-271. https://doi.org/10.1016/j.fbj.2018.09.001
[4] Camprubí, R., Guia, J., Comas, J. (2008). Destination networks and induced tourism image. Tourism Review, 63(2): 47-58. https://doi.org/10.1108/16605370810883941
[5] Kotler, P., Keller, K.L. (2016). Marketing management. 15th ed. New Jersey: Pearson Education.
[6] Souiden, N., Ladhari, R., Chiadmi, N.E. (2017). Destination personality and destination image. Journal of Hospitality and Tourism Management, 32: 54-70. https://doi.org/10.1016/j.jhtm.2017.04.003
[7] Nazir, M.U., Yasin, I., Tat, H.H. (2021). Destination image's mediating role between perceived risks, perceived constraints, and behavioral intention. Heliyon, 7(7): e07613. https://doi.org/10.1016/j.heliyon.2021.e07613
[8] Sürücü, Ö., Öztürk, Y., Okumus, F., Bilgihan, A. (2019). Brand awareness, image, physical quality and employee behavior as building blocks of customer-based brand equity: Consequences in the hotel context. Journal of Hospitality and Tourism Management, 40: 114-124. https://doi.org/10.1016/j.jhtm.2019.07.002
[9] Jeong, Y., Kim, S. (2020). A study of event quality, destination image, perceived value, tourist satisfaction, and destination loyalty among sport tourists. Asia Pacific Journal of Marketing and Logistics, 32(4): 940-960. https://doi.org/10.1108/APJML-02-2019-0101
[10] Huete Alcocer, N., López Ruiz, V.R. (2020). The role of destination image in tourist satisfaction: The case of a heritage site. Economic research-Ekonomska istraživanja, 33(1): 2444-2461. https://doi.org/10.1080/1331677X.2019.1654399
[11] Islamy, M.R., Trisnawati, J.D., Rahayu, S. (2022). The effect of perceived service quality, perceived value, destination image, attitude to visiting behavior, tourist satisfaction on tourist loyalty. Journal of Entrepreneurship & Business, 3(1): 35-48. https://doi.org/10.24123/jeb.v3i1.4827
[12] Chi, C.G.Q., Qu, H. (2008). Examining the structural relationships of destination image, tourist satisfaction and destination loyalty: An integrated approach. Tourism Management, 29(4): 624-636. https://doi.org/10.1016/j.tourman.2007.06.007
[13] Ruan, W.Q., Li, Y.Q., Liu, C.H.S. (2017). Measuring tourism risk impacts on destination image. Sustainability, 9(9): 1501. https://doi.org/10.3390/su9091501
[14] Afshardoost, M., Eshaghi, M.S. (2020). Destination image and tourist behavioural intentions: A meta-analysis. Tourism Management, 81: 104154. https://doi.org/10.1016/j.tourman.2020.104154
[15] Rajesh, R. (2013). Impact of tourist perceptions, destination image and tourist satisfaction on destination loyalty: A conceptual model. PASOS. Revista de Turismo y Patrimonio Cultural, 11(3): 67-78. https://doi.org/10.25145/j.pasos.2013.11.039
[16] Bui, V., Alaei, A.R., Vu, H.Q., Li, G., Law, R. (2022). Revisiting tourism destination image: A holistic measurement framework using big data. Journal of Travel Research, 61(6): 1287-1307. https://doi.org/10.1177/00472875211024749
[17] Coker, A., Iyamabo, J., Otubanjo, O. (2013). Investigating service responsiveness in customer perception of the corporate logo. International Journal of Business and Management, 8(11): 38-50. https://doi.org/10.5539/ijbm.v8n11p38
[18] Lin, L.Y., Lu, C.Y. (2010). The influence of corporate image, relationship marketing, and trust on purchase intention: the moderating effects of word-of-mouth. Tourism Review, 65(3): 16-34. https://doi.org/10.1108/16605371011083503
[19] Zuo, B., Tsai, C.H.K., Su, C.H.J., Jantes, N., Chen, M.H., Liu, J. (2023). Formation of a tourist destination image: Co-occurrence analysis of destination promotion videos. Journal of Destination Marketing & Management, 27: 100763. https://doi.org/10.1016/j.jdmm.2023.100763
[20] Garay, L. (2019). # Visitspain. Breaking down affective and cognitive attributes in the social media construction of the tourist destination image. Tourism Management Perspectives, 32: 100560. https://doi.org/10.1016/j.tmp.2019.100560
[21] Marine-Roig, E., Huertas, A. (2020). How safety affects destination image projected through online travel reviews. Journal of Destination Marketing & Management, 18: 100469. https://doi.org/10.1016/j.jdmm.2020.100469
[22] Cai, L.A., Feng, R., Breiter, D. (2004). Tourist purchase decision involvement and information preferences. Journal of Vacation Marketing, 10(2): 138-148. https://doi.org/10.1177/135676670401000204
[23] Leisen, B. (2001). Image segmentation: The case of a tourism destination. Journal of Services Marketing, 15(1): 49-66. https://doi.org/10.1108/08876040110381517
[24] Tasci, A.D., Kozak, M. (2006). Destination brands vs destination images: Do we know what we mean?. Journal of Vacation Marketing, 12(4): 299-317. https://doi.org/10.1177/1356766706067603
[25] Pike, S. (2009). Destination brand positions of a competitive set of near-home destinations. Tourism Management, 30(6): 857-866. https://doi.org/10.1016/j.tourman.2008.12.007
[26] Ruiz-Real, J.L., Uribe-Toril, J., Gázquez-Abad, J.C. (2020). Destination branding: Opportunities and new challenges. Journal of Destination Marketing & Management, 17: 100453. https://doi.org/10.1016/j.jdmm.2020.100453
[27] Xie, C., Huang, Q., Lin, Z., Chen, Y. (2020). Destination risk perception, image and satisfaction: The moderating effects of public opinion climate of risk. Journal of Hospitality and Tourism Management, 44: 122-130. https://doi.org/10.1016/j.jhtm.2020.03.007
[28] Keller, K.L. (2013). Strategic brand management: Building, measuring, and managing brand equity. 4th ed. New Jersey: Pearson Education Inc.
[29] Hanzaee, K.H., Saeedi, H. (2011). A model of destination branding for Isfahan city: Integrating the concepts of the branding and destination image. Interdisciplinary Journal of Research in Business, 1(4): 12-28. https://www.academia.edu/5077606/A_Model_of_Destination_Branding_For_Isfahan_City_Integrating_the_Concepts_of_the_Branding_and_Destination_Image
[30] Kladou, S., Kavaratzis, M., Rigopoulou, I., Salonika, E. (2017). The role of brand elements in destination branding. Journal of Destination Marketing & Management, 6(4): 426-435. https://doi.org/10.1016/j.jdmm.2016.06.011
[31] Cocola-Gant, A. (2023). Place-based displacement: Touristification and neighborhood change. Geoforum, 138: 103665. https://doi.org/10.1016/j.geoforum.2022.103665
[32] Anele, K.K., Sam-Otuonye, C.C. (2021). Sustainable Tourism: Evidence from Lake Toba in North Sumatra, Indonesia. ASEAN Journal on Hospitality and Tourism, 19(1): 52-62. https://doi.org/10.5614/ajht.2021.19.1.05
[33] Qu, H., Kim, L.H., Im, H.H. (2011). A model of destination branding: Integrating the concepts of the branding and destination image. Tourism Management, 32(3): 465-476. https://doi.org/10.1016/j.tourman.2010.03.014
[34] Hosany, S., Ekinci, Y., Uysal, M. (2006). Destination image and destination personality: An application of branding theories to tourism places. Journal of Business Research, 59(5): 638-642. https://doi.org/10.1016/j.jbusres.2006.01.001
[35] Florek, M., Insch, A., Gnoth, J. (2006). City council websites as a means of place brand identity communication. Place Branding, 2: 276-296. https://doi.org/10.1057/palgrave.pb.6000036
[36] Morgan, N., Pritchard, A., Pride, R. (2004). Destination branding: Creating the unique destination proposition. London: Elsevier Butterworth-Heinemann.
[37] Deunk, M.I., Smale-Jacobse, A.E., de Boer, H., Doolaard, S., Bosker, R.J. (2018). Effective differentiation practices: A systematic review and meta-analysis of studies on the cognitive effects of differentiation practices in primary education. Educational Research Review, 24: 31-54. https://doi.org/10.1016/j.edurev.2018.02.002
[38] Aaker, D.A. (2008). Managing brand equity: Capitalizing on the value of a brand name. New York: Free Press.
[39] Cai, L.A. (2002). Cooperative branding for rural destinations. Annals of Tourism Research, 29(3): 720-742. https://doi.org/10.1016/S0160-7383(01)00080-9
[40] Baloglu, S., McCleary, K.W. (1999). A model of destination image formation. Annals of Tourism Research, 26(4): 868-897. https://doi.org/10.1016/S0160-7383(99)00030-4
[41] Baloglu, S., Brinberg, D. (1997). Affective images of tourism destinations. Journal of Travel Research, 35(4): 11-15. https://doi.org/10.1177/004728759703500402
[42] Echtner, C.M., Ritchie, J.B. (1993). The measurement of destination image: An empirical assessment. Journal of Travel Research, 31(4): 3-13. https://doi.org/10.1177/004728759303100402
[43] Bigne, J.E., Sanchez, M.I., Sanchez, J. (2001). Tourism image, evaluation variables and after purchase behaviour: Inter-relationship. Tourism Management, 22(6): 607-616. https://doi.org/10.1016/S0261-5177(01)00035-8
[44] Chen, C.F., Tsai, D. (2007). How destination image and evaluative factors affect behavioral intentions?. Tourism Management, 28(4): 1115-1122. https://doi.org/10.1016/j.tourman.2006.07.007
[45] Qu, H., Kim, L.H., Im, H.H. (2011). A model of destination branding: Integrating the concepts of the branding and destination image. Tourism Management, 32(3): 465-476. https://doi.org/10.1016/j.tourman.2010.03.014
[46] Mowen, J.C., Minor, M. (2012). Perilaku Konsumen. Jakarta: Erlangga.
[47] Croy, W.G. (2004). Teaching tourism, image and media relationships. In International Tourism and Media Conference, pp. 24-38. https://www.researchgate.net/publication/228734810_Teaching_tourism_image_and_media_relationships
[48] Nasution, M.I., Fahmi, M., Prayogi, M.A. (2020). The quality of small and medium enterprises performance using the structural equation model-part least square (SEM-PLS). In Journal of Physics: Conference Series, 1477(5): 052052. https://doi.org/10.1088/1742-6596/1477/5/052052
[49] Hair, J.F., Black, W.C., Babin, B.J., Anderson, R.E. (2014). Multivariate data analysis, seventh. United States of America: Pearson Education Limited.
[50] Chin, W.W. (1998). The partial least squares approach to structural equation modeling. Modern Methods for Business Research, 295(2): 295-336. https://www.researchgate.net/publication/311766005_The_Partial_Least_Squares_Approach_to_Structural_Equation_Modeling
[51] Nunnally, J.C., Bernstein, I.H. (1994). Psychometric Theory. 3rd ed. Psychometric Theory: McGraw Hill.
[52] Del Bosque, I.R., San Martín, H. (2008). Tourist satisfaction a cognitive-affective model. Annals of Tourism Research, 35(2): 551-573. https://doi.org/10.1016/j.annals.2008.02.006
[53] Marques, C., da Silva, R.V., Antova, S. (2021). Image, satisfaction, destination and product post-visit behaviours: How do they relate in emerging destinations?. Tourism Management, 85: 104293. https://doi.org/10.1016/j.tourman.2021.104293
[54] Martín, J.C., Saayman, M., du Plessis, E. (2019). Determining satisfaction of international tourist: A different approach. Journal of Hospitality and Tourism Management, 40: 1-10. https://doi.org/10.1016/j.jhtm.2019.04.005
[55] Kim, S.K., Park, J.A., Kim, W. (2016). The mediating effect of destination image on the relationship between spectator satisfaction and behavioral intentions at an international sporting event. Asia Pacific Journal of Tourism Research, 21(3): 273-292. https://doi.org/10.1080/10941665.2015.1048262
[56] Hidayatullah, S., Rachmawati, I.K., Aristanto, E., Waris, A., Patalo, R.G. (2020). Peran Sistem Informasi Pemasaran, Kualitas Pelayanan dan Entrepreneurial marketing serta Kepuasan Terhadap Loyalitas Generasi Milenial Berkunjung ke Tempat Wisata. J. Ilm. Bisnis dan Ekon. Asia, 14(1): 74-83. https://doi.org/10.32812/jibeka.v14i1.184
[57] San Martín, H., Del Bosque, I.A.R. (2008). Exploring the cognitive-affective nature of destination image and the role of psychological factors in its formation. Tourism Management, 29(2): 263-277. https://doi.org/10.1016/j.tourman.2007.03.012
[58] Hidayatullah, S., Rachmawati, I.K., Khouroh, U., Windhyastiti, I. (2017). The effectivity of “Pokdarwis” role on successfully marketing of tourism village towards “Mega Tourism: Batu City For The World”. in International Conference “Sustainable Development Goals 2030 Challenges and Its Solutions", pp. 467-476. https://eprints.unmer.ac.id/id/eprint/3072/
[59] Afroz, N., Istiaque, A. (2022). Impact of the cognitive image on destination loyalty: A parallel mediation technique. Tourism and Sustainable Development Review, 3: 45-61. https://doi.org/10.31098/tsdr.v3i1.61
[60] Teviana, T., Ginting, P., Lubis, A.N., Gultom, P. (2017). Antecedents of tourism destination image and customer satisfaction in tourism industry. European Research Studies Journal, 20(3A): 435-445. https://ersj.eu/dmdocuments/2017-xx-3-a-28.pdf
[61] Tefera, O., Govender, K. (2016). Hotel ratings, service quality, customer satisfaction and loyalty: The perception of guests at Ethiopian hotels. African Journal of Hospitality, Tourism and Leisure, 5(3): 1-23. https://www.ajhtl.com/uploads/7/1/6/3/7163688/article_28_vol_5__3__final.pdf
[62] Suwunniponth, W. (2013). Tourist satisfaction and loyalty toward service quality of the online tourism enterprises. International Journal of Economics and Management Engineering, 7(8): 2461-2464. https://doi.org/10.5281/zenodo.1088022
[63] Rakhmadian, M., Hidayatullah, S., & Respati, H. (2017). Analisis kualitas sistem dan kualitas informasi terhadap kepuasan pemakai sistem informasi akademik dosen. In Seminar Nasional Sistem Informasi 2017, pp. 665-675. https://jurnalfti.unmer.ac.id/index.php/senasif/article/view/89
[64] Morrison, A., Anderson, D. (2002). Destination branding.
[65] Pawaskar, P., Goel, M. (2014). A conceptual model: Multisensory marketing and destination branding. Procedia Economics and Finance, 11: 255-267. https://doi.org/10.1016/s2212-5671(14)00194-4
[66] Getz, D. (1992). Tourism planning and destination life cycle. Annals of Tourism Research, 19(4): 752-770. https://doi.org/10.1016/0160-7383(92)90065-W
[67] Hidayatullah, S., Rachmawati, I.K., Khouroh, U., Windhyastiti, I. (2018). Development of tourist village model through “Pokdarwis” empowerment and information technology utilization. European Journal of Business and Management, 10(23): 22-28. https://doi.org/10.7176/ejbm-10-23-12
[68] Sahin, S., Baloglu, S. (2014). City branding: Investigating a brand advocacy model for distinct segments. Journal of Hospitality Marketing & Management, 23(3): 239-265. https://doi.org/10.1080/19368623.2013.779562