Deih Haissoune![]() | Khelifa Hami*
| Khelifa Hami*![]() | Ibrahim Zeroual
| Ibrahim Zeroual![]() | Amar Meddah
| Amar Meddah![]()
© 2023 IIETA. This article is published by IIETA and is licensed under the CC BY 4.0 license (http://creativecommons.org/licenses/by/4.0/).
OPEN ACCESS
In arid regions like Tindouf, Algeria, the availability of water is crucial for the stability and sustainable development of local populations. This study investigates the groundwater sources in the Tindouf region, examining their flow rates, aquifer thickness, and water quality. We collected and analyzed water samples from boreholes with flow rates ranging from 0.5 to 13 l/s and found that the average aquifer thickness is between 80 and 100 m. Our chemical analysis reveals that the water is mainly characterized by calcium sulfate and magnesium sulfate facies. Furthermore, the groundwater quality in the study area meets the World Health Organization and Algerian drinking water standards. Our findings have important implications for the sustainable development of the Tindouf region and highlight the need for effective management of groundwater resources.
drinking water standards, groundwater, hydrogeology, sustainable development, Tindouf, water quality
Groundwater is a vital resource, especially in arid and semi-arid regions where surface water is often non-existent or scarce. Groundwater is generally drinkable at sources and available on site [1]. They are therefore of capital importance because they represent a key limiting factor in sustainable development and improvement in the quality of life, as is the case in southern Algeria. The problem of water in these regions arises mainly in terms of availability, quality and management of this rare and fragile resource, given the continued increase in needs on the one hand, and the low refilling of reservoirs due to the scarcity of precipitation on the other hand.
In the Tindouf region, as in all arid Saharan regions [2], the availability of water is an important factor for the stability of local populations. Groundwater is one of the natural resources for agricultural purposes, domestic industrial needs and industrial needs in arid regions [3]. Any economic development is conditioned by the primordial problem of the availability of water. Boreholes and wells are an effective way to mobilize groundwater in the region. Groundwater reserves are linked to hydrological characteristics Rahmani.
The presentation of structural and stratigraphic data will be necessary for understanding the hydrogeology of the region. This work focuses on a synthesis of the various studies and works carried out on the Tindouf basin and our observations on several dozen boreholes and wells in the study area.
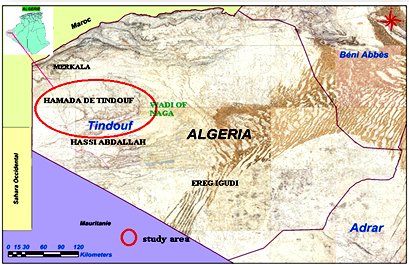
Tindouf forms a vast border zone with (Morocco, Mauritania and the accidental Sahara (R.A.S.D) covering an area of 200,000km2 in fact, it extends over 570km from East to West and 470km from North to South the capital of the Tindouf is located about 2000km SW of Algiers. From the morphological point of view, it constituted a vast flat and monotonous expanse. It is between the parallel 26°N and 28°N and the meridian 6°W and 9°W [4-6]. The region has a declared population of approximately 120,742 inhabitants divided between two communes, Tindouf and Oum El Assel. It has two important iron deposits, one in Gara Djebilet and the other is located instead of Mecheri Abdelaziz [7], which is located in the extreme south-west of the country, it is limited to the north by Bechar zone, to the east of Adrar region, to the south by Mauritania and to the west by Western Sahara and Morocco (Figure 1). The study region is subject to a Saharan climate that is part of the Algerian great Sahara desert, characterized typically by a true desert climate, in other words, arid and dry, characterized by an average monthly temperature of around 23.75℃ and average annual precipitation of the order of 35.32mm.
Figure 1. Geographical location of the Tindouf region and the study area
To this end, it should be noted that the research and exploitation of the underground hydraulic resources of a given geological formation are closely linked to the knowledge of the geological nature of the sediments and their horizontal and vertical extension [8]. In our context, it also seems very useful to know the hydrogeological properties of this Hamadian aquifer with free water table.
The main objectives of our work is to identify the situation of the Hamadien aquifer and to determine a contribution to the hydrogeological study and the evaluation of the chemical quality of the waters of the aquifer studied.
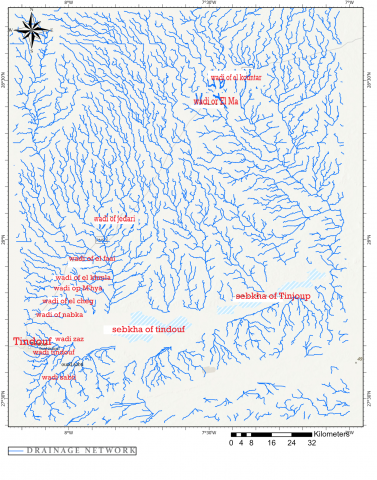
Our study area is located in the northern part of the Tindouf basin and stratigraphically occupies the northern position which corresponds to the Hamadian aquifer. It is an unconfined aquifer captured by a large number of wells and boreholes, intended for the irrigation of arable land and the supply of drinking water. Whose hydrographic network is made up of a series of endorheic basins which includes the large sebkha of Tindouf, the sebkha of Tinjoup (Figure 2), the sebkha of Ain El Barka in the N-E sector and other smaller sebkhas.
In the region of Tindouf, Oued El Ma is the most important source, with its tributary of Oued El Kountar, it originates from the locality of Touiref Boom (upstream part of the Hamadinne aquifer) and flows in a linear of approximately 85km to flow into the great Sebkha of Tindouf [9], with large quantities of water that are lost when it comes to occasional or torrential rains. As can also be mentioned Oued Naga and Oued El Khachbbine flow from the north towards the Sebkha, which was located on the axis of the Syncline of the Bassinet, the level of the entire hydrographic network flowing from North to South and coming mainly from the southern flank of the Anti-Atlas. It also receives the Tatrat, Sabi (Figure 2), and Sabti El Foukani wadis, which drainage the eastern sector of the Sebkha of Tindouf [10-12]. Are often dry for most of the desert year. The vegetation in the region is characterized by the Acacias Tortilis (Forsk) and the argan tree [13], which grow from the wadis and resist the desert climate. The distribution of the argan tree (Argania Spinoza) is only known at a few stations located in Oued El-Ma.
Figure 2. Hydrographic network of the study area
The hydrogeological description of this study area is based on the information carried out in the different structural stages of the Tindouf basin and which showed the presence of a crystalline basement of the Precambrian age, represented by schists, quartzites, and rocks granitic [14]. The sedimentary cover, which overcomes this crystalline basement major angular unconformity draws a vast synclinal structure. This cover is essentially represented by the foundations of the Paleozoic on which the rest of the Hamadian formations attributed to the tertiary and quaternary. The Paleozoic series is located between the Anti-Atlas in the north and the Réguibat ridge in the south. To the east, it is delimited, respectively from north to south, by Tafilalt and the chain of Ougarta [4]. Towards the West, it passes through the Mechemrs country, then into the Western Sahara where it disappears under the Cretaceous, which outcrops less than 100 km north of Tindouf [15, 16].
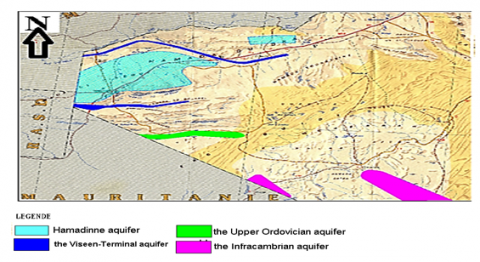
From a hydrogeological point of view, the aquifer system of the Tindouf region is characterized by the superposition of five aquifers, from bottom to top (Figure 3).
Infra-Cambrian limestone aquifer: It is known only in the CHENACHENE basin solicited only by two borehole's debiting 2.50 l/s [17].
Upper Ordovician sandstone and quartzite aquifer: this aquifer is known in the south of the region, where the flow rates from boreholes are around 02 to 12 l/s. It is used by a hundred traditional wells in the locality of Aouinet Bel-Lagraa. This water is of very good quality for human consumption [18].
Lower Devonian sandstone aquifer: It is only known in the south of the region, around Gara-Djebilet [6], the flow rate of the bore holes is around 2 to 3 l/s.
Viseen-Terminal limestone and dolomite aquifer: This is the main source of drinking water supply for the town of Tindouf [19]. It is the largest water reservoir in the region [14]. The mineralization of the waters varies between 2.4 to 20 g/l and the flow rates of the bore holes are around 10 to 45 l/s. The dolomites of the upper carbonate member, which represent the main aquifer of the formation, were studied for the first time in the Hassi Abdallah area.
Figure 3. Distribution of the different aquifers in the Tindouf zone
Table 1. Inventory of drillings and wells across the study area
|
N. |
Name of Source |
Long (X) |
Latit (Y) |
Alt Z(m) |
Depth (m) |
Flow (/s) |
Static Level (m) |
Overage |
Usage |
|
01 |
G.T.1 |
08°01'44"W |
27° 52' 13" |
435 |
91 |
10 |
20 |
Drilling |
Irrigation |
|
02 |
G.T.2 |
8°01'52.5"W |
27° 53' 12" |
435 |
96 |
8 |
21 |
Drilling |
Irrigation |
|
03 |
G.T.3 |
8°02'57"W |
27° 52' 06" |
437 |
125 |
7 |
21 |
Drilling |
Irrigation |
|
04 |
G.T.4 |
08°02'15"W |
27° 53' 48" |
439 |
97 |
8 |
23,22 |
Drilling |
Irrigation |
|
05 |
G.T.5 |
08°03'10"W |
27° 52' 09" |
435 |
95 |
13 |
21 |
Drilling |
Irrigation |
|
06 |
G.T.6 |
08°02'22"W |
27° 52' 45" |
436 |
90 |
10 |
20 |
Drilling |
Irrigation |
|
07 |
G.T.7 |
08°02'55"W |
27° 51' 21" |
436 |
84 |
7 |
22,5 |
Drilling |
Irrigation |
|
08 |
G.T.8 |
08°01'37"W |
27° 52' 32" |
434 |
96 |
12 |
21 |
Drilling |
Irrigation |
|
09 |
G.T.9 |
08°01'32"W |
27° 52' 36" |
434 |
68 |
11 |
21 |
Drilling |
Irrigation |
|
10 |
G.T.10 |
08°01'51"W |
27° 53' 21" |
437 |
90 |
9 |
21,35 |
Drilling |
Irrigation |
|
11 |
G.T.11 |
08°03'27"W |
27° 51' 15" |
437 |
84 |
8 |
20,9 |
Drilling |
Irrigation |
|
12 |
G.T.12 |
08°02'55"W |
27° 53' 35" |
440 |
84 |
3.90 |
21,4 |
Drilling |
Irrigation |
|
13 |
G.T.13 |
08°02'46.4"W |
27° 54' 12" |
439 |
97 |
5 |
20.10 |
Drilling |
Irrigation |
|
14 |
G.T.14 |
08°01'39"W |
27° 52' 39" |
435 |
90 |
5 |
21.10 |
Drilling |
Irrigation |
|
15 |
AEROPORT 03 |
08°09'46"W |
27°42' 47" |
444 |
90 |
6 |
31 |
Drilling |
Potable water |
|
16 |
ROMADINE |
08°08' 46"W |
27° 40' 46" |
412 |
65 |
4 |
11 |
Drilling |
Potable water |
|
17 |
R.Z.01 |
08°08' 06"W |
27° 41' 05" |
401 |
57 |
5 |
7.5 |
Drilling |
Potable water |
|
18 |
R.Z.02 |
08° 07' 49"W |
27° 41' 07" |
415 |
59 |
5 |
11.50 |
Drilling |
Potable water |
|
19 |
MARKALA |
08° 10' 02"W |
27° 46' 02" |
451 |
135 |
5 |
31.5 |
Drilling |
Potable water |
|
20 |
O M 01 |
08° 03'48"W |
27° 48' 56" |
430 |
93 |
6 |
20,1 |
Drilling |
Irrigation |
|
21 |
O M 02 |
08° 04'17"W |
27° 49' 07" |
435 |
92 |
6 |
20,5 |
Drilling |
Irrigation |
|
22 |
O M 03 |
08° 04'14"W |
27° 48' 32" |
434 |
96 |
6 |
20.50 |
Drilling |
Irrigation |
|
23 |
O M 04 |
08° 02'32"W |
27° 49'52" |
432 |
83 |
6 |
21 |
Drilling |
Irrigation |
|
24 |
O M 05 |
08° 04'29"W |
27° 48' 7" |
436 |
99 |
5 |
19 |
Drilling |
Irrigation |
|
25 |
O M 06 |
08° 04'59"W |
27° 48' 16" |
436 |
96 |
5 |
24.30 |
Drilling |
Irrigation |
|
26 |
O M 07 |
08° 04'43.1"W |
27° 48' 58" |
438 |
100 |
5 |
22.30 |
Drilling |
Irrigation |
|
27 |
O M 08 |
08° 02'56.1"W |
27° 49'21.4" |
431 |
84 |
5 |
20.85 |
Drilling |
Irrigation |
|
28 |
O M 09 |
08° 04'43"W |
27° 47'44" |
435 |
83 |
5 |
19.5 |
Drilling |
Irrigation |
|
29 |
Bandes 01 |
08° 08' 57"W |
27° 43' 32" |
444 |
94 |
4,5 |
31,6 |
Drilling |
Irrigation |
|
30 |
Bandes 03 |
08° 09' 10"W |
27° 43' 10" |
443 |
90 |
4 |
31 |
Drilling |
Irrigation |
|
31 |
espace verte 02 |
08° 09' 27"W |
27° 41' 19" |
429 |
76 |
4 |
23 |
Drilling |
Irrigation |
|
32 |
Fouiar (Ryacha) |
07° 54' 47.60"W |
27° 57' 46.6" |
412 |
10 |
2 |
3.00 |
Well |
Potable water |
|
33 |
Puits kantar01 |
07° 53' 18.8"W |
28° 01' 32" |
418 |
9 |
3 |
8.5 |
Well |
Potable water |
|
34 |
Puits kantar02 |
07° 54' 7.8"W |
28° 01' 6.36" |
439 |
17 |
2 |
14.40 |
Well |
Potable water |
|
35 |
Puits Zaza |
07° 57' 29.6"W |
27° 58' 34.5" |
424 |
10 |
0.5 |
9.70 |
Well |
Potable water |
|
36 |
Puits Belali |
07° 51' 43.8"W |
27° 55' 24.4" |
397 |
7 |
1 |
2.60 |
Well |
Potable water |
|
37 |
Puits MAKHLOL |
07° 51' 49.5"W |
27° 55' 19" |
399 |
7 |
1 |
4.00 |
Well |
Potable water |
|
38 |
EL MA 01 |
07° 52'33.9"W |
27° 55' 8.9" |
410 |
10 |
4 |
2.60 |
Well |
Potable water |
|
39 |
EL MA 02 |
07° 53'25.7"W |
27° 56' 48.9" |
405 |
9 |
4 |
2.90 |
Well |
Potable water |
|
40 |
EL MA 03 Zgulma |
07° 55'12"W |
27° 58' 5.3" |
413 |
10 |
4 |
3.50 |
Well |
Potable water |
|
41 |
EL MA 04 |
07° 59'46.5"W |
27° 59' 18.8" |
434 |
18 |
4 |
17.60 |
Well |
Potable water |
|
42 |
GLT02 |
08° 03'46"W |
27°43' 34" |
390 |
76 |
4 |
6.00 |
Drilling |
Potable water |
|
43 |
DKS |
08° 09'50"W |
27°43' 35" |
434 |
87 |
3 |
31.70 |
Drilling |
Potable water |
|
44 |
HNT104 |
08° 09'07"W |
27°41' 10.33" |
429 |
70 |
4 |
28 |
Drilling |
Potable water |
|
45 |
HT29 |
08° 05'48"W |
27°48' 02" |
439 |
100 |
5 |
23.4 |
Drilling |
Potable water |
|
46 |
GLT03(alyoune03) |
08° 03'02"W |
27°44' 25" |
396 |
90 |
4 |
12 |
Drilling |
Potable water |
Hamadinne aquifer: this aquifer concerns on the entire northern part of the region, the flow rates of the boreholes varying between 0.5 and 13 l/s. The Hamadian terrains are represented by sandstone with sometimes clayey conglomerate at the base and at the top of the dolomitic limestone slabs. The impermeable bed is made up of Namur-Westphalian clays and sandy clays. The permeable soils of the Hamada are sometimes in hydraulic contact with the subjacent layers of the upper vision [19]. The aquifer that is found in these lands is free and the average thickness of this formation is of the order of 60 to 100 m, this whole formation rests in angular unconformity on the red clays of the continental Carboniferous (Paleozoic series).
This work represents a contribution to the hydrogeological study and evaluation of the chemical quality of the waters of the Hammadinne aquifer with respect to consumption [20].
A piezometric measurement campaign was also carried out in the study area in April 2022 (Table 1); the piezometric level of the continental Tertiary aquifer was measured by the piezometric probe, and the location of the coordinates of the boreholes and wells by GPS (GPS, Global Positioning System). The sampling was carried out at the level of water samples from wells and boreholes; the choice of water points was made in such a way that we can have a regular and homogeneous distribution over the entire surface of the study. The data used in this part come from a field campaign carried out on March 2022.
This study went through three stages of implementation in the field:
The first step was to locate the boreholes and wells, and the process at these sites took a period of two days. With a count of 36 drillings and 10 wells;
As for the second stage, more difficult than the previous one, it depends on the measurement of the static water level and requires a longer period of time, given that the wells to be measured must be in a stable state and without farmers do not pump and choose the appropriate moment;
The third stage was represented by the collection of samples for the chemical analyzes for essential to the study, and on this basis, it was chosen to collect eight (8) samples in a distributed manner from the lover downstream tablecloth.
The physico-chemical analyzes were carried out in the laboratory [21]. The Algerian Waters Unit of Tindouf (ADE) according to the following protocols:
ArcGIS is a mapping framework that allows you to create, share and use smart maps with ArcGIS the collection of geographic and hydrogeological information was used in this study to establish the piezometric map. On the other hand, the diagram software is software to help with the interpretation of hydrochemical data, user-friendly, easy and quick to use. It is essentially oriented towards the study of major elements commonly encountered in natural waters. Individuals were developed to represent the results of hydrochemical analyzes and were chosen for this purpose in the study.
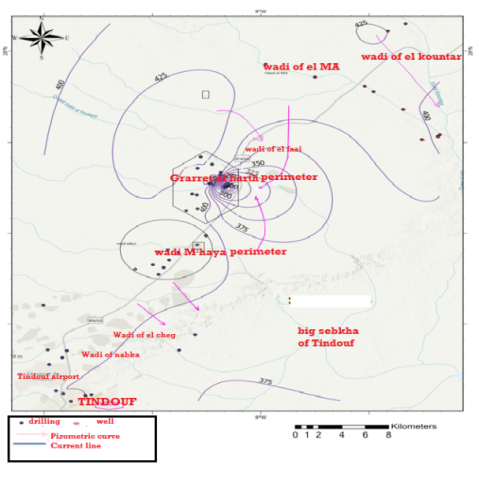
Examination of the piezometric map of the study area drawn up in April 2022 (Figure 4) shows more or less curved equipotential with variable spacing indicating a radial-type unconfined aquifer. The overall groundwater flow is from the NW to the SE in the direction of the overall loss of reservoir land from the NW to the Sebkha of Tindouf and the Sebka of Tinjouk. The streamlines converge towards the Graret El Hareth perimeter.
Figure 4. Piezometric map of the study area
The streamlines show that the drained water comes from the northern flanks. In the center: A South-West North-East flow at the level of the Oued El Faai zone to go towards the agricultural perimeter Grarte El Harth, with a piezometric depression which corresponds to a piezometric catchment zone fed by water coming from the northern part of Hamada, it is a water catchment area at the piezometric level is less than 275 m, the streamlines are converging towards the boreholes of Grarte El Harth. According to the hypsometric curves, the lowest point of the aquifer is located in the area of the Sebkha of Tindouf where the aquifer evaporates and forms a zone of water accumulation, constituting the Sebkha.
The modulus of the hydro-isohypse curve spacing is not constant, which reflects local variations in permeability with an average hydraulic gradient of 2.10-3. Drought that leads to evaporation can have significant repercussions on the flow of surface and groundwater. The continental tertiary in the study area is characterized by:
The piezometric depression observed in this area is due to:
Water chemistry analysis is an essential complement to the hydrogeological study. Changes in groundwater geochemistry may be a function of changes in hydrogeological properties or mineral content of host rocks [23, 24]. It provides a great deal of information on the aquifer environment [25], the nature of the surrounding rock, the supply and circulation zones, as well as the potability of the water. This hydrochemical study is based on the interpretation of chemical analyzes of samples from water points (boreholes and wells). These analyzes were carried out in the water chemistry laboratory, and focused on the following major chemical elements:
Compared to Algerian and, the world health organiztion (W H O) (Table 2 and Table 3) standards of potability the water [26] remains within the standards with regard to cations and anions approximately 96.29% of the water points are drinking water.
The data used in this part come from a field campaign in the study are carried out on March 2022. The physico-chemical analyzes of eight samples measured were carried out in the laboratory; the procedure was followed according to the following protocol:
Table 2. Algerian potability standards
|
Settings |
Units |
Maximum Allowable Concentration |
|
pH |
6.5-8.5 |
Conductivité |
|
S/cm à 20°C |
2880 |
Résidu sec |
|
mg/L’après séchage à |
2000 |
180℃ |
|
Dureté Totale |
mg/L of (CaCO3) |
500 |
|
Calcium |
mg/L |
200 |
|
Magnésium |
mg/L |
150 |
|
Sodium |
mg/L |
200 |
|
Potassium |
mg/L |
20 |
|
Sulfates |
mg/L |
400 |
|
Chlorures |
mg/L |
500 |
|
Nitrates |
mg/L |
50 |
|
Nitrites |
mg/L |
0,1 |
Table 3. World Health Organization standards for drinking water (WHO, 2011)
|
|
WHO (2011) |
|
Ca2+ |
75mg/l |
|
Mg2+ |
50mg/l |
|
Na+ |
200mg/l |
|
K+ |
12mg/l |
|
Cl- |
250mg/l |
|
SO42- |
250mg/l |
|
HCO3- |
120mg/l |
|
NO3- |
50mg/l |
|
CE |
1500µS/cm |
|
pH |
8.5 |
In the Table 4, the abbreviations represent:
(1) Max: the largest value in the analysis results of the chemical parameter study.
(2) Min: the smallest value in the analysis results of the chemical parameter study.
(3) Mean= $=\mu$: arithmetic mean Eq. (1), for the current study (xi: denotes a value of the statistical series of samples).
$\mu=\frac{x_1+x_2++\cdots+x_n}{N}=\frac{\sum_{i=1}^n x_i}{N}$ (1)
(4) To calculate the standard deviation, we proceed as follows:
$\left|x_i-\mu\right|^2$ (2)
$\sum_{i=1}^n\left|x_i-\mu\right|^2$ (3)
$\frac{\sum_{i=1}^n\left|x_i-\mu\right|^2}{N-1}$ (4)
$\sigma=\sqrt{\frac{\sum_{i=1}^n\left|x_i-\mu\right|^2}{N-1}}$ (5)
(5)
Variance: $\sigma^2$ (6)
(6) Standard Error: it is the ratio between the standard deviation and the square root of height of sample (n), it is given by the following Eq. (7):
$E_s=\frac{\sigma}{\sqrt{n}}$ (7)
The results of the analysis of physical-chemical parameters of groundwater in the study area (Table 2) show values of electrical conductivity oscillating between 1.97 ms/cm and 2.68 ms/cm with a very low standard deviation of about 0.26. Its variation is related to the nature of dissolved salts and their concentration. The Ca+2 contents are included between 58 mg/l as the minimum value, they will reach the maximum value of 147,5 mg/l. The maximum content of Mg+2 is 158 mg/l, and the minimum concentration is 30.2 mg/l. The maximum concentration of Na+ in our study is between 80.78 and 237 mg/l with a significant standard deviation of about 57.87 mg/l, and the maximum content of K+ is 11 mg/l, the minimum concentration is 3.69 mg/l. The maximum Cl- measurement is 3 83.4 mg/l, and the minimum concentration is 230 mg/l. SO4- values range from 230.57 mg/l to 495 mg/l. Concentrations of the NO3- are low, ranging from 0.18 mg/l to 85 mg/l with a standard deviation of about 34.87 mg/l.
Table 4. The physical and chemical parameters of the water in the study area
|
Parameters |
Somme |
Min |
Max |
Mean |
Standard Deviation |
Variance |
Standard Error |
|
PH |
57.66 |
6.85 |
7.52 |
7.21 |
0.26 |
0.07 |
0.09 |
|
Cond |
17.91 |
1.97 |
2.68 |
2.24 |
0.26 |
0.07 |
0.09 |
|
RS |
9527.00 |
575 |
1700 |
1190.88 |
398.79 |
159031.84 |
140.99 |
|
Ca++ |
817.91 |
58 |
147.5 |
102.24 |
30.23 |
913.77 |
10.69 |
|
Mg++ |
764.74 |
30.2 |
158 |
95.59 |
54.72 |
2994.76 |
19.35 |
|
Na+ |
1298.71 |
80.78 |
237 |
162.34 |
57.87 |
3349.43 |
20.46 |
|
K+ |
49.85 |
3.69 |
11 |
6.23 |
2.39 |
5.70 |
0.84 |
|
Cl- |
2281.65 |
230 |
383.4 |
285.21 |
62.17 |
3864.75 |
21.98 |
|
SO4-- |
2873.39 |
230.57 |
495 |
359.17 |
87.66 |
7684.36 |
30.99 |
|
NO3 |
438.93 |
0.18 |
85 |
54.87 |
34.87 |
1216.13 |
12.33 |
|
HCO3 |
2539 |
241 |
365 |
317.38 |
39.18 |
1535.13 |
13.85 |
Chemical facies: The main objective of a graphic representation is to allow a quick approach to analytical results in order to easily characterize a water, to follow its evolution and to compare it to other waters of different physico-chemical compositions, and belonging to the same geological context.
Piper diagram: the Piper diagram makes it possible to graphically represent the hydrochemical facies [27]. It is composed of two triangles representing the distribution of anions and those of cations, respectively, and a diamond representing the synthetic distribution of major ions. In this diamond, the higher pole corresponds to 100% sulphates, chlorides, 100% calcium, and magnesium, the low pole representing 100% carbonate and bicarbonate and 100% sodium and potassium. Thus, in this diagram, calcium bicarbonate water would be located at the left pole of the diamond, while sodium chloride water would be located at the right pole (Figure 5). The superposition of several analyzes on the same diagram makes it possible to compare their hydrochemical facies shows that the majority of the samples coincide on the poles characterizing.
The representation of the analysis results of the water sampled on the Piper diagram (Figure 5) gives two chemical facies:
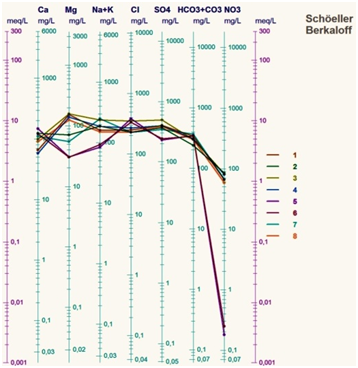
The BERKALOFF-SCHOELLER: This logarithmic scale diagram [25], makes it possible to distinguish two chemical facies and confirm what has already been found by the Piper diagram, of which we have noted that the dominant elements: SO4-2, Mg+2, Cl-, Na+ While the predominant chemical facies is of the: Sulfated calcium, Sulfated magnesium. diagram (Figure 6) shows that the waters of the study area of the Hamadinne aquifer are indicated by acceptable potability.
We know that the chemical characteristics of groundwater are almost always influenced by the physicochemical nature of the terrain constituting their aquifers (continental Tertiary). And depend in the first place on the lithological nature of the hydrogeological reservoir. In addition, the circulation velocity in the aquifer is an important factor, according to which the water and soil contacts can be short or long, reducing or increasing the importance of ionic exchanges between the water and the land which contains them, moreover we know that the permeability of an aquifer is an important factor acting on the circulation speed of the contained water table following its slope.
Figure 5. Piper diagram
Figure 6. Berkaloff-schoeller diagram
In order to carry out a study relating to the study area of the Tindouf region, we tried to delimit to our extent the maximum of drillings and water wells having a good significant distribution. Some measurements and physicochemical analyzes in the laboratory have been carried out.
Computer programs were used to represent the parameters and characterize the waters of this region.
The aquifers of interest in the basin of the studied area are the limestones constituting the Infracambrian aquifer, the sandstones and quartzites constituting the Upper Ordovician aquifer, the fine to coarse sandstones constituting the Lower Devonian aquifer, the limestones and dolomites constituting the Visa En-Terminal, and the superficial deposits constituting the Hamadinne tablecloth.
From the piezometric map produced, it can be said that the waters of the study area converge downstream towards the depression of the Sebkha of Tindouf, as the main flow direction.
The overall underground flow is from the NW to the SE in the direction of the overall loss of reservoir land (from the hamada to the Sebkha of Tindouf) and the streamlines show that the drained water comes from the northern flanks. The thickness of the continental Tertiary formation varies from north to south and from east to west, according to drilling data its thickness oscillates between 69 m and 100 m.
The piezometric levels of the study area vary from 2.60 m to 31.60 m. Drilling flow rates are low, around 0.5 to 13 l/s.
The piezometric depression observed in the study area is due to the irrational exploitation of this resource at the level of two agricultural perimeters Grarret el Harth and Oued m'Haya.
The results of physicochemical analyzes show that the aquifer waters of the region are characterized by a neutral pH.
Compared to Algerian drinking standards, the water remains within the standards with regard to cations and anions. Two chemical facies predominate there, the calcium sulfate facies and the magnesium sulfate facies. So, from all the classifications used in our study, we can confirm the type and quality of water in this region.
This important water resource is in high demand to meet water needs for human consumption and irrigation. It also constitutes a determining factor for economic and social development in the region.
Thanks to the results obtained in this study, we see that it is scientifically necessary to continue this type of research, and on this basis, we will be using resistivity methods in future research.
[1] Joly, F. (2006). Les eaux sauvages des régions arides. Notions de base sur l’hydrologie des déserts. Géomorphologie: Relief, Processus, Environnement, 12(4). https://doi.org/10.4000/geomorphologie.93
[2] Mohamed, E. (2017). Problème de gestions des ressources en eau en zones arides.
[3] Kumar, A., Taxak, A.K., Mishra, S., Pandey, R. (2021). Long term trend analysis and suitability of water quality of River Ganga at Himalayan hills of Uttarakhand, India. Environmental Technology & Innovation, 22: 101405. https://doi.org/10.1016/j.eti.2021.101405
[4] Boote, D.R., Clark-Lowes, D.D., Traut, M.W. (1998). Palaeozoic petroleum systems of North Africa. Geological Society, London, Special Publications, 132(1): 7-68. https://doi.org/10.1144/GSL.SP.1998.132.01.02
[5] Gevin, P. (1960). Études et reconnaissances géologiques sur l'axe cristallin Yetti-Eglab et ses bordures sédimentaires: Par pierre gevin.... bordures sédimentaires. Service de la Carte Géologique de L'ALGÉRIE.
[6] Messaoudi, H. (2008). Lithostratigraphie, paléontologie, biostratigraphie et environnements sédimentaires dans les terrains du Dévonien Inférieur et Moyen de Gara Djebilet. Bassin de Tindouf.
[7] Mezouh Mustapha. (2021). Etude des dangers de gisement de calcaire à Oum el Assel Tindouf.
[8] Michel, L. (2009). Transport en fracture et interaction avec la matrice: Une expérience analogique. Doctoral Dissertation, Université Rennes 1.
[9] Mimouni. Y., Yahiaoui A. (2020). Les grands Traits hydrogéologiques du bassin de Tindouf Thèse Master, p. 100.
[10] A.N.R.H. (1994). Etude hydrogéologique de la région de Tindouf et environ, synthèse hydrogéologique et étude d’implantation de forage.
[11] Amrane, T., Ayad, A. (2011). Rapport de synthèse géologie, hydrogéologie, prospections géophysique, travaux de forages et piézomètres du bassin de Tindouf. Direction Hydraulique-Service Exploitation, p. 12.
[12] Dahali, S. (2013). Etude hydrogéologique et hydrochimique de la nappe du continentale intercalaire de la région de Touat (wilaya d’Adrar). Doctoral Dissertation.
[13] Geosysteme Consult. (2013). Diagnostic écologique de l’arganeraie de Tindouf. Ropport de Syntése Final, p. 248.
[14] Gevin, P. (1958). Notice explicative des cartes géologiques au 500.000 e: Eglab, Tindouf.
[15] Hamouda, M., Sahari, A. (2013). Contribution à l’étude hydrogéologique du champ captant Hassi Abdellah. Viséen Supérieur, p. 27.
[16] Silmanou, F., Amrane, T. (2004). Rapport de fin de travaux du forage de reconnaissance profond Bougurefa et Hassi Abdellah.
[17] DRE Tindouf. (2015). Note de synthèse sur les ressources en eau de la région de Tindouf, p. 31.
[18] ANRH Agence Nationale des Ressources Hydriques. (2010). DRSO AdrarRapport sur la qualité des eaux de la wilaya de Tindouf.
[19] Sonarem. (1976). Etude hydrogéologie de la région de Tindouf. Idrotecnico Rapport Final.
[20] WHO. (2004). Directives pour la qualité de l’eau de boisson, Vol 1. Recommendations, 3ème édition, OMS, Genève. http://www.who, int/entity/water_sanitation.
[21] Rodier, J. (1984). L’analyse de l’eau, 7èmeédition DUNOD, p 1353.
[22] Kharroubi, M., Bouselsal, B., Hadj Said, S. (2019). Contribution à l’étude hydrogéologique de l’aquifère du Complexe Terminal de la cuvette d’Ouargla.
[23] Glynn, P.D., Plummer L.N. (2005). Geochemistry and the understanding of groundwater systems. Hydrogeology Journal, 13: 263-287.
[24] Aboubakar, M. (2012). Caractérisation d'un système aquifère volcanique par approche couplée hydrogéochimique et modélisation numérique. Exemple de L'aquifère des Basaltes de Dalha, Sud-Ouest de la République de Djibouti. Doctoral Dissertation, Poitiers.
[25] Schoeller, H. (1962). Les eaux souterraines. Hydrologie dynamique et chimique. Exploitation et Evaluation des Ressources. Edition Masson. Paris.
[26] Chachoua, M., Kial, R., Boulal, A. (2021). Comparaison de qualité des eaux de foggara dans la région adrar etude des analyses physico-chimiques des eaux. Doctoral Dissertation, Universite Ahmed Draia-ADRAR.
[27] Piper, A.M. (1944). Graphical interpretation of water analysis. Transactions of the American Geophysical Union, 25: 914-923