Anis Ali*![]() | Nadeem Fatima
| Nadeem Fatima![]() | Basel Jamal Abdel Rahman Ali
| Basel Jamal Abdel Rahman Ali![]() | Firoz Husain
| Firoz Husain![]()
© 2023 IIETA. This article is published by IIETA and is licensed under the CC BY 4.0 license (http://creativecommons.org/licenses/by/4.0/).
OPEN ACCESS
Nowadays, foreign trade plays an important role in the development of the economy and involves the imports, exports, and re-exports of products. The composition of foreign trade, i.e., imports, exports, and re-exports, varies from nation to nation according to their needs and requirements for products, ultimately affecting the economy. This research aims to determine the effects of international trade on the economy of Saudi Arabia, as well as the reciprocal movement of exports, imports, and components of exports and imports. Foreign trade data is taken from the website of SAMA for the period 2002 to 2021. To determine data variability, mean, standard deviation, and coefficient of variation are utilized. To determine the growth trend, the statistically significant difference between the groups of variables, and the substantially different groups, respectively, index numbers, ANOVA, and post Hoc analysis were used. The study's findings indicate that there is a co-movement relation between Saudi Arabia's exports, imports, and GDP over time. The growth rate of non-mineral items in export components differs significantly from that of articles made of basic metals, machinery, mechanical appliances, electrical equipment, and parts thereof in import components. Based on the results, it is possible to increase non-mineral product exports while decreasing imports of machinery, electrical equipment, appliances, and components thereof. This would help the Saudi economy expand more quickly. The study's findings should benefit academics, researchers, and decision-makers in government policy.
imports, exports, GDP, growth trend, post Hoc analysis, Saudi Arabia, co-variability
Foreign trade of goods and services is beneficial for the buyer (importer) and the seller (exporter) due to the availability of products at lower prices for buyers and the selling of products at higher prices than the native prices of products [1]. Based on business activities or the movement of products, foreign trade can be separated into three classifications for example Imports, Exports, and Re-exports. Exports are the sales of goods and services to other countries, whereas imports are the acquisition of commodities and services from other countries. Re-exporting is the process of importing products from one country and exporting them to another. The nation's imports and exports are advantageous for the economy in a variety of ways. The ability to specialize in a particular area of production or service provision is made possible by international trade, which also increases revenue and facilitates the disposal of surplus commodities and services. Exports also lessen domestic rivalry and provide income through currency exchange rates. Additionally, it expands the market for goods and services, builds international ties, and improves reputation [2]. Also, Foreign trade has drawbacks like intellectual property theft, higher shipping expenses, and linguistic and cultural difficulties. The holy cities of Makah and Medina as well as Saudi Arabia's natural riches are highly recognized around the world. Saudi Arabia sustains its economy by being one of the biggest exporters of mineral goods. That Saudi Arabia's exports and imports are volatile is clear from last year’s data.
It is evident from Table 1 that the fluctuations in the exports and imports affect the economy of Saudi Arabia. Saudi Arabia sends out mineral items like chemical products, foodstuffs, plastic items, articles of base metals, hardware and devices, electrical machines, different products, and re-exports. While imports incorporate mineral and chemical items; animals; plastic and elastic materials; readymade drinks spirits vinegar, and tobacco; artificial resins, bags, fur skins articles, wooden and paper materials; ceramic products glass and glassware; textiles, footwear, headgear, umbrellas, sunshade whips, watches, musical instruments and parts thereof; artificial flowers; precious stones jewelry; base metals and heavy machinery, mechanical appliances electrical equipment and parts thereof; transport equipment; medical and surgical equipment; arms and ammunition; antiques and other manufactured items. In Saudi Arabia, the list of imported goods is far lengthier than the list of exported goods. In recent years, Saudi Arabia's exports have had a significant downward trend whereas its imports have experienced a much lesser negative trend. It's critical to comprehend how strongly exports, imports, and GDP are correlated. Additionally, it is crucial to investigate the influence and contribution of factors related to imports and exports on the economy of Saudi Arabia.
Table 1. Growth of exports, imports and GDP of Saudi Arabia
|
Years |
2015 |
2016 |
2017 |
2018 |
2019 |
2020 |
2021 |
|
Exports |
763313 |
688424 |
831882 |
1103900 |
981012 |
651952 |
1035672 |
|
+/-(%)from Pre. Year |
-40.6 |
-9.8 |
20.8 |
32.7 |
-11.1 |
-33.5 |
58.9 |
|
Imports |
655033 |
525637 |
504440 |
513993 |
574361 |
517492 |
573186 |
|
+/-(%)from Pre. Year |
0.5 |
-19.8 |
-4 |
1.9 |
11.7 |
-9.9 |
10.8 |
|
GDP |
2453512 |
2418508 |
2582198 |
3062170 |
3013561 |
2637629 |
3125780 |
|
+/-(%)from Pre. Year |
-13.5 |
-1.4 |
6.8 |
18.6 |
-1.6 |
-12.5 |
18.5 |
Source: Exports, Imports & GDP values available on https://www.sama.gov.sa/en-us/economicreports/pages/database.aspx
Imports and exports are interrelated and affect the economy and financial development of the nation. Bakari [3] discovered that while short-term imports have an impact on financial development, long-term domestic investment and exports harm Egypt's financial development. According to Bakari and Krit [4] research, exports have a beneficial influence on the economy whereas imports have a negative one. Additionally, he discovered that exports govern imports while imports do not affect exports. Bakari and Mabrouki [5] focused on Panama's imports, exports, and gross domestic product from 1980 to 2015 and found that there is no relationship between these variables and GDP, contrarily. They also noted that imports and exports are Panama's primary drivers of economic growth. While, according to Ahmad et al. [6], exports have a favorable impact on economic expansion. The consumer price index, trade terms, and other business circumstances all have a detrimental impact on economic growth. They discovered a modest correlation between GDP, imports, and exports. The Bangladeshi economy is governed favorably by exports and adversely by imports. According to Faisal et al. [7], export growth controls the economy. While import has become remarkably minor over time and has no meaningful role in financial development. They said that since oil is Saudi Arabia's main source of income when it comes to oil exports to other countries, the governmental authorities should concentrate and invest more in non-oil sectors. The bidirectional relationship between exports and financial growth was discovered by Guntukula [8], who suggested sending out development for the economically viable development of the country. Sultan and Haque [9] noted that imports only serve to meet a customer's needs and do not contribute to the Saudi Arabian economy, where oil is the main driver of economic growth. Similar to a country that depends heavily on oil, trade is more important than imports. Exports have a favorable impact on Saudi Arabia's financial development. In the monetary growth of emerging nations, Shkolnyk and Koilo [10] identified the successful system execution of public duties to the executives. From 1975 until 2010, he focused on the contribution of oil and non-oil commodities to the economy. They noted that oil and non-oil exports are strongly and fundamentally related to the Syrian Gross Domestic Product. Oil and non-oil exports are correlated with GDP in the near term. Gross domestic product and non-oil exports have a two-way relationship, but oil products and GDP have a one-way link. They suggested increasing non-oil exports to effectively manage the economy. From 1991 to 2016, Rentala and Nandru [11] focused on India's imports, exports, and gross domestic product to identify a causal relationship between commodities and GDP. Additionally, they discovered the reasons for and connections between India's imports and exports. To boost the economy and the rate of monetary development, several advised focusing only on the exports base economy. The interrelationship between exports, imports, and financial development was discovered by Miyan and Biplob [12]. Exports affect monetary development in the short term, while financial development improves imports. Okyere and Liu [13] studied the impact of imports on Ghana's GDP. They found that there is a causal relationship between imports and GDP, but the beneficial impact of exports is not causal. Reddy [14] focused on the relationship between exports, imports, and monetary development in India from 1980 to 2019 and identified a significant long-term relationship between these three variables. All exports, imports, and monetary growth are interconnected in one direction. He finally came to the conclusion that imports and exports support India's economic growth. Habanabakize [15] found that since rates are high during the initial stages of a growing economy, prolonged monetary or financial development affects more imports than exports. As a result, consumers prefer importing goods to exporting them. Waheed et al. [16] provided evidence of the improvement of the tourism sector and environmentally friendly energy for the growth of Saudi Arabia's economy to become independent of oil exports. According to Aljebrin [17], Saudi Arabia's non-oil regions are contributing to a sustainable economy. For the government to maintain strong economic growth, it has to focus more on collaborating with both oil- and non-oil-producing regions. According to Isaiah Zayone et al. [18], Angola's non-oil region significantly and positively affected financial development. In any event, the non-oil region has less of an impact on financial growth than the oil does. This may be a result of Angola's significant foundational progress and adoption of the necessary arrangements. The swapping scale was discovered by Nguyen et al. [19] as a tool to reduce imports and increase exports. They mainly discovered that an exchange war plays a large role in increasing exports and the number of imports between two countries, however, the exchange rate doesn't play a significant role in imports and exports. It is clear from the research mentioned above that the exports, imports, and the country's GDP are causally related. Shadab [20] identified a significant link between imports, export growth, and financial development in the UAE. Additionally, he confirmed that there is a one-way relationship between export growth and financial development. He discovered that the UAE's economy is improving financially and transitioning from an oil-based economy to a non-oil economy. According to Okorie and Nwachukwu [21], real exports have a positive and fairly substantial impact on real gross domestic products. They suggested formalizing and deploying planned efforts to obtain appropriate financial development. Islam et al. [22] emphasized that the market for foods produced on a farm harms the country's economic growth since farmers have few jobs available to them. The government should support farmers by providing them with low-interest loans for rural projects, especially those involving vegetables and organic goods. According to a study by Hasan et al. [23], bad impacts on financial development eventually turn out to be advantageous. The influence of monetary development is persistent and has impartial good benefits. Similar to how the good aspects of the oil charge remain neutral, the oil passage's negative effects on the economy are negative. They advocated expanding the country's product base and developing non-oil exports. In previous studies, it is concluded that exports and imports support the economic growth of the nation while the contribution of the imports is negligible but only fulfills the needs of the customers’. However, there is no study that explains the relational co-variability of the export and import components with Saudi Arabia's GDP. The following research framework (Figure 1) is applied to get the impact of the exports and imports and their components on the GDP and mutual co-movement.
Figure 1. Research design to study the co-movement and governance of exports, imports and GDP
To investigate the co-movement of exports, imports, and their components with Saudi Arabia's GDP, the following hypothesis might be put out in light of the aforementioned research design.
H01: There are no co-variability of exports with the GDP of Saudi Arabia.
H02: There are no co-variability of imports with the GDP of Saudi Arabia.
H03: There are no co-variability of components of exports with the GDP of Saudi Arabia.
H04: There are no co-variability of components of imports with the GDP of Saudi Arabia.
The study's sole source of secondary data was the SAMA (Saudi Arabian Monetary Agency) website. Exports, imports, and GDP (Gross Domestic Product data) from 2002 to 2021 were examined using statistical approaches to achieve the research aim and objectives. In order to examine their proportionate connection, the weighting of the absolute variables (exports, imports, and their components) in the context of the GDP is determined. With fixed base index numbers, mobility over time is calculated [24].
FBI (Fixed Base Index Numbers) $=\frac{v_{\mathrm{cy}}}{\mathrm{v}_{\mathrm{By}}} * 100$; (1)
To get the regularity in the variables’ capacity to vary, Standard Deviation and Coefficient of Variation (CV) were calculated.
$C V($ Coefficient of Variation $)=\frac{\sigma}{\overline{\mathrm{x}}}$; (2)
Absolute differences and co-variability, as well as growth patterns over time, are revealed via stacked column and line charts.
ANOVA was used to determine the significant mean differences between the variables of exports, imports, and their constituent parts, as well as GDP.
ANOVA (Analysis of Variance) $=\mathrm{F}=\frac{B s s / d f 1}{W s s / d f 2} \;\;$; While, $\mathrm{F} \geq \mathrm{F} \propto$, Reject $\mathrm{H} 0$; (3)
The sum of squares between samples (Bss/df1) and the sum of squares within samples (Wss/df2) are divided by degree of freedom 1 and degree of freedom 2, respectively, where F is the Fisher's ratio.
To determine the significant mean performance differences between the groups, a post Hoc analysis test is used. Post-hoc testing is appropriate when the p-value < α. All of the groups are compared to determine their respective significant differences. The following formula is used to determine how many combinations there are between two groups [25].
K (k-1)/2; (4)
The number of groups included in the analysis of statistically significant mean differences is K. The Bonferroni corrected α (α/k) is compared with the T-test (p-value) between the various combinations of a couple of groups. There is a significant mean difference between the two groups when p-value < post Hoc (Bonferroni corrected α) is determined. For study reasons, the imports of Saudi Arabia may be divided into three groups: i.e., (1) transportation equipment; (2) base metal items, machinery, mechanical appliances, and components thereof; as well as (3) other imports. Also, Saudi Arabia's exports are divided into two groups (1) exports of mineral products and (2) exports of non-mineral commodities.
There are three forms of co-variability analyses and interpretations for GDP, exports, and imports.
4.1 Co-movability of imports, exports, and GDP
The co-integration or mutual movement of exports, imports, and GDP is referred to as co-variability [24]. The GDP, exports, and imports are measured concerning each other using fixed base index numbers (FBI). In the FBI, asymmetry denotes a lack of correlation or a weak association between the variables, whereas symmetry denotes a substantial co-movement.
Table 2 makes it obvious that the contribution of exported goods is nearly double (42%) as that of imported goods (20.48%). The exports, imports, and GDP of Saudi Arabia are volatile, with a CV of 0.38 for exports, 0.39 for imports, and 0.37 for GDP. However, given that the FBI's mean is more than three times that of the base year's FBI, the movability of all variables is positive.
Table 2. Co-movability of imports, exports and GDP of Saudi Arabia
|
Years |
Imports |
FBI |
Exports |
FBI |
GDP |
FBI |
|
2002 |
121088 |
100 |
271741 |
100 |
711022 |
100 |
|
2003 |
156391 |
129 |
349664 |
129 |
809279 |
114 |
|
2004 |
177659 |
147 |
472491 |
174 |
970283 |
136 |
|
2005 |
222985 |
184 |
677144 |
249 |
1230771 |
173 |
|
2006 |
261402 |
216 |
791339 |
291 |
1411491 |
199 |
|
2007 |
338088 |
279 |
874403 |
322 |
1558827 |
219 |
|
2008 |
431753 |
357 |
1175482 |
433 |
1949238 |
274 |
|
2009 |
358290 |
296 |
721109 |
265 |
1609117 |
226 |
|
2010 |
400736 |
331 |
941785 |
347 |
1980777 |
279 |
|
2011 |
493449 |
408 |
1367620 |
503 |
2517146 |
354 |
|
2012 |
583473 |
482 |
1456502 |
536 |
2759906 |
388 |
|
2013 |
630582 |
521 |
1409524 |
519 |
2799927 |
394 |
|
2014 |
651876 |
538 |
1284122 |
473 |
2836314 |
399 |
|
2015 |
655033 |
541 |
763313 |
281 |
2453512 |
345 |
|
2016 |
525637 |
434 |
688424 |
253 |
2418508 |
340 |
|
2017 |
504440 |
417 |
831882 |
306 |
2582198 |
363 |
|
2018 |
513993 |
424 |
1103900 |
406 |
3062170 |
431 |
|
2019 |
574361 |
474 |
981012 |
361 |
3013561 |
424 |
|
2020 |
517492 |
427 |
651952 |
240 |
2637629 |
371 |
|
2021 |
573186 |
473 |
1035672 |
381 |
3125780 |
440 |
|
Mean (% of GDP) |
434596 |
359 |
892454(42%) |
328 |
2121873(100%) |
298 |
|
-20.48% |
||||||
|
S.D. |
|
141 |
|
125 |
|
111 |
|
CV |
|
0.39 |
|
0.38 |
|
0.37 |
Source: Exports, imports & GDP values available on https://www.sama.gov.sa/en-us/economicreports/pages/database.aspx
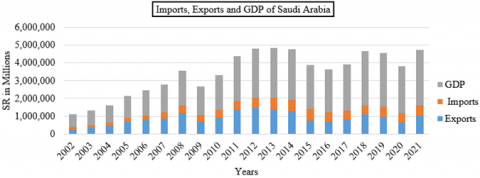
Figure 2. Imports, exports and GDP of Saudi Arabia
Source: Exports, imports & GDP values available on https://www.sama.gov.sa/en-us/economicreports/pages/database.aspx
Figure 3. Growth trend of exports, imports and GDP of Saudi Arabia
Source: Fixed base numbers values given in the Table 2
Table 3. ANOVA of growth exports, imports and GDP of Saudi Arabia
|
Source of Variation |
SS |
df |
MS |
F |
P-value |
F critical value |
|
Between Groups |
36583.1055 |
2 |
18291.5527 |
1.144953 |
0.32544 |
3.15884 |
|
Within Groups |
910620.792 |
57 |
15975.8033 |
|||
|
Total |
947203.898 |
59 |
|
|
|
|
Source: Fixed base numbers values given in the Table 2
Table 4. Co-movability of components of exports and GDP of Saudi Arabia
|
Mineral Products (A) |
FBI (a) |
Non-Mineral products (B) |
FBI (b) |
GDP (C) |
FBI (c) |
|
|
2002 |
239973 |
100 |
31768 |
100 |
711022.2 |
100 |
|
2003 |
308993 |
129 |
40671 |
128 |
809278.7 |
114 |
|
2004 |
415696 |
173 |
56795 |
179 |
970283.5 |
136 |
|
2005 |
606371 |
253 |
70773 |
223 |
1230771 |
173 |
|
2006 |
706486 |
294 |
84853 |
267 |
1411491 |
199 |
|
2007 |
771107 |
321 |
103296 |
325 |
1558827 |
219 |
|
2008 |
1055300 |
440 |
120182 |
378 |
1949238 |
274 |
|
2009 |
612344 |
255 |
108765 |
342 |
1609117 |
226 |
|
2010 |
808220 |
337 |
133565 |
420 |
1980777 |
279 |
|
2011 |
1192116 |
497 |
175504 |
552 |
2517146 |
354 |
|
2012 |
1266354 |
528 |
190148 |
599 |
2759906 |
388 |
|
2013 |
1208154 |
503 |
201370 |
634 |
2799927 |
394 |
|
2014 |
1068088 |
445 |
216034 |
680 |
2836314 |
399 |
|
2015 |
574677.2 |
239 |
188635.8 |
594 |
2453512 |
345 |
|
2016 |
512216 |
213 |
176208 |
555 |
2418508 |
340 |
|
2017 |
640010 |
267 |
191872.2 |
604 |
2582198 |
363 |
|
2018 |
871775.8 |
363 |
232124.7 |
731 |
3062170 |
431 |
|
2019 |
754833 |
315 |
226179 |
712 |
3013561 |
424 |
|
2020 |
450951 |
188 |
201001 |
633 |
2637629 |
371 |
|
2021 |
762416 |
318 |
273256 |
860 |
3125780 |
440 |
|
Mean (% of GDP) |
741304.1 (35%) |
309 |
151150 (7%) |
476 |
2121873 (100%) |
298 |
|
S.D. |
124 |
221 |
100 |
111 |
||
|
CV |
|
0.4 |
|
0.46 |
|
0.37 |
Source: Exports, imports & GDP values available on https://www.sama.gov.sa/en-us/economicreports/pages/database.aspx
Figure 4. Mineral and non-mineral exports & GDP of Saudi Arabia
Source: Exports, imports & GDP values available on https://www.sama.gov.sa/en-us/economicreports/pages/database.aspx
Figure 5. Growth trend of mineral and non-mineral exports and GDP Saudi Arabia
Source: Fixed base numbers values given in the Table 4
According to Figure 2, the absolute levels of Saudi Arabia's exports and GDP follow a snake-moving shape. The GDP of Saudi Arabia is directly and proportionately affected by exports. In terms of GDP, imports, and exports have different amounts but are not equal. As a result, in Saudi Arabia, exports and GDP move together more strongly than imports.
Figure 3 demonstrates the upward trend in Saudi Arabia's exports, imports, and GDP. Between 2002 and 2021, the growth rate of imports is higher than that of Saudi Arabia's GDP and exports. The movement of Saudi Arabia's GDP and exports coexist in harmony. Although not proportionally, changes in exports have a beneficial impact on the GDP. In contrast to imports and GDP, there is considerable variation in exports. However, the pattern indicates that Saudi Arabia's GDP and imports are both growing.
Table 3 shows that the increase of exports, imports, and GDP as the F (1.1449535) <F critical value (3.158843) or P-value (1.1449535)> Fα (0.05) shows no noticeable difference. Therefore, H01 and H02 are rejected.
4.2 Co-movability of components of exports and GDP
Co-integration or mutual movement of the variables is referred to as the co-variability of export components and GDP. Fixed base Index Numbers (FBI) gauge the relationship between changes in the export and GDP subcomponents. In the FBI, symmetry refers to considerable co-movement, whereas asymmetry denotes a lack of interaction or a poor relationship between the variables.
Table 4 makes it evident that the contribution of mineral exports is five times greater (35%) than that of non-mineral exports (7%). As the CV of the mineral exports (0.4), non-mineral exports (0.46), and GDP (0.37) is more than 0.30, there is movability in Saudi Arabia's GDP and non-mineral exports. Saudi Arabia's non-mineral exports, however, rose by an average of 5 times between 2002 and 2021, compared to a 3 times average rise in its mineral exports and GDP.
According to Figure 4, there is a spiral pattern in the absolute values of Saudi Arabia's GDP and mineral exports. The GDP of Saudi Arabia is directly and proportionately influenced by the export of minerals. The quantity of non-mineral goods varies, but not to the same extent as exports in terms of GDP. Therefore, there is a stronger correlation between Saudi Arabia's mineral exports and GDP than its non-mineral exports.
Figure 5 demonstrates the upward trend in Saudi Arabia's GDP, non-mineral exports, and mineral exports. Between 2002 and 2021, Saudi Arabia's non-mineral exports grew at a faster rate than its GDP and mineral exports. The co-movement of Saudi Arabia's mineral exports and GDP demonstrates symmetry. Compared to non-mineral exports and GDP, the volatility of mineral exports is greater. However, the pattern indicates that Saudi Arabia's GDP is growing more rapidly than its mineral exports.
Table 5. ANOVA of mineral and non-mineral exports and GDP of Saudi Arabia
|
Source of Variation |
SS |
df |
MS |
F |
P-value |
F crit |
|
Between Groups |
396125.5 |
2 |
198062.8 |
7.76008 |
0.00104 |
3.15884 |
|
Within Groups |
1454827 |
57 |
25523.29 |
|||
|
Total |
1850953 |
59 |
|
|
|
|
Source: Fixed base numbers values given in the Table 4
Table 6. Post Hoc test of mineral (a) and non-mineral (b) exports and GDP(c) of Saudi Arabia
|
Multiple Comparisons |
||||||
|
Dependent Variable: y Bonferroni |
||||||
|
(I) f |
(J) f |
Mean Difference (I-J) |
Std. Error |
Sig. |
95% Confidence Interval |
|
|
Lower Bound |
Upper Bound |
|||||
|
a |
b |
-166.90000* |
50.53514 |
.005 |
-291.5544 |
-42.2456 |
|
c |
10.45000 |
50.53514 |
a0 |
-114.2044 |
135.1044 |
|
|
b |
a |
166.90000* |
50.53514 |
.005 |
42.2456 |
291.5544 |
|
c |
177.35000* |
50.53514 |
.003 |
52.6956 |
30b44 |
|
|
c |
a |
-10.45000 |
50.53514 |
a0 |
-135.1044 |
114.2044 |
|
b |
-177.35000* |
50.53514 |
.003 |
-30b44 |
-52.6956 |
|
|
*. The mean difference is significant at the 0.05 level |
||||||
Source: Fixed base numbers values given in the Table 4
According to Table 5, the F (7.760081) > F critical value (3.158843) or P-value (0.001046) < Fα (0.05) indicates that there is a substantial difference between the growth of mineral and non-mineral exports and the GDP of Saudi Arabia. Post Hoc test is applied to know the differences of groups of growth rates of exports of mineral products, non-mineral products and GDP of Saudi Arabia.
The Post Hoc test is used in Table 6 to show that there is no significant difference between Saudi Arabia's mineral exports (a) and GDP (c). Although there is a large disparity in the mean differences between mineral exports (a) and non-mineral exports (b). The Saudi Arabian economy's GDP (c) and mineral exports (a) are related. H03 is therefore accepted.
4.3 Co-movability of components of imports and GDP
The co-variability of imports and GDP components refers to the co-integration or mutual movement of the variables. GDP and import component relationship fluctuations are measured by Fixed Base Index Numbers (FBI). In the FBI, symmetry denotes a substantial degree of co-movement, and asymmetry denotes a lack of or tenuous relationship between the variables.
Table 7 shows that from 2002 to 2021, average import items accounted for 20.48% of Saudi Arabia's GDP. Base metal products, machinery, mechanical appliances, electrical equipment, transportation equipment, and other imports account for, respectively, 7.33%, 3.61%, and 9.54% of Saudi Arabia's GDP. Base metals and articles of base metals, machinery, mechanical appliances, electrical equipment & parts thereof (CV=0.41), transport equipment (CV=0.36), other imports (CV=0.43), and Saudi Arabia's GDP (CV=0.37) all exhibit variation. However, the average growth of all components shows a growth that is 3 times that of the period from 2002 to 2021, and more than 4 times that of the average growth of products manufactured of basic metals, machinery, electrical equipment, and parts thereof. Thus, the Saudi Arabian GDP and all of its components have positive variability.
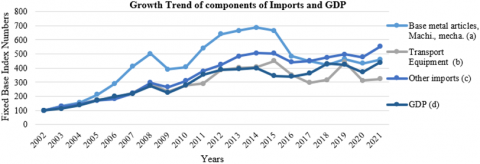
According to Figure 6, there is a spiral pattern in the combined absolute values of Saudi Arabia's import parts and GDP. Concerning Saudi Arabia's GDP, each import component is smaller. However, the components of Saudi Arabia's imports are affected by GDP changes. Consequently, between 2002 and 2021, Saudi Arabia's GDP and its import component moved in tandem.
The upward trend of Saudi Arabia's imports and GDP components is seen in Figure 7. Between 2002 and 2021, the growth rate of basic metal products, machinery, mechanical appliances, and electrical equipment and parts thereof is higher than Saudi Arabia's GDP and other important components. Both the GDP and other imports show symmetry. While transporting equipment is seen to move symmetrically with base metals, machinery, mechanical appliances, electrical equipment, and their parts. However, from 2002 to 2021, the pattern indicates an increase in Saudi Arabia's GDP and all of its important components.
Table 7. Co-movability of components of imports and GDP of Saudi Arabia
|
Years |
Base metal articles, Machi. Mecha. (A) |
FBI (a) |
Transport equipment (B) |
FBI (b) |
Other imports (C) |
FBI (c) |
GDP (D) |
FBI (d) |
|
2002 |
36555 |
100 |
26723 |
100 |
57810 |
100 |
711022 |
100 |
|
2003 |
48074 |
132 |
34144 |
128 |
74173 |
128 |
809279 |
114 |
|
2004 |
56533 |
155 |
38290 |
143 |
82836 |
143 |
970283 |
136 |
|
2005 |
77941 |
213 |
46704 |
175 |
98340 |
170 |
1230771 |
173 |
|
2006 |
105928 |
290 |
50453 |
189 |
105021 |
182 |
1411491 |
199 |
|
2007 |
150569 |
412 |
59440 |
222 |
128079 |
222 |
1558827 |
219 |
|
2008 |
183330 |
502 |
77620 |
290 |
170803 |
295 |
1949238 |
274 |
|
2009 |
142631 |
390 |
62287 |
233 |
153371 |
265 |
1609117 |
226 |
|
2010 |
148551 |
406 |
73628 |
276 |
178557 |
309 |
1980777 |
279 |
|
2011 |
198213 |
542 |
77141 |
289 |
218095 |
377 |
2517146 |
354 |
|
2012 |
234438 |
641 |
103544 |
387 |
245491 |
425 |
2759906 |
388 |
|
2013 |
243332 |
666 |
107552 |
402 |
279698 |
484 |
2799927 |
394 |
|
2014 |
250771 |
686 |
108610 |
406 |
292495 |
506 |
2836314 |
399 |
|
2015 |
242794 |
664 |
120516 |
451 |
291723 |
505 |
2453512 |
345 |
|
2016 |
176745 |
484 |
93925 |
351 |
254966 |
441 |
2418508 |
340 |
|
2017 |
163971 |
449 |
79397 |
297 |
261079 |
452 |
2582198 |
363 |
|
2018 |
155155 |
424 |
84652 |
317 |
274186 |
474 |
3062170 |
431 |
|
2019 |
169187 |
463 |
118264 |
443 |
286910 |
496 |
3013561 |
424 |
|
2020 |
158694 |
434 |
83009 |
311 |
275788 |
477 |
2637629 |
371 |
|
2021 |
168235 |
460 |
86201 |
323 |
318749 |
551 |
3125780 |
440 |
|
Mean (% of GDP) |
155582 (7.33%) |
426 |
76605 (3.61%) |
287 |
202408 (9.54%) |
350 |
2121873 (100%) |
298 |
|
S.D. |
176 |
104 |
150 |
100.00 |
111 |
|||
|
CV |
0.41 |
0.36 |
0.43 |
0.37 |
Source: Exports, imports & GDP values available on https://www.sama.gov.sa/en-us/economicreports/pages/database.aspx
Figure 6. Imports components and GDP of Saudi Arabia
Source: Exports, imports & GDP values available on https://www.sama.gov.sa/en-us/economicreports/pages/database.aspx
Figure 7. Growth trend of components of imports and GDP
Source: Fixed base numbers values given in the Table 7
Table 8. ANOVA of components of imports and GDP of Saudi Arabia
|
Source of Variation |
SS |
df |
MS |
F |
P-value |
F crit |
|
Between Groups |
240099.9 |
3 |
80033.3 |
4.18045 |
0.00855 |
2.72494 |
|
Within Groups |
1454992 |
76 |
19144.6 |
|||
|
Total |
1695092 |
79 |
Source: Fixed base numbers values given in the Table 7
Table 9. Post Hoc test of components of imports (a, b and c) and GDP (d) of Saudi Arabia
|
Multiple Comparisons |
||||||
|
Dependent Variable: y Bonferroni |
||||||
|
(I) f |
(J) f |
Mean Difference (I-J) |
Std. Error |
Sig. |
95% Confidence Interval |
|
|
Lower Bound |
Upper Bound |
|||||
|
a |
b |
139.00000* |
43.75220 |
.013 |
20.4722 |
257.5278 |
|
c |
75.55000 |
43.75220 |
.530 |
-42.9778 |
194.0778 |
|
|
d |
127.20000* |
43.75220 |
.029 |
8.6722 |
245.7278 |
|
|
b |
a |
-139.00000* |
43.75220 |
.013 |
-257.5278 |
-20.4722 |
|
c |
-63.45000 |
43.75220 |
.907 |
-181.9778 |
55.0778 |
|
|
d |
-11.80000 |
43.75220 |
1.000 |
-130.3278 |
106.7278 |
|
|
c |
a |
-75.55000 |
43.75220 |
.530 |
-194.0778 |
42.9778 |
|
b |
63.45000 |
43.75220 |
.907 |
-55.0778 |
181.9778 |
|
|
d |
51.65000 |
43.75220 |
1.000 |
-66.8778 |
170.1778 |
|
|
d |
a |
-127.20000* |
43.75220 |
.029 |
-245.7278 |
-8.6722 |
|
b |
11.80000 |
43.75220 |
1.000 |
-106.7278 |
130.3278 |
|
|
c |
-51.65000 |
43.75220 |
1.000 |
-170.1778 |
66.8778 |
|
|
*. The mean difference is significant at the 0.05 level. |
||||||
Source: Fixed base numbers values given in the Table 7
As shown in Table 8, the growth of Saudi Arabia's import component and GDP have significantly different rates of growth, as indicated by the F (4.18045) > F critical value (2.72494) or P-value (0.00855) < Fα (0.05).
Post Hoc test is applied to know the differences of groups of growth rates of components of imports of Saudi Arabia.
Articles made of basic metals, machinery, appliances, and electrical equipment (a) co-move with other imports, according to Table 9's Post Hoc test (c). Transport equipment (b), other imports (c), and Saudi Arabia's GDP (d) are all moving in tandem. Base metals and articles of base metal, machinery, mechanical appliances, electrical equipment, and parts thereof all grew more rapidly than transport equipment (FBI=287), other imports (FBI=350), and Saudi Arabia's GDP (FBI=298) combined (FBI=426). H04 is therefore accepted.
It is evident from the study and interpretations presented above that the GDP and exports of Saudi Arabia move in synchronization. Exports and GDP in Saudi Arabia move together more strongly than imports and GDP, comparably [13]. The symmetry between Saudi Arabia's exports, imports, and GDP is rising over time [12]. Exports boost GDP in the short term, and GDP controls imports, but not proportionally. In Saudi Arabia, mineral exports outweigh non-mineral exports by five times. The rise of non-mineral exports outweighs that of both the GDP and mineral exports, which both follow the GDP growth pattern. However, the GDP is not significantly impacted by non-mineral exports because their total volume is less than that of minerals. Long-term trends in GDP growth and mineral exports are comparable, although non-mineral export growth is faster. Therefore, non-mineral exports have a greater impact than mineral exports. However, it cannot raise the GDP due to a lesser contribution or lower absolute quantity. To increase the GDP, Saudi Arabia must increase its exports of goods other than minerals. In Saudi Arabia, the average growth rate of imports of basic metal products, machinery, mechanical appliances, electrical equipment, and components thereof is larger than that of imports of transport equipment and other goods. More than the imports of transportation equipment, basic metals, machinery, mechanical appliances, electrical equipment, and parts thereof are impacted by changes in the Saudi GDP. In contrast to basic metals, machinery, mechanical appliances, electrical equipment, and components thereof, there is a stronger correlation between GDP and transport equipment, other transportation, and these items. The average percentage of total imports other than basic metals, machinery, mechanical appliances, electrical equipment and its parts, and transport equipment is greater. Therefore, to reduce imports and build a stronger economy, the government must concentrate on other import-category products. Articles made of basic metals, machinery, appliances, and electrical equipment often see larger growth rates than exports of other categories. Controlling the basic metal products, machinery, appliances, and electrical equipment in Saudi Arabia is necessary to achieve GDP alignment. Due to the faster rate of growth and higher absolute quantity, Saudi Arabia's imports of basic metals, machinery, mechanical appliances, electrical equipment, and other imports must be taken into account.
It is concluded that there is co-variability of exports and imports with the GDP of Saudi Arabia. Analysis, interpretations, and arguments have led to the conclusion that Saudi Arabia's average exports exceed its average imports by more than two times. There is no co-variability of components of exports, and components of imports with the GDP of Saudi Arabia. Overall, there is no proportionate co-movement of all components of imports and exports and GDP while total exports and imports are co-variable with the GDP. This refers that the major components of exports and imports are co-variable with GDP. However, in Saudi Arabia, the average growth rate of imports is larger than the average growth rate of exports and the GDP. While imports are only moderately influenced by Saudi Arabia's GDP, exports immediately and favorably contribute to the country's GDP. Long-term trends show that Saudi Arabia's exports, imports, and GDP are all rising. The average export of minerals is five times more than the average export of non-mineral goods. However, non-mineral exports have a greater average growth rate than mineral exports. Therefore, the GDP of Saudi Arabia is gradually boosted by non-mineral exports rather than mineral exports. However, it cannot raise the GDP due to a lesser contribution or lower absolute quantity.
To increase the GDP, Saudi Arabia must increase its exports of goods other than minerals. Focusing on non-mineral exports is necessary to increase exports since their growth rate is greater than Saudi Arabia's GDP and exports of minerals. In Saudi Arabia, imports account for one-fifth of the country's GDP. Base metals and articles made of base metals, machinery, appliances, and electrical equipment and parts need to be restricted in Saudi Arabia since their average growth rate is larger than that of other imports like transport equipment. Transport equipment and other import categories move in line with Saudi Arabia's GDP, whereas Base Metals & Articles of Base Metals, Machinery, Mechanical Appliances, Electrical Equipment & Parts Thereof, and Other Imports have higher GDPs. To increase exports and match import movements with Saudi Arabia's GDP, the Saudi government must concentrate on increasing non-mineral items and restricting base metals, machinery, mechanical appliances, electrical equipment, and parts thereof exports. The study is based on the secondary data obtained from the SAMA website. There is a need for a detailed study of all components of exports, imports, and re-exports and their short-term and long-term impact on the GDP of Saudi Arabia.
This study is supported via funding from Prince sattam Bin Abdulaziz University project number (PSAU/2023/R/1444).
[1] Ali, B.J.A., Hasan, H., Oudat, M.S. (2021). Relationship among export, import and economic growth: Using co-integration analysis. Journal Psychology and Education, 58(1): 5126-5134. http://dx.doi.org/10.17762/pae.v58i1.2068
[2] Hasan, H., Ali, B.J. (2019). Investigating the relationship between inflation, trade openness, GDP and financial development in developing country: Using regression approach. IOSR Journal of Economics and Finance, 10(5): 44-49. https://www.iosrjournals.org/iosr-jef/papers/Vol10-Issue5/Series-5/G1005054449.pdf.
[3] Bakari, S. (2017). The relationship between export, import, domestic investment and economic growth in Egypt. Journal Empirical Analysis, Euro Economica, 36(2): 34-43.
[4] Bakari, S., Krit, M. (2017). The Nexus between exports, imports and economic growth: Evidence from Mauritania. International Journal of Economics and Empirical Research, 5(1): 10-17.
[5] Bakari, S., Mabrouki, M. (2017). Impact of exports and imports on economic growth: New evidence from Panama. Journal of Smart Economic Growth, 2(1): 67-79. https://www.ibcnetwork.org/gestion/uploads/publications/publication_330/ART2.pdf.
[6] Ahmad, D., Afzal, M., Khan, U.G. (2017). Impact of exports on economic growth empirical evidence of Pakistan. International Journal of Applied, 5(2): 1-9.
[7] Faisal, F., Türsoy, T., Reşatoğlu, N.G. (2017). Is export-led growth hypothesis exist in Saudi Arabia? Evidence from an ARDL bounds testing approach. Asian Journal of Economic Modelling, 5(1): 110-117. https://doi.org/10.18488/journal.8/2017.5.1/8.1.110.117
[8] Guntukula, R. (2018). Exports, imports and economic growth in India: Evidence from cointegration and causality analysis. Theoretical & Applied Economics, 25(2): 221-230. https://store.ectap.ro/articole/1340.pdf.
[9] Sultan, Z.A., Haque, M.I. (2018). Oil exports and economic growth: An empirical evidence from Saudi Arabia. International Journal of Energy Economics and Policy, 8(5): 281-287. https://www.econjournals.com/index.php/ijeep/article/view/6688.
[10] Shkolnyk, I., Koilo, V. (2018). The relationship between external debt and economic growth: Empirical evidence from Ukraine and other emerging economies. Investment Management and Financial Innovations, 15(1): 287-400. http://dx.doi.org/10.21511/imfi.15(1).2018.32
[11] Rentala, S., Nandru, P. (2019). Export performance of India and its impact on GDP during post economic-reforms period. SMS Journal of Entrepreneurship & Innovation, 5(2): 57-66. http://dx.doi.org/10.21844/smsjei.v5i02.15896
[12] Miyan, M.S., Biplob, M.N.K. (2019). Revisiting exports, imports and economic growth nexus: Empirical evidence from Bangladesh (1981-2017). Scientific Research Publishing Modern Economy, 10(2): 523-536. https://doi.org/10.4236/me.2019.102036
[13] Okyere, I., Liu, J. (2020). The impact of export and import to economic growth of Ghana. European Journal of Business and Management, 12(21): 130-138. http://dx.doi.org/10.7176/EJBM/12-21-15
[14] Reddy, K.K. (2020). Exports, imports and economic growth in India: An empirical analysis. Theoretical and Applied Economics, 27(4): 323-330.
[15] Habanabakize, T. (2020). The effect of economic growth and exchange rate on imports and exports: The South African post-2008 financial crisis case. International Journal of Economics and Finance Studies, 12(1): 223-238. https://doi.org/10.34109/ijefs.202012114
[16] Waheed, R., Sarwar, S., Dignah, A. (2020). The role of non-oil exports, tourism and renewable energy to achieve sustainable economic growth: What we learn from the experience of Saudi Arabia. Structural Change and Economic Dynamics, 55: 49-58. https://doi.org/10.1016/j.strueco.2020.06.005
[17] Aljebrin, M.A. (2020). Do non-oil exports facilitate economic growth in Saudi Arabia? Journal of Management Information & Decision Sciences, 23(s1): 450-476.
[18] Isaiah Zayone, T., Henneberry, S.R., Radmehr, R. (2020). Effects of agricultural, manufacturing, and mineral exports on Angola’s economic growth. Energies, 13(6): 1494. https://doi.org/10.3390/en13061494
[19] Nguyen, N.H., Nguyen, H.D., Vo, L.T.K., Tran, C.Q.K. (2021). The impact of exchange rate on exports and imports: Empirical evidence from Vietnam. The Journal of Asian Finance, Economics and Business, 8(5): 61-68.
[20] Shadab, S. (2021). The nexus between export diversification, imports, capital and economic growth in the United Arab Emirates: An empirical investigation. Cogent Economics & Finance, 9(1): 1914396. https://doi.org/10.1080/23322039.2021.1914396
[21] Okorie, G.C., Nwachukwu, N. (2022). Impact of fruits and vegetables export on economic growth in Nigeria (1981-2019). African Journal of Economics and Sustainable Development, 5(1): 47-58. http://eprints.gouni.edu.ng/3620/
[22] Islam, M.S., Alsaif, S.S., Alshammari, A.F. (2022). Export-growth nexus in the kingdom of Saudi Arabia: A nonlinear ARDL approach. The Singapore Economic Review, 1-17. https://doi.org/10.1142/S0217590822500199
[23] Hasan, H., Ali, B.J.A., Joseph, N., Oudat, M.S. (2021). An investigation on financial development, trade openness and economic growth: Var approach. Journal of Contemporary Issues in Business and Government, 27(2): 4289-4295. https://doi.org/10.47750/cibg.2021.27.02.454
[24] Ali, A., Ali, B. (2022). Disparity in total resources growth and its impact on the profitability: An analytical approach. International Journal of Sustainable Development and Planning, 17(5): 1441-1447. https://doi.org/10.18280/ijsdp.170508
[25] Rahman, A.R.M.M., Jalaluddin, I., Kasim, Z.M., Darmi, R. (2021). Attitudes towards learning english among the Aliya Madrasah students in Bangladesh. Indonesian Journal of Applied Linguistics, 11(2): 269-280. https://doi.org/10.17509/ijal.v11i2.34121