Rizki Puspita Dewanti | Edi Paryanto | Johan Alfian Pradana | Catur Harsito*
© 2022 IIETA. This article is published by IIETA and is licensed under the CC BY 4.0 license (http://creativecommons.org/licenses/by/4.0/).
OPEN ACCESS
The purpose of this study is to determine the location of the custom workshop business using the criteria of NPV, IRR, PBP, PI and B/C. This research method uses a field research model with the right procedure to use the net present value method, internal rate of return, payback period, profitability index and benefit cost ratio to determine the custome workshop business. The results of the criteria obtained are that NPV>0, IRR is 29.4%, PBP is 2.75 years, PI is 1.1.48 and B/C is 1.1. This level of achievement uses the world every day, there must be activities in the custome workshop to achieve the criteria. The criterion that becomes the dominant factor is the occurrence of an increase in the profitability index. This is a criterion that states there is an increase in the benefits of the specified investment value. What causes an increase in benefits is that assets and production facilities can experience functions that are more suitable for the way they are used.
B/C, costume, IRR, NPV, PBP, workshop
The business feasibility study is a conversation that deserves to be reviewed in more depth in the current era. The business feasibility study has concrete objectives, with the following: 1) profit as a measure of increasing profits; 2) business growth as a growth step from year to year as evidence of an increase from the previous year; and 3) increasing market share as a step to increase market share to compete with competitors. Business feasibility studies have an organized pace with achieving the targets and goals that have been planned. A business feasibility study determines that a business can reduce the risk of loss, prepare a planning model properly, plan work activities, facilitate control and monitoring activities. The components that become business feasibility studies play an important role covering aspects: market, financial, management, human resources, engineering and operations, business planning, environmental, legal, economic and social. Of these ten aspects, the discussion is the financial aspect.
The financial aspect deeply discusses business feasibility with the paremeter used including: net present value, internal rate of return, payback period and profitability index. These four aspects, become parameters of the success of a business can stand decently and sustainably. According to Pradana et al. [1], assess business feasibility studies with financial aspects with proof that they are feasible. This feasibility is with evidence of a future value higher than the initial investment value, the rate of return is more than the set interest rate, the return on investment period is faster than planning and the value of the business development benefits is greater than the investment used. The role of financial aspects to strengthen in determining business feasibility studies. The case we used in this study was a custome workshop. The custome workshop has activities about motor vehicle modification with a focus on spare parts modification. This custome workshop is located on Jl. Ir. Sutami, Sebelas Maret University area, Indonesia. Custome workshops are very prevalent in the area, causing this service to be in great demand, especially for actors who have hobbies or professions related to motor vehicle custome. The growth of vehicle customs is directly proportional to motorcycle events so that the demand for vehicle custome services is increasing. Vehicle custome services are a great opportunity, where it is necessary to know the feasibility side of the ongoing business. The obstacle that has been occurring in the custome workshop is that there is no known value of the increase in benefits based on the investment that has been used.
Daily custome workshop activities can reach a profit of more than 20% of the tariff set by the owner. Therefore, the great opportunity in establishing a custome workshop is an interesting topic to discuss. On the other hand, custom workshop service providers are not balanced with the level of needs of very enthusiastic customers. This problem requires an in-depth study of the financial aspect by determining the value of business feasibility using net present value, internal rate of return, payback period and profitability index [2-4]. The value of the investment has an influence on how much the price of the asset will be used for production. Assets require a depreciation assessment to determine depreciation costs at the facility. The greater the number of assets used, the greater the depreciation and investment value that must be budgeted [5]. Cash inflow is the gross receipt value of the proceeds from the sale of products. Cash inflow valuations can be recapitulated per month, as well as per year. Cash inflows will indirectly experience inflation. One of the causes of inflation is that the user needs in each period are not the same [5]. Cash out is all costs related to asset maintenance, experts, production materials, freelance labor and supporting costs in the process of accumulating cash out. Earning before tax serves to find out the cash value before being charged interest. The calculation uses the value of reducing cash inflows with cash out and minus depreciation. Tax is the value of the tax that needs to be paid to the government. This tax every business is different, as it is adapted to the conditions of the business itself. Tax value in terms of research [6], is 10% per annum. Earning after tax serves to determine the value of income after the value of earning before tax is reduced by Tax. This value component will form Net Cash Flow with earnings after tax value plus depreciation. Of all the components of the value will be used to form the calculation of the financial analysis. The calculation of financial value will refer to the criteria of Net Present Value (NPV), IRR (Internal Rate of Return), PBP (Pay Back Period) and PI (Profitability Index).
NPV assesses that cash flow in the future profit must be greater than the capital that has been used, IRR assesses the percentage of expected profit, PBP assesses the time of the capital turning point and PI assesses that the benefit ratio must be greater than capital and B/C i.e. assesses the benefits must be greater than the value of the investment. These criteria are used in assessing the financial feasibility of a business [7]. Business feasibility study as a form of opportunity analysis and providing anticipation of risks to running or stopping business [8]. Achievements in business feasibility are financial management decisions that are in control of the business owner himself [9]. The scope of business feasibility discussed is the financial aspect [10]. According to Gamma et al. [11], states that any form of business requires a financial assessment, in order to find out the picture of the business being carried out in the future period. Preliminary findings with evidence that the role of feasibility studies largely determines the sustainability of an ongoing business [2, 12-15]. On the other hand, a business feasibility study by applying the financial aspect. This means that it is a challenge for the sustainability of custom workshops in increasing the role of business feasibility that runs.
Findings [16], states that the sustainability of the business feasibility study as evidence of interest in building a more dynamic business with financial aspects. Financial analysis plays an important role in proving how much the feasibility value of an ongoing business is. This finding states that in making motor vehicle investments, it produces a financial aspect value that is in accordance with the provisions with the NPV value of >0, IRR > MARR, PP less than the planning target. From these findings, it can be used as evidence that financial interests can support fundamentally the business being run. Therefore, in this study, it aims to assess business feasibility with the financial aspects of custom workshops by reviewing the parameters of net present value, internal rate of return, payback period, profitability index and benefit cost ratio.
2.1 Financial viability
The evaluation of dominant financial aspects from NPV, IRR, PBP and PI [17]. Investing activities also need a knowledge to know the risks related to feasibility in establishing a business [18]. The stage of finding competing ideas provides advantages and adequate supporting resource [19]. The next step is an evaluation of finances [20]. The purpose of financial aspects is for financial analysis activities, cost needs analysis, profit and loss projections, balance sheet projections and, facility planning.
2.2 Demand forecasting
Demand forecasting is based on the time when the data is used in demand forecasting materials referring to data in the past. Types of forecasting are, Short-term forecasting with data duration of less than 3 months, medium-term forecasting with data duration of 3 to 18 months, and long-term forecasting with data duration of more than 18 months. Forecasting aims to estimate the future product demand. Data in the past is used in the form of mathematical models for this basis [21]. Forecasting demand uses linear trend regression analysis method. The modeling method of forecasting linear regression trends is Y=a+bx.
The design of this study is with a field research model by collaborating the net present value method, internal rate of return, payback period, profitability index and benefit cost ratio to determine the feasibility of the custom workshop business. The selection of field research models because it has advantages with strong evidence of field data processed with in-depth theoretical studies. The selection of this research model with the aim of finding new things in the strategy of increasing business feasibility in a sustainable manner.
This study used primary data using observation methods. The observations made were made by visiting the custome workshop with observations of activities and recaps of fixed cost data needed to cover business assets. These business assets are business locations and tools for custom spare parts activities. The next data is variable data on the sale of spare parts, wifi networks, workers' wages, electricity and water needs. The data of this study with a period of 12 months for the verification and validation process. The collected research data is used for data analysis techniques with the following stages:
(a) Depreciation Expenses uses the straight-line method and the formula is:
Depreciation $=\frac{\text { “Acquisition price }-\text { Residual value" }}{\text { “Economic age" }}$ (1)
(b) Demand Forecasting uses the linear regression trend formulas, they are:
$a=\frac{\sum Y_i}{n}$ (2)
$b=\frac{\sum X_i Y_i}{\sum X_I^2}$ (3)
After the values a and b are calculated, the linear trend values is:
Y=a+bX (4)
where, Y=trend value; a=intercept i.e. the value of Y, if the value X=0; b=the slope of trend line, i.e. the change of variable Y for each change of one unit in variable X; X=time period.
(c) The creation of Cash Flow uses following stages [22] below:
Earning Before Tax=(Cash In-Cash Out)–Depreciation (5)
Earning After Tax=Earning Before Tax–Tax (6)
Net Cash Flow=Earnings After Tax–Depreciation (7)
(d) Benefit Cost Ratio uses formula [23] below:
$B / C=\frac{B}{T C}$ (8)
where, B=Total Income (total cash flow benefit); TC=Total Cost of Production (total cash flow cost).
(e) Net Present Value (NPV) uses the formula [22]:
$N P V=\left(\frac{C_1}{(1+r)^1}\right)+\left(\frac{C_2}{(1+r)^2}\right)+\cdots\left(\frac{C_t}{(1+r)^t}\right)-C_0$ (9)
where, NPV=Net Present Value; Ct=cash flow for every period of -t; C0=initial investment in 0 year; r=interest rate (6%).
(f) Payback Period (PP) uses the formula [24] below:
Payback Period $(\mathrm{PP})=\mathrm{n}+\frac{\mathrm{a}-\mathrm{b}}{\mathrm{c}-\mathrm{b}} \times 1$ year (10)
where, n=returning condition year; a=total amount of initial investment; b=total amount of cash flow investment in the n-th year; c=cumulative amount of cash flow in the n+1 year.
(g) Internal Rate of Return (IRR) uses the formula [25] below:
$\operatorname{IRR}=i_1+\frac{N P V_1}{N P V_1-N P V_2} x\left(i_2-i_1\right)$ (11)
where, IRR=Internal Rate of Return (IRR); i1=discount rate1 (10%); i2=discount rate2 (18%); NPV1=NPV at interest rates i1; NPV2=NPV at interest rates i2.
(h) Profitability Index (PI) uses the formula [26] below:
Profitability Index $=\frac{\text { Proceeds }}{\text { Outlays }}$ (12)
where, Proceeds=current net cash value for the upcoming; Outlays=current investment value.
The results of this study used data with fixed cost types and variable costs. Fixed costs are alays used with a constant and dominant budget. Variable costs indicate the costs which are needed in supporting the operational process. The needs and processes of business during the first year related to the fixed costs and variable costs are as follows:
Table 1. Fixed cost recapitulation
|
Fixed cost |
|
|
Details |
Values (Rp) |
|
Location |
43.000.000 |
|
tools |
33.650.000 |
|
Sum |
76.650.000 |
(Source: data processing, 2021)
Table 1 showed that the fixed cost which is required by the garage owner is Rp. 76,650,000. This fee consists of Rp. 43,000,000 for location fee and Rp. 33,650,000 for equipment costs.
Table 2 showed that the variable cost which is required by the garage owner is Rp. 26,525,000. This fee consists of Rp. 18,125,000 for spare parts costs, Rp. 7,500,000 for labor workers, Rp. 500,000 for Wi-Fi connections and electricity, and Rp. 400,000 for water. The initial cost in establishing a garage business is by reviewing the fixed costs and variable costs.
Table 3 showed the investment costs needed by the owner of costume garage are Rp. 103,175,000. This fee is an individual fee, it is not part from lending to a bank. The value of investments is to support the ongoing business processes. The initial stage for the research process is to calculate the depreciation value in the applied asset. The scope of depreciation covers the equipment which is used in garage operations.
Table 2. Variable cost recapitulation
|
Variable cost |
|
|
Details |
Value (Rp) |
|
Spare Parts Sales |
18.125.000 |
|
Workers |
7.500.000 |
|
Wi-Fi |
500.000 |
|
Electricity and Water |
400.000 |
|
Sum |
26.525.000 |
(Source: data processing, 2021)
Table 3. Investment costs
|
Type of Cost |
Value (Rp) |
|
Fixed cost |
76.650.000 |
|
Variable cost |
26.525.000 |
|
Sum |
103.175.000 |
(Source: data processing, 2021)
Table 4. Depreciation
|
Details |
Purchase Price (Rp) |
Economic Age (years) |
|
Tools |
16.000.000 |
5 |
|
Sum |
16.000.000 |
5 |
|
Residual Value (Rp) |
Depreciation per month (Rp) |
Value per year (Rp) |
|
300.000 |
240.000 |
2.880.000 |
|
300.000 |
240.000 |
2.880.000 |
(Source: data processing, 2021)
Table 5. Gross receipts for one year 2020
|
No |
Month - |
Gross Receipts (Y) |
X |
XY |
X2 |
|
1 |
1 |
18.750.000 |
-6 |
-112.500.000 |
36 |
|
2 |
2 |
18.750.000 |
-5 |
-93.750.000 |
25 |
|
3 |
3 |
30.000.000 |
-4 |
-120.000.000 |
16 |
|
4 |
4 |
30.000.000 |
-3 |
-90.000.000 |
9 |
|
5 |
5 |
18.750.000 |
-2 |
-37.500.000 |
4 |
|
6 |
6 |
40.500.000 |
-1 |
-40.500.000 |
1 |
|
7 |
7 |
12.750.000 |
1 |
12.750.000 |
1 |
|
8 |
8 |
18.750.000 |
2 |
37.500.000 |
4 |
|
9 |
9 |
18.750.000 |
3 |
56.250.000 |
9 |
|
10 |
10 |
58.000.000 |
4 |
232.000.000 |
16 |
|
11 |
11 |
18.750.000 |
5 |
93.750.000 |
25 |
|
12 |
12 |
60.000.000 |
6 |
360.000.000 |
36 |
|
Total |
343.750.000 |
298.000.000 |
182 |
||
(Source: data processing, 2021)
Table 4 showed the depreciation value in one year is Rp. 2,880,000. The deprecation value functions to determine the benefit value of the equipment. The economic lifespan of the equipment based on the warranty period is 5 years. The remaining value is Rp. 300,000. It means that every year will shrink into Rp. 300,000 for the applied equipment. Depreciation value for one year is obtained Rp. 2,880,000. The first purpose of this study is applying the stage of demand forecasting using linear trend regression methods as the results shown in Table 5.
Table 6. First year demand forecasting results
|
Month - |
X |
Income (Rp) |
|
1 |
7 |
40.107.372 |
|
2 |
8 |
41.744.734 |
|
3 |
9 |
43.382.097 |
|
4 |
10 |
45.019.460 |
|
5 |
11 |
46.656.822 |
|
6 |
12 |
48.294.185 |
|
7 |
13 |
49.931.548 |
|
8 |
14 |
51.568.910 |
|
9 |
15 |
53.206.273 |
|
10 |
16 |
54.843.636 |
|
11 |
17 |
56.480.998 |
|
12 |
18 |
58.118.361 |
|
Total (Rp) |
589.354.396 |
|
(Source: data processing, 2021)
The calculation of demand forecasting values is ∑Y=343,750,000, n=12 (months), ∑XY=298,000,000 and ∑X2=182. Demand forecasting uses linear regression trends by firstly calculating intercept (a) and slope (b) values.
$a=\frac{\sum Y}{n}=\frac{343.750 .000}{12}=28.645 .833$
$b=\frac{\sum X Y}{\sum X^2}=\frac{298.000 .000}{182}=1.637 .363$
After that, it resulted the trend value equations as follows:
Y=28.646.833+1.637.363X
Basic period: month
month X: month
Y: unit / month
So, demand forecasting is in the 1st month of 2021. In Y (the 1st month of 2021), with the value of X=7, because the data used for the basis of forecasting has an even scale of 12 months with the value of X=-6 to+6, then the value of X for forecasting is 7. After calculating the forecasting equation model, it is multiplied by the value X=7, the result is:
Y=28.646.833+1.637.363(7)=40.107.372
So, income receipts forecasting on the installation of alloy wheels spare parts in costume garages in the 1st month of 2021 is Rp. 40,107,372. Alloy wheels offered by the garage owners vary including the well-known brands. Demand forecasting for the 2nd month of 2021 to the 12th month is summarized as Table 6.
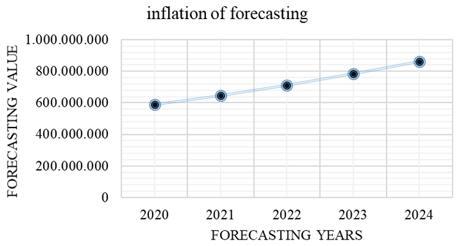
Demand forecasting for the year 2022, 2023, 2024, and 2025 uses 10% increase in value from the first year of demand forecasting results. Assumption of 10% as an increase in demand forecasting is recapitulated as follows:
Table 7. Demand forecasting results with a 10% increase per year
|
Year - |
Demand Forecasting Results |
|
Demand Forecasting (Rp) |
|
|
2020 |
589.354.396 |
|
2021 |
648.289.835 |
|
2022 |
713.118.819 |
|
2023 |
784.430.701 |
|
2024 |
862.873.771 |
|
Total |
3.598.067.521 |
(Source: data processing, 2021)
Table 7 showed the value of demand forecasting for every year during the first year to the fifth year. Total results of forecasting demand is Rp. 3,598,067,521.
Figure 1 showed that a significant increase in forecasting can be viewed from the forecasting year chart 2020 to 2024. The forecasting improvement chart refers to Table 7.
Table 8 showed that Net Cash Flow which is formed functions as the base for assessing the criteria of NPV, IRR, PBP and B / C. Cash entry functions as income of value generated from costume garage services. Cash out functions as a need to use during the operation of costume garages. The value of earning before tax is the value of profits that have not been taxed from the local city government. Taxes which are provided by the local government is 20%. Therefore, the profit for every year is cut by 20%. The net income is in earning after tax. The assessment reaches the peak when the net cash in 2020 is Rp. 41,363,516, the net cash in 2021 is 53,024,835, the net cash in 2022 is 58,327,319, the net cash in 2023 is 64,160,051, and the net cash in 2024 is 70,576,056.
Table 9, the recapitulation uses the assumption of 6% discount rate. The result of Net Present Value is Rp. 107,229,752 and it is greater than the investment used which is Rp. 103,175,000. Therefore, this business is still worth running in the future.
Table 10 showed that the Internal Rate of Return from costume garage businesses uses discount rates in trial and error. Discount rate1 is 10% and discount rate2 is 18% to assess realistic investments. The Internal Rate of Return result is 29.4% and it is greater than the bank's assumed interest rate which is 10%. Consequently, the results are very realistic for costume garage businesses that are run without measuring the alternative investment options, because the entire value of calculations uses data from research observations.
Table 8. Recapitulation of net cash flow
|
Investments (Rp) |
103.175.000 |
||||||
|
years- |
Cash In |
Cash Out |
Depreciation |
Earning Before Tax |
Tax (20%) |
Earning After tax |
Net Cash Flow |
|
2020 |
589.354.396 |
541.150.000 |
2.800.000 |
48.204.396 |
9.640.879 |
38.563.516 |
41.363.516 |
|
2021 |
648.289.835 |
595.265.000 |
3.080.000 |
53.024.835 |
53.024.835 |
53.024.835 |
53.024.835 |
|
2022 |
713.118.819 |
654.791.500 |
3.388.000 |
58.327.319 |
58.327.319 |
58.327.319 |
58.327.319 |
|
2023 |
784.430.701 |
720.270.650 |
3.726.800 |
64.160.051 |
64.160.051 |
64.160.051 |
64.160.051 |
|
2024 |
862.873.771 |
792.297.715 |
4.099.480 |
70.576.056 |
70.576.056 |
70.576.056 |
70.576.056 |
(Source: data processing, 2021)
Table 9. Net present value
|
Years- |
Net Cash Flow |
Discount rate (6%) |
Present Value |
|
0 |
-103.175.000 |
|
|
|
2020 |
41.363.516 |
0.9434 |
39.022.341 |
|
2021 |
53.024.835 |
0.8900 |
40.494.883 |
|
2022 |
58.327.319 |
0.8396 |
42.021.858 |
|
2023 |
64.160.051 |
0.7921 |
43.608.939 |
|
2024 |
70.576.056 |
0.7473 |
45.256.730 |
|
NPV |
107.229.752 |
||
(Source: data processing, 2021)
Figure 1. Increasing demand forecasting
Table 10. Recapitulation of internal rate of return
|
Years- |
Net Cash Flow |
Discount Rate1 (10%) |
Present Value1 |
Discount Rate2 (18%) |
Present Value2 |
|
0 |
-103.175.000 |
|
|
|
|
|
2020 |
41.363.516 |
0.9091 |
37.603.573 |
0.8475 |
35.055.580 |
|
2021 |
53.024.835 |
0.8264 |
37.601.091 |
0.7182 |
32.678.005 |
|
2022 |
58.327.319 |
0.7513 |
37.602.456 |
0.6086 |
30.460.342 |
|
2023 |
64.160.051 |
0.6830 |
37.602.456 |
0.5158 |
28.397.287 |
|
2024 |
70.576.056 |
0.6209 |
37.601.905 |
0.4371 |
26.470.918 |
|
NPV I |
84.836.481 |
NPV II |
84.836.481 |
||
|
Internal Rate of Return |
29.4% |
||||
(Source: data processing, 2021)
Table 11. The calculation result of payback period
|
Years- |
Net Cash Flow |
Cumulative |
|
103.175.000 |
103.175.000 |
|
|
2020 |
41.363.516 |
41.363.516 |
|
2021 |
45.499.868 |
86.863.385 |
|
2022 |
50.049.855 |
136.913.240 |
|
2023 |
55.054.840 |
191.968.080 |
|
2024 |
60.560.324 |
252.528.404 |
|
Payback Period |
2.75 |
|
Table 12. Profitability index
|
Years- |
Discount rate |
Net Cash Flow |
Present Value |
|
18% |
-103.175.000 |
||
|
2020 |
0,8475 |
41.363.516 |
35.055.580 |
|
2021 |
0,7182 |
45.499.868 |
32.678.005 |
|
2022 |
0,6086 |
50.049.855 |
30.460.342 |
|
2023 |
0,5158 |
55.054.840 |
28.397.287 |
|
2024 |
0,4371 |
60.560.324 |
26.470.918 |
|
Profitability Index |
1.48 |
||
(Source: data processing, 2021)
Table 11, to assess the return on capital of the payback period value, it needs 2.75 units with the result of conversion to 2.75 years. The return for Rp. 103,175,000 capital spends 2.75 years, and it is not a problem. This is because the business owners do not assume the expected return on capital.
Table 12, Profitability Index is the value of the present ratio with investment of 1.48. The value shows that the business can be run because it has a profit opportunity in the future for about 1.48 times greater than the current investment nominal of Rp. 103,175,000.
Table 13 showed the benefits ratio from the expenses including operations with a value of B / C is 1.1 units. It means that there is a benefit, 1.1 times for every operation of the running costume garage.
Based on a business feasibility study that has determined the results of net present value, internal rate of return, payback period, profitability index and benefit cost ratio to get the appropriate value. The value obtained is feasible to state that the modification workshop business can be carried out.
Table 13. B/C
|
Years- |
Benefit |
Cost |
B/C |
|
2020 |
589.354.396 |
541.150.000 |
1.09 |
|
2021 |
648.289.835 |
595.265.000 |
1.09 |
|
2022 |
713.118.819 |
654.791.500 |
1.09 |
|
2023 |
784.430.701 |
720.270.650 |
1.09 |
|
2024 |
862.873.771 |
792.297.715 |
1.09 |
|
Sum of B/C |
1.1 |
||
(Source: data processing, 2021)
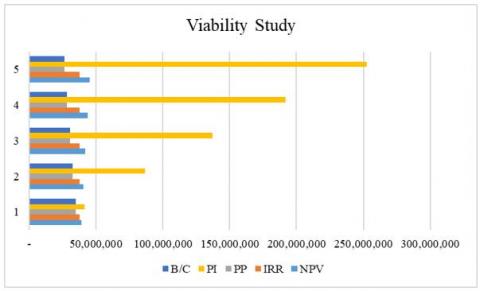
Figure 2. Viability study
Figure 2 states that the dominant factor is the increase in the profitability index. This becomes the stated criterion there is an increase in the benefits of the specified investment value. The thing that causes an increase in benefits is that assets and production facilities can experience excessive function according to the way they are used. However, indirectly, it is also natural to have this depreciation rate, because an asset will experience a constituency where there is a decrease in value over a period of use. Therefore, the benefits of this custome workshop business are reviewed which can provide a sustainability role. The statement that assets will experience a decline or depreciation is indeed the case of the development of a business. The value of the profitability index which is very significantly increased from the period of year 1 to year 5 makes proof, that the profit index greatly determines the role of feasibility studies, in addition to the net present value, internal rate of return and payback period.
Based on the criteria of financial analysis that has been done. Costume workshop is declared viable on an NPV basis of Rp. 107,229,752 > from an investment of 103,175,000. The 29.4% IRR value means that investments in establishing costume garages can provide a profit of 29.4% annually based on investment. Payback period value as the return for capital for 2.75 years. The profitability index is 1.1 times greater than the level of generated opportunity. The value for benefits is 1.1 times from the operational activities. The implications of this study require the design of determining strategies in dealing with future risks related to similar competitors. The assessment of business feasibility studies in this custome workshop can be used as a strength in the financial aspect. Where the role of the financial aspect is very useful in supporting the success of the sustainability of the custome workshop business.
Recommendations that can be given for this study are to review aspects of technology that have not been discussed in this article. Recommendations on technological aspects, then analyzing in depth can support as full value research.
This research is limited to the assessment of financial aspects. This research includes the assessment of NPV, IRR, PBP, PI and B/ Cas financial analysis achievements. Future research can review aspects of the technology used in custome workshops. So, it can be innovated as an upcoming research development.
[1] Pradana, J.A., Komari, A., Indrasari, L.D. (2020). Feasibility study of coffee tell business with financial analysis. Industri Inovatif: Jurnal Teknik Industri, 10(2): 92-97. https://doi.org/10.36040/industri.v10i2.2855
[2] Widjajanti, K., Prihantini, F.N., Wijayanti, R. (2022). Sustainable development of business with canvas business model approach: empirical study on MSMES batik Blora, Indonesia. International Journal of Sustainable Development and Planning, 17(3): 1025-1032. https://doi.org/10.18280/ijsdp.170334
[3] Ronyastra, I.M., Sutrisna, P.D., Waluyo, P.W., Winadi, A.S., Priyantini, H.R. (2020). Risk modelling in financial feasibility study for caesalpinia sappan natural dyes factory in Surakarta. In IOP Conference Series: Materials Science and Engineering, 1003(1): 012091. https://doi.org/10.1088/1757-899X/1003/1/012091
[4] Gómez, J.R., Sousa, V., Eras, J.J.C., Gutiérrez, A.S., Viego, P.R., Quispe, E.C., de León, G. (2022). Assessment criteria of the feasibility of replacement standard efficiency electric motors with high-efficiency motors. Energy, 239: 121877. https://doi.org/10.1016/j.energy.2021.121877
[5] Litamurni, F.A., Chumaidiyah, E. (2021). Business design and feasibility of doria cafe start up supported by website application in Bandung city. International Journal of Mechanical Engineering Technologies and Applications, 2(1): 25-31.
[6] Pradana, J.A., Komari, A., Indrasari, L.D. (2020). Feasibility study of coffee tell business with financial analysis. Industri Inovatif: Jurnal Teknik Industri, 10(2): 92-97. https://doi.org/10.36040/industri.v10i2.2855
[7] Handayani, D.A. (2016). Feasibility analysis of business" Amalia Boutique" PT Warna Warni Amalia as muslimah fashionin south jakarta. JRMSI-Jurnal Riset Manajemen Sains Indonesia, 7(1): 41-55. https://doi.org/10.21009/JRMSI.007.1.03
[8] Darmawan, C. (2016). Feasibility study of henry's motorcycle workshop business development. Jurnal Manajemen Maranatha, 15(2): 163-190. https://doi.org/10.28932/jmm.v15i2.14
[9] Nesticò, A., Macchiaroli, M., Pipolo, O. (2015). Costs and benefits in the recovery of historic buildings: the application of an economic model. Sustainability, 7(11): 14661-14676. https://doi.org/10.3390/su71114661
[10] Fajarika, D., Fahadha, R.U., Mardiono, I., Miswari, N. (2019). Feasibility study of shallot production in financial aspect in central lampung (Case study: Kota Gajah). Journal of Science and Applicative Technology, 2(1): 26-34. https://doi.org/10.35472/281423
[11] Gamma, G.A., Sitepu, M., Panjaitan, F. (2018). Analysis of the feasibility study for the development of the jasmine key "UMKM" business in the city of Pangkalpinang in terms of financial aspects. Jurnal Progresif Manajemen Bisnis, 24(2): 12-18. https://e-jurnal.stie-ibek.ac.id/index.php/JIPMB/article/view/322.
[12] Maček, D., Magdalenić, I., Ređep, N.B. (2020). A systematic literature review on the application of multicriteria decision making methods for information security risk assessment. International Journal of Safety and Security Engineering, 10(2): 161-174. https://doi.org/10.18280/ijsse.100202
[13] Longo, D., Boeri, A., Gianfrate, V., Palumbo, E., Boulanger, S.O. (2018). Resilient cities: Mitigation measures for urban districts. A feasibility study. International Journal of Sustainable Development and Planning, 13(5): 734-745. https://doi.org/10.2495/SDP-V13-N5-734-745
[14] Bhatia, M., Rana, A. (2020). A mathematical approach to optimize crop allocation – A linear programming model. International Journal of Design and Nature and Ecodynamics, 15(2): 245–252. https://doi.org/10.18280/ijdne.150215
[15] Carbonelli, M., Gratta, L. (2021). A general multi-risk assessment method for natural disasters and CBRNE attacks. International Journal of Safety and Security Engineering, 11(4): 345-352. https://doi.org/10.18280/ijsse.110407
[16] Setiyo, M., Widodo, E.M., Rosyidi, M.I., Waluyo, B., Pambuko, Z.B., Tamaldin, N. (2020). Feasibility study on small cars as an alternative to conventional fleets due to low occupancy: Case study in Indonesia. Heliyon, 6(1): e03318. https://doi.org/10.1016/j.heliyon.2020.e03318
[17] Tarigan, U.P.P., Mardhatillah, A., Budiman, I., Sembiring, A.C., Ramadhan, M.S. (2018). Feasibility study analysis of establishing archery sports special place. In Journal of Physics: Conference Series, 1007(1): 012027. https://doi.org/10.1088/1742-6596/1007/1/012027
[18] Rangkuti, F. (2012). Business and Investment Feasibility Studies: Case Studies, 1st ed. Jakarta: Gramedia Pustaka Utama.
[19] Aditya, A.S., Bakar, A., Fitria, L. (2013). Feasibility analysis of simple and easy delivery cabinets/racks in Cikarang District. Reka Integra, 1(4): 180-191. https://ejurnal.itenas.ac.id/index.php/rekaintegra/article/view/306/423.
[20] Kusuma, P.T.W.W., Mayasti, N.K.I. (2014). Analysis of the financial feasibility of developing a local commodity production business: corn-based noodles. Agritech, 34(2): 194-202. https://doi.org/10.22146/agritech.9510
[21] Croston, J.D. (1972). Forecasting and stock control for intermittent demands. Journal of the Operational Research Society, 23(3): 289-303. https://doi.org/10.1057/jors.1972.50
[22] Stocker, T., Qin, D., Plattner, G.K., et al. (2014). Summary for Policymakers. Cambridge University Press. https://doi.org/10.1017/CBO9781107415324.004
[23] Ferrara, M., Monetti, V., Fabrizio, E. (2018). Cost-optimal analysis for nearly zero energy buildings design and optimization: A critical review. Energies, 11(6): 1478. https://doi.org/10.3390/en11061478
[24] Christian Amos, C., Rahman, A., Mwangi Gathenya, J. (2016). Economic analysis and feasibility of rainwater harvesting systems in urban and peri-urban environments: A review of the global situation with a special focus on Australia and Kenya. Water, 8(4): 149. https://doi.org/10.3390/w8040149
[25] Cundara, N., Setyabudhi, A.L. (2018). Feasibility analysis of Batam minimalist workshop business development with NPV and FPV methods. Jurnal Kreatif Industri, 2(2): 59-68. https://garuda.kemdikbud.go.id/documents/detail/1097200.
[26] Nugraha, A., Hardyastuti, S., Mulyo, J.H. (2017). Financial feasibility of Sijuk shrimp paste business in Sungai Padang village, Sijuk District, Belitung Regency. Agro Ekonomi, 28(1): 142-156.