Rachid Djeffal | Lalmi Djemoui* | Hebbir Nacer | Bekkouche Sidi Mohammed El Amine | Zohir Younsi
© 2021 IIETA. This article is published by IIETA and is licensed under the CC BY 4.0 license (http://creativecommons.org/licenses/by/4.0/).
OPEN ACCESS
For any new applicable and profitable investment in the thermal field of any region, we aim to eliminate or renovate conventional heating and air conditioning systems with new systems, which will work with new energies or renewable. First, you need to know the climate characteristics of these regions. In this study, we determine the diagnosis of the climate of arid and semi-arid regions, taking Ghardaïa as an example. These concerns air conditioning, heating, cold, ventilation, thermal water, for all this, we use the data from the two weather stations located on the Terrace of our research unit applied to renewable energies (URAER), Ghardaïa, for the last five years (2012-2016), to calculate the day degrees heating and air conditioning (DJC and DJF) and the obtained results have been compared with the RET Screen motor from (1980_2006). Our approach allows us to discover a simple graphic method to characterize the seasons of Ghardaïa; applicable for any region around the world. In addition, it allows the real determination of the hygrothermal comfort of the region as well as the thermal characteristics of the MCPs adaptable to the Saharan climate.
climate, seasons, RET screen, hygrothermal comfort, MCP and DJC
Throughout The climate of our planet is based on seasons, which are classified into two major categories, namely; astronomical and real seasons. Generally, the astronomical seasons are known by their spring and autumn equinoxes’ seasons, whereas summer and winter are the solstice’s seasons. The first category practically keeps the same behavior on global scale [1]. However, the second category varies from one region to another, due to several parameters [2]. The determination of inter-season periods is thermally ideal and passively comfortable and based on different parameters [3]; among them:
• Start and end of the device operation; Such as heating and air conditioning [3].
• Heating Day (DJC) and Day Air Conditioning (DJF) degrees; are as small as possible (weak) [4].
• Internal hygro-thermal comfort; are generally insured within the comfort intervals by temperature ranges (18 <Tc <28, 25% <Hc <80%) [4].
• External temperatures are nexus the internal temperatures (The temperature ranges between the outside and inside of the building is low).
• Wind speeds.
• Atmospheric pressure, sunshine and precipitation.
So it can be said that the challenge in these periods is to avoid as possible the use of heating and air-conditioning systems. In other hand, the natural hygro-thermal comfort should be ensured (the inertia of the housing and the natural ventilation), based on the sensitive storage which is difficult. This is due to the influence of several indices related to human beings or to the buildings themselves [5], such as human metabolism (age, sex, fatigue, etc.), ambient temperature (Ta), the mean temperatures radiated from the walls (Tp) relative air humidity (Hr), air velocity, orientation of the building and other Different materials used, insulation, etc.). Additionally, the internal thermal imbalance and all the known problems can be partially solved by applying new techniques and approaches. Accordingly, it can be cited the intelligent materials called phase change materials (PCM) based on the latent storage principle, whose their melting temperatures are closer to the desired comfort temperature (between 18℃ and 27℃). The storage and discharge of these materials are based on the endothermic-exothermic phenomena whose shape variation is sinusoidal (above and below these melting temperatures).
Several researches adopted the selection and integration of this new material in summer. They focused on the integration based on the use of phase change materials in the building structure. Therefore, its choice is reduced to a single melting temperature in the comfort interval, between 17℃ and 30℃. Accordingly, a study has been carried out within this field in Ghardaïa region by Stojanovi et al. [6]. These essential thermal problems related to buildings, caused many of the social hazards and social problems such as: the carbon monoxide emission (CO2) which causes environmental impacts: In Algeria; for example;
The number of people who died between 1 January and 09 February 2017, was 49 people, due to the carbon monoxide emitted by the different heating systems at the national scale [6], High heating and air conditioning bills, Greenhouse gas emissions (the increase in CO2 in the planet), thermal imbalance in housing, etc.
The climate is variable over the world regions and in the same country due to the radical change, the geographical localization ... etc.). In the Algerian case, the climate varies from north to south and divided into seven main climatic zones (A, B, B, C, D1, D2, D3), zone has a different weather conditions. Thus, our current study is based on Ghardaïa region characteristics, which presents a hard climate, regarding its important situation in the southern part of Algeria, which belongs to the climatic zone D1. The known weather of this city is a cold winter within three months (December, January and February) and a dry very hot summer within a period of five months (May, June, July, August and September). In addition to the spring disturbances, caused by sandy storms between April and March, however, the fall season is generally the most stable weather within period (October and November). This medium weather influences the energy expenditure of the summer period within the months [May, June, July, August and September]. In other times, it constitutes the more rate with (3/2); including the months of winter period [December, January and February]. Reference to the work of [7], about 16893.4 KWH in summer 2014 and about 12738 KWH in winter of the years [2013-2014] have been recorded, respectively. This study yielded energy expenditure of 28% for the winter, 13% for the spring, 42% for the summer and 17% for the fall. In order to raise these problems mentioned above, our work based on a new idea, and on the integration of two phase change materials, at different melting temperatures (MCPTf1 and MCPTf2), within the comfort intervals [18℃, 27℃]. The used values are for the winter season between 18℃ and 22℃ and for the other for the summer season between 24℃ and 28℃.
The main objectives of this project are the radical elimination of active heating and cooling during the inter-season periods to will make the most of the equinoxes (autumn and spring) to ensure hygrothermal comfort.
Because the difference between the mean (amplitude) temperatures of the night and day (daytime and night) of the equinoxes is not great, they remain acceptable [between -5 and +5]. But the amplitudes of the solstices remain large over all the Saharan regions and over the high plateaus of Algeria (between 0 and 30) [8]. Unfortunately, we are faced with the thermal failure of the two solstices and all of them in the summer period. The technical aspect of this new idea will allow us to delay the re-entry of the thermally critical seasons (winter and summer) and accelerate it out of its periods. A time prolongation of the real intervals of the two equinoxes takes place by a precise selection and the specific integration of the two intelligent materials (MCPs). For the proper functioning of the storage and the discharge of the MCPs; the use of its MCPs will reduce the energy consumption related to heating, air conditioning and diminution of greenhouse gases. These materials will delay and dampen peak temperatures in the heat wave periods, in a dysphasic manner and the distance of time from the devices will affect the improvement of the social and economic Tangible reality with these integration techniques.
Our current work consists of a first kind study, which involves the actual use and study of the two MCPs in the building structure. First, it will consist of a site selection, a construction of a large meteorological database of two stations [ENERCO (Series 400 and 500), German] Thus, the obtained data were compared to the climatological data of the RET Screen engines of [1980-2006], as well as data acquired from the National Weather Office (ONM) of Ghardaïa. Accordingly, the heating day (DJC) and the day of air conditioning (DJF) have been calculated. In the goal to determine exactly the actual thermal seasons and to make simulated calculus, moreover, the intervals days between the seasons were selected and the real socio-economic impact of the MCPs integration in the multizone building tissue, in the region of Ghardaïa, is deduced.
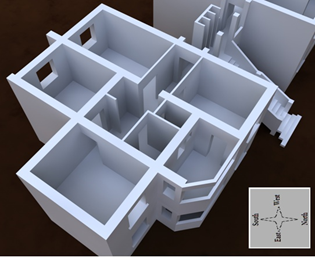
The our study was conducted on a habitat located in a functional housing city of research applied unit of renewable energies (URAER) at Ghardaïa with a living area of 71.3 m2, of 66 m2 actual surface to heated and / or cooled, the height of the walls is 2.8 m (Figure 1). The windows are simple, clear glazing with a thermal transmittance which equals U = 5.91 W / (m².K). The doors are wooden and 2 cm thick: λ=0.14 W m-1 K-1, ρ = 500 kg.m-3 and Cp = 2500 J. kg-1.K-1. (λ, ρ and Cp, respectively the thermal conductivity, the density and the specific heat) [2].
Figure 1. 3D plan of the chosen house
The Wireless Weather Station with Touch WS2-550: is used to record, process and display real internal data for a 2016 year of accommodation studied at the level of our URAER city. It is a very reliable and efficient station, equipped with a combined weather sensor (thermo-hygrometer, rain gauge, and anemometer).
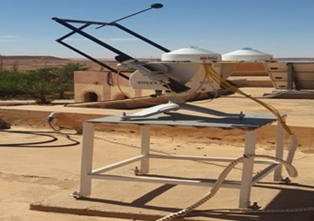
For the outside date collection an efficient specific metrological station has been used to, measure several parameters such as temperatures, humidity, wind speed, pressure, and solar radiation (Figure 2).
The station Operates with 10 min and an accuracy of 0.005 (℃).
Figure 2. URAER Ghardaïa weather station
The choice of the comfort range [19℃-30℃]:
1. Comfort temperature: Several researchers are working on the determination of thermal comfort limits on buildings; According to the diagnosis of [8].
$T_{n}=9.22+0.48 T_{\text {int }}+0.14 T_{\text {ext }}$ (1)
This is the new standard 55-200432, which he used by Khelifi et al. [9]. The choice of the building's comfort domain, linked to the impacts of several parameters, cited above, and others which are grouped in the following two tables (Table 1 and Table 2) [10].
Table 1. Contact temperature between the human body and some materials [10]
|
Materials |
contact temperature |
|
steel |
θC=2.1+0.93 θ |
|
concrete |
θC=10.6+ 0.65 θ |
|
stone |
θC = 11.9+ 0.18 θ |
|
Wood |
θC = 19.4+ 0.35 θ |
|
carpet |
θC =27.5+0.08 θ |
|
θC: the contact temperature between the human body and some materials; θ is the initial temperature of the material; eg; θ stone = 20℃, θ concrete = 5℃ |
|
Table 2. Operational temperatures for summer and / or winter comfort [11]
|
Hab. H (clo) |
Temp. oper. to (°C) |
PMV according to the relative air velocity (m/s) |
||||||||
|
Activity level M =70W/m² |
||||||||||
|
<0.10 |
0.10 |
0.15 |
0.20 |
0.30 |
0.40 |
0.50 |
1.00 |
1.50 |
||
|
0.5 Summer |
18 |
-2.01 |
-2.01 |
-2.17 |
-2.38 |
-2.70 |
- |
- |
- |
- |
|
20 |
-1.41 |
-1.41 |
-1.58 |
-1.76 |
-2.04 |
-2.25 |
-2.42 |
- |
- |
|
|
22 |
-0.79 |
-0.79 |
-0.97 |
-1.13 |
-1.36 |
-1.54 |
-1.69 |
-2.17 |
-2.46 |
|
|
24 |
-0.17 |
-0.20 |
-0.36 |
-0.48 |
-0068 |
-0.83 |
-0.95 |
-1.35 |
-1.59 |
|
|
26 |
0.44 |
0.39 |
0.26 |
0.16 |
-0.01 |
-0.11 |
-0.21 |
-0.52 |
-0.71 |
|
|
28 |
1.05 |
0.96 |
0.88 |
0.81 |
0070 |
0.61 |
0.54 |
-0.31 |
-0.16 |
|
|
30 |
1.64 |
1.57 |
1.51 |
1.46 |
1.39 |
1.33 |
1.29 |
1.14 |
1.04 |
|
|
32 |
2.25 |
2.20 |
2017 |
2015 |
2.11 |
2.09 |
2.07 |
1.99 |
1.95 |
|
|
1.0 Winter |
16 |
|
|
|
|
|
|
|
|
|
|
18 |
-0.75 |
-0.75 |
-0.88 |
-0.98 |
-1.13 |
-1.24 |
-1.33 |
-1.59 |
-1.75 |
|
|
20 |
-0.32 |
-0.33 |
-0045 |
-0054 |
-0.67 |
-0.76 |
-0.83 |
-1.07 |
-1.20 |
|
|
22 |
0.13 |
0.10 |
0.00 |
-0.07 |
-0.18 |
-0.26 |
-0.32 |
-0.52 |
-0.64 |
|
|
24 |
0.58 |
0.54 |
0.46 |
0.40 |
0.31 |
0.24 |
0.19 |
0.02 |
-0.07 |
|
|
26 |
1.03 |
0.98 |
0.91 |
0.86 |
0.79 |
0.74 |
0.70 |
0.57 |
0.50 |
|
|
28 |
1.47 |
1.42 |
1.37 |
1.34 |
1.28 |
1.24 |
1.21 |
1.12 |
1.06 |
|
|
30 |
1.91 |
1.86 |
1.83 |
1.81 |
1.78 |
1.75 |
1.73 |
1.67 |
1.63 |
|
4.1 Temperatures, humidity and solar evolution in deferent season
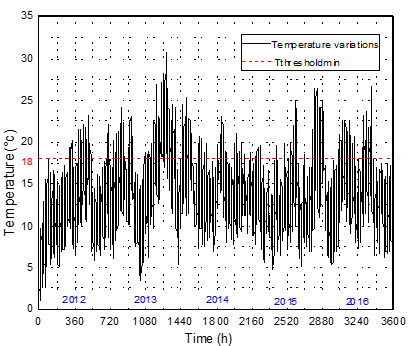
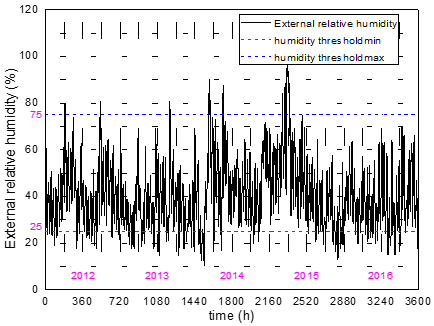
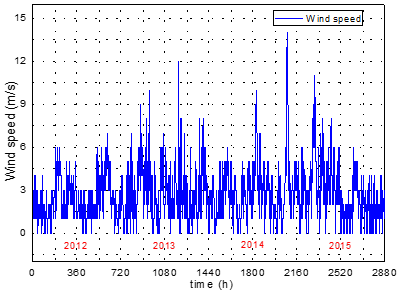
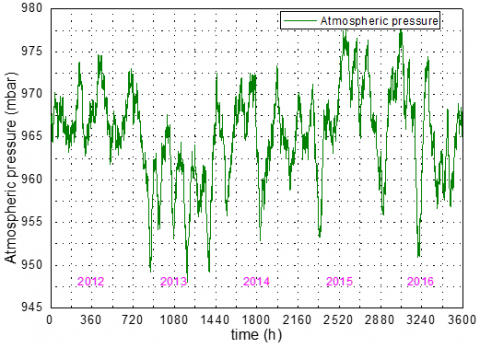
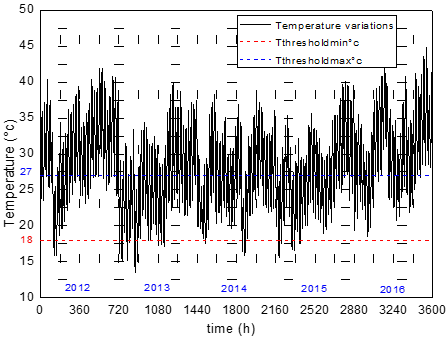
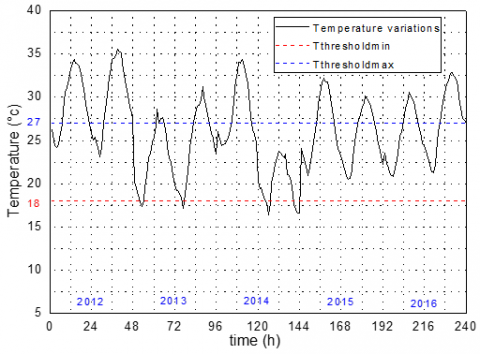
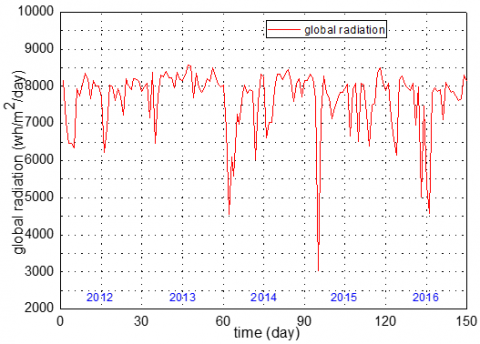
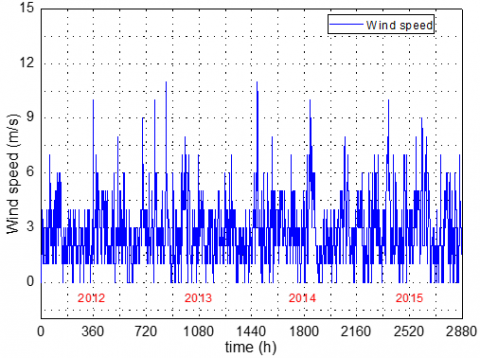
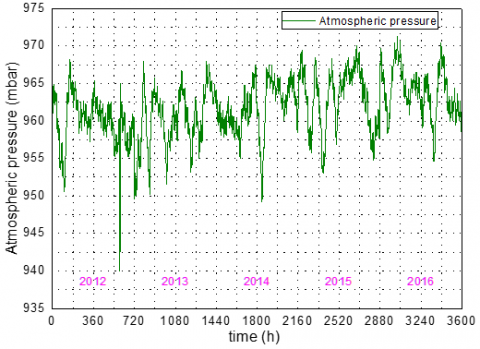
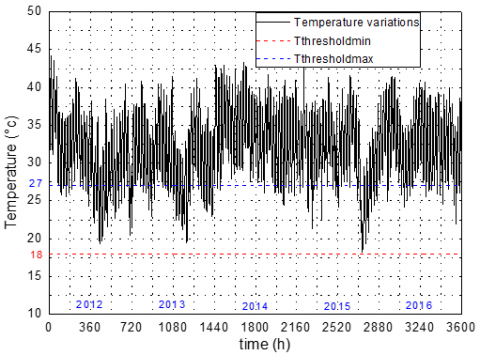
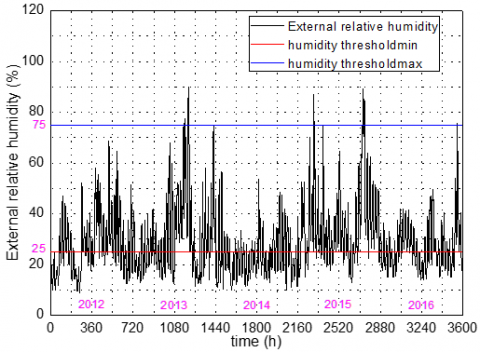
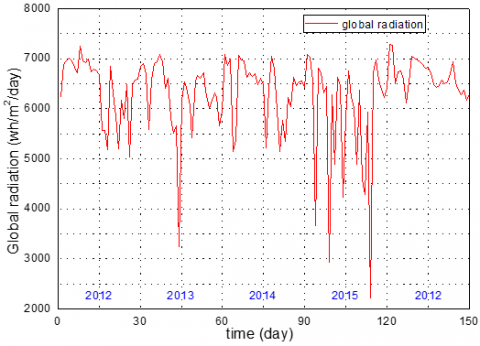
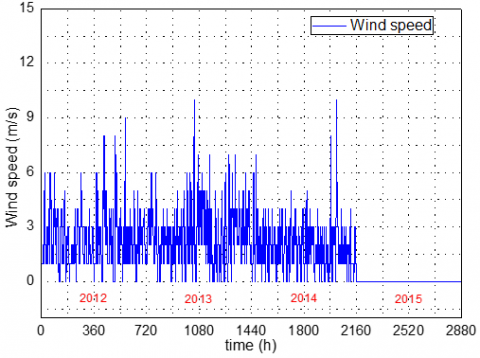
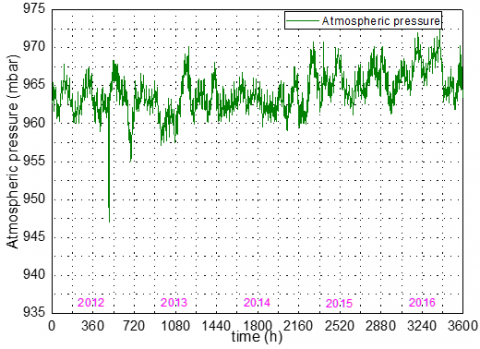
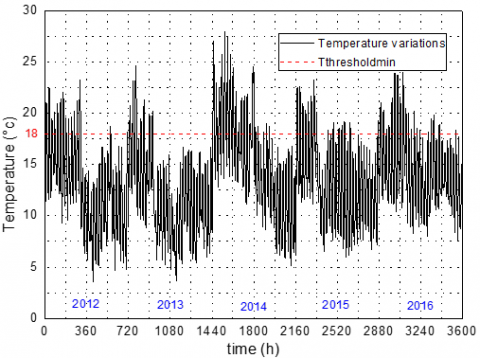
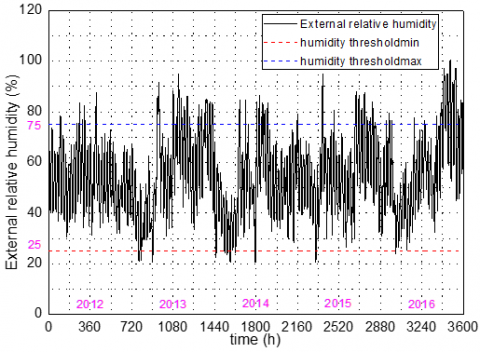
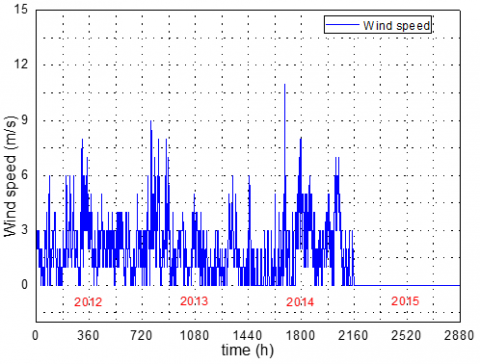
We gather the real data of four separable periods between the seasons, which start from 2012 until 2016, our choices start with the meteorological data of the station ENERCO during the five years, for temperatures, external humidities, wind speeds, atmospheric pressures and global solar radiation. Periods are: [February 14-March 14], [May 16-June 14], [August 16-September 14] and [November 15-December 14] (Figures 3-26).
Figure 3. Outside temperature during the first period in 2012 to 2016
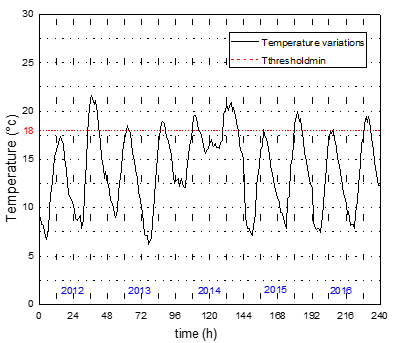
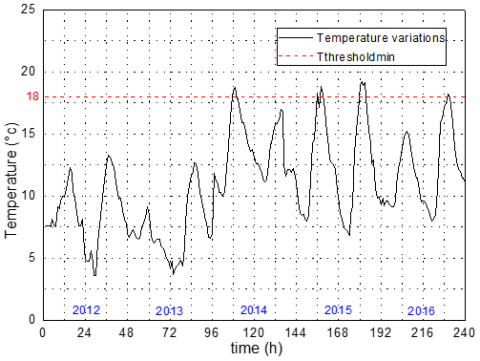
Figure 4. Outside temperature evolutions during the two days 01/03 et 02/03, of the first period
Figure 5. Outside humidity during the first period in 2012 to 2016
Figure 6. Solar radiations evolution during the first period in 2012 to 2016
Figure 7. Outside wind speed variation during the first period 1 in 2012 to 2016
Figure 8. Pressure variations during the 2012 to 2016
Figure 9. Outside temperatures evolutions during the second period for 2012 to 2016
Figure 10. Temperatures evolutions during the 01/06 and 02/06, for the second period
Figure 11. The humidity variation during the second period of 2012 to 2016
Figure 12. Solar radiation during the second period for 2012 to 2016
Figure 13. Wind speed variation during the second period of 2012 to 2016
Figure 14. Pressure variation during the second period of 2012 to 2016
Figure 15. Temperature evolution during the 3rd of 2012 to 2016
Figure 16. Temperature evolutions during 01/09 et 02/09, for the 3rd of 2012 to 2016
Figure 17. Humidity variations des huminites during the 3rd of 2012 to 2016
Figure 18. Solar radiations during the 3rd of 2012 to 2016
Figure 19. Wind speed variation during the 3rd of 2012 to 2016
Figure 20. Pressure variation during the 3rd of 2012 to 2016
Figure 21. Temperature evolution des during the 4th period of 2012 to 2016
Figure 22. Temperature evolution during 01/12 et 02/1 for the 4th period of 2012 to 2016
Figure 23. The humidity variations during the 4th period of 2012 to 2016
Figure 24. Solar radiation during the 4th period of 2012 to 2016
Figure 25. Wind speed variations during the 4th period of 2012 to 2016
Figure 26. Pressure variation during the 4th period of 2012 to 2016
For the calculation of the day Degrees; either for heating (DJC) or for air conditioning (DJF), we have several methods that do this, among the most used; the real method what I call " the professional energy method " (conforms to the regulatory Costic method for the heating and air conditioning operating markets to be used for monitoring) and the "Weather" method with simple calculation, to be used by the RET Screen motor [08].
The importance of calculating the degree-day is to allow estimating the expenditure of energy consumption linked to the thermal (heating and air conditioning) of the buildings. Therefore, it is the evaluation of the harshness of the climate from one year to another and from one region to another (to compare buildings located in different climatic zones and to compare years of heating between them, p .ex. following investments). The Degree Day for any chosen site is a value representative of the difference between the temperature of a given day and a preset temperature threshold.
The Degree Day for any chosen site is a value representative of the difference between the temperature of a given day and a preset temperature threshold [12-14].
Tmin: Minimum temperature for D-day measured at 2 meters from the ground under shelter and recorded between D-1 (the day before) at 6 p.m. and D at 6 p.m. UTC.
Tmax: Maximum temperature on day D measured at 2 meters from the ground under shelter and recorded between D at 6 a.m. and J+1 (the next day) à 06h UTC. $T_{\text {moy }}=\frac{T_{\min }+T_{\max }}{2}$, average temperature of the day.
Tcs: Set point temperature or selected reference temperature threshold.
For our study: Tcs1 = 18℃ and Tcs2 = 27℃.
In our calculation, applied the following two methods:
• Weather method:
If $\left(T_{c s 1}<T_{\text {moy }}\right), D J C=0 ; \quad$ If $\quad\left(T_{c s 1}>T_{\text {moy }}\right)$
$\ldots \ldots \ldots \ldots J=T_{c s 1}-T_{\text {moy }}$ (2)
•Professional energy method:
For the start and end of the heating period:
$DJC=\left( {{T}_{c}}-{{T}_{\min }} \right)*\left( \begin{align} & \frac{0.08+0.42*\left( {{T}_{c}}-{{T}_{\min }} \right)}{\left( {{T}_{\max }}-{{T}_{\min }} \right)} \\ & \\\end{align} \right)$ (3)
For the start and end of the air conditioning period:
$D J F=\left(T_{\max }-T_{c}\right) *\left(0.08+0.42 *\left(T_{\max }-T_{c}\right) /\left(T_{\max }-T_{\min }\right)\right)$ (4)
Table 3. Heating day degrees using the actual method, weather method compared with data from the average RET screen motor
|
Degree Day for Heating (DJC) |
Period 1 [February -March] |
Period [November-December] |
||||||||
|
2012 |
2013 |
2014 |
2015 |
2016 |
2012 |
2013 |
2014 |
2015 |
2016 |
|
|
M*: DJC, Real |
235 |
105 |
32 |
81 |
57 |
195 |
180 |
57 |
88 |
113 |
|
M*: DJC «Weather» |
193 |
103 |
15 |
81 |
37 |
156 |
167 |
56 |
75 |
107 |
|
RET Screen average data from [1980_2005],18°c |
101.50 |
138.00 |
||||||||
|
Absolute difference |
42 |
02 |
17 |
00 |
20 |
39 |
13 |
01 |
13 |
06 |
|
Average DJC |
P1 |
102 |
86 |
P4 |
127 |
130 |
||||
Table 4. Air conditioning day degrees using the actual method, weather method compared with data from the 26-year-old RET screen motor
|
Day Degrees for air conditioning (DJF) |
Period 2 [May-June] |
Period 3 [September-October] |
||||||||||
|
2012 |
2013 |
2014 |
2015 |
2016 |
2012 |
2013 |
2014 |
2015 |
2016 |
|||
|
M*: DJF, Real |
144 |
28 |
53 |
48 |
75 |
193 |
107 |
252 |
231 |
220 |
||
|
M*: DJF «Weather » |
137 |
76 |
50 |
83 |
58 |
184 |
98 |
240 |
231 |
221 |
||
|
RETS screen data from [1980-2005], 27℃ |
82.5 |
103 |
||||||||||
|
Absolute Difference |
07 |
48 |
03 |
35 |
17 |
09 |
09 |
12 |
00 |
01 |
||
|
Average DJF |
P2 |
70 |
81 |
P3 |
201 |
195 |
||||||
Note that the results in the two Tables 3 and 4 are comparable with each other and coincide with that of RETS screen, the differences either less or more because of the influence of global warming which has become a reality in Algeria [15-17].
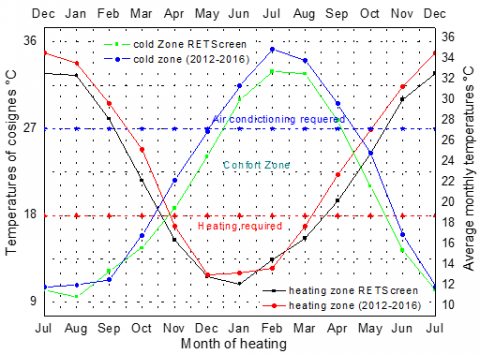
After calculating the Heating and Air Conditioning Day Degrees (DJC and DJF) for the Ghardaïa site, of five years [2012 to 2016], from the base temperatures of 18℃ and 27℃; by the two real and weather methods, compared these results with that of the RETS screen data for 26 years (1981-2006). I have plotted all these data in representative graph salt, call the integral diagram. This graph gives with a clear way, the beginning and the end of each season [18, 19].
Figure 27, giving clearly and really by the methods [DJC and DJF] the beginning and the end; cold seasons (late October to early March), overheating seasons (early May to mid-September) and comfort seasons; for spring (early March until the end of April) and for fall (mid-September until the end of October). These results for the years (2012-2016) and well coincide for comparison with that of RETS screen since 1960; from the Ghardaïa region.
Noting that the return of the critical seasons in recent years (summer and winter) disrupted, advanced and their interval widened and grow has the impact of climate change that hit the whole world and has become a reality even for our country Algeria [20].
According to this diagram (Figure 28), can easily determine by the integrate method consumption either in heating or in air conditioning and the comfort zone. This then determines what objective is looking for (elimination or reduction of the use of heating and air conditioning), that it incorporates material and that it invests in it.
Figure 27. Real determination of heating, comfort zone [18℃: 27℃:] and air conditioning zone in Ghardaïa according to RETS screen data since 1960
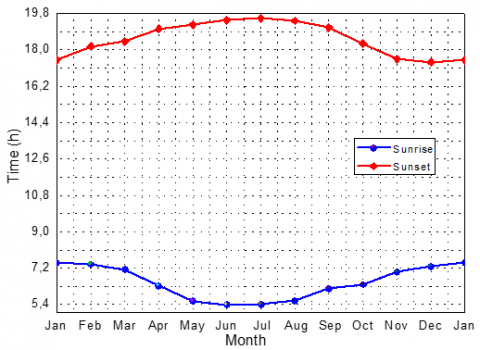
Figure 28. The annual (sunrise and sunset) of the sun, as well as the length of the day during the year in Ghardaïa [09]
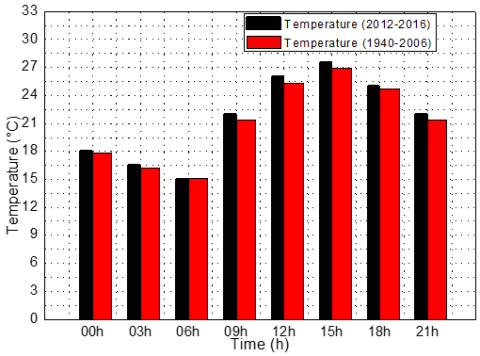
In Figure 29, we note that the evolution of average temperatures at synoptic hours of Ghardaïa during the five years of our study (2012-2016) are increasing compared to NASA data from (1940-2006), due to global warming.
Figure 29. Evolution of average temperatures at synoptic (average temperature of the Ghardaïa region) hours of Ghardaïa (2012-2016) compared with the Ret screen (1940-2006)
The remarks from Tables 5 and 6; giving a clear and reliable vision of the possibility of delaying the entry of the two critical seasons thermally (summer and winter) and also the acceleration of coming out of winter by innovative techniques (for example: MCPs).
Since the increase temperature variations and especially humidity; you approach neighborhoods of comfort intervals; sinusoidally (above and below these comfort temperatures and humidities).
However, these difficult ones accelerated the exit from the heat waves of summer. Other observations on the average temperatures measured are comparable with those of the RETS screen motors and the measurements of the German station, same remarks for humidities. Therefore, the problem of comfort on the humidity side does not pose a problem for human beings because the majority of the variations of the latter located at the comfort range [20%-80%].
Table 5. Changes in actual temperatures in the seasons' limit intervals; of Ghardaïa site, during the last five years of (2012 until 2016), compared with those of the German Precision Station of (10 minutes) and with Rets screen data of (1980-2006)
|
Number of hours |
2012 |
2013 |
2014 |
2015 |
2016 |
Totals |
|
|
Period 1 [14/02_15/03]
Tavr RETS=14,5
T avr S, A= 15,07
|
T<18°C |
640 |
502 |
588 |
611 |
584 |
2925 |
|
T>18°C |
79 |
214 |
129 |
106 |
126 |
654 |
|
|
T>27°C |
0 |
11 |
0 |
0 |
0 |
11 |
|
|
18°C <T<27°C |
79 |
203 |
129 |
106 |
126 |
643 |
|
|
T=18°C |
1 |
4 |
3 |
3 |
10 |
21 |
|
|
T=27°C |
0 |
0 |
0 |
0 |
0 |
0 |
|
|
Tot1 |
720 |
720 |
720 |
720 |
720 |
3600 |
|
|
Tmin[ °C] |
1 |
3,5 |
7 |
4,8 |
2,5 |
||
|
Tmax[ °C] |
23,3 |
30,7 |
25,3 |
26,5 |
26,7 |
||
|
Tavr= en °C |
12,12 |
15,4 |
14,58 |
13,45 |
13,9 |
||
|
Period 2 [16/05_14/06]
T qvr RETS=27,25
T avr S, A=29,68
|
T<18°C |
12 |
45 |
18 |
16 |
0 |
91 |
|
T>18°C |
707 |
673 |
702 |
701 |
720 |
3503 |
|
|
T>27°C |
524 |
333 |
358 |
380 |
533 |
2128 |
|
|
18°C <T<27°C |
184 |
340 |
344 |
321 |
187 |
1376 |
|
|
T=18°C |
1 |
2 |
0 |
3 |
0 |
6 |
|
|
T=27°C |
4 |
3 |
5 |
8 |
4 |
24 |
|
|
Tot1 |
720 |
720 |
720 |
720 |
720 |
3600 |
|
|
Tmin[ °C] |
15,9 |
13,5 |
15,9 |
15,6 |
18,6 |
|
|
|
Tmax[ °C] |
41,9 |
39,9 |
38,3 |
40,1 |
44,8 |
||
|
Tavr[ °C] |
30,49 |
26,53 |
27,1 |
27,47 |
30,986 |
||
|
Period 3 [16/08_14/09]
Tavr RETS=30,25
T avr S, A=29,305 |
T<18°C |
0 |
0 |
0 |
0 |
0 |
0 |
|
T>18°C |
720 |
720 |
720 |
720 |
720 |
3600 |
|
|
T>27°C |
556 |
549 |
689 |
575 |
655 |
3024 |
|
|
18°C <T<27°C |
164 |
171 |
31 |
145 |
65 |
576 |
|
|
T=18°C |
0 |
0 |
0 |
0 |
0 |
0 |
|
|
T=27°C |
5 |
4 |
4 |
1 |
5 |
19 |
|
|
Tot1 |
720 |
720 |
720 |
720 |
720 |
3600 |
|
|
Tmin[ °C] |
19,3 |
19,5 |
24,5 |
18,2 |
22 |
||
|
Tmax[ °C] |
44,2 |
41,5 |
43,3 |
43 |
41,5 |
||
|
Tavr[ °C] |
31,07 |
30,85 |
34,18 |
31,17 |
32,846 |
||
|
Period 4
[16/11_15/12]
Tavr RETS=13,5
T avr S, A=12,56 |
T<18°C |
624 |
664 |
529 |
626 |
605 |
3048 |
|
T>18°C |
94 |
55 |
182 |
92 |
109 |
532 |
|
|
T>27°C |
0 |
0 |
4 |
0 |
0 |
4 |
|
|
18°C <T<27°C |
94 |
55 |
178 |
92 |
109 |
528 |
|
|
T=18°C |
2 |
1 |
9 |
2 |
6 |
20 |
|
|
T=27°C |
0 |
0 |
2 |
0 |
0 |
2 |
|
|
Tot1 |
720 |
720 |
720 |
720 |
720 |
3600 |
|
|
Tmin [ °C] |
3,6 |
3,7 |
5,1 |
6 |
7,6 |
||
|
Tmax[ °C] |
23,2 |
24,6 |
27,9 |
23,2 |
24 |
||
|
Tmoy[ °C] |
12,79 |
11,81 |
15,19 |
13,21 |
14.3 |
||
Table 6. Evolution of the real humidity of the seasons' limit intervals; of Ghardaïa site, during the last five years from (2012 to 2016), and compared with those of the German Precision Station of (10 minutes) and also with the RET Screen data of (1980-2006)
|
Number of ours |
2012 |
2013 |
2014 |
2015 |
2016 |
Totals |
|
|
Period.1 [14/02_15/03]
Havr RETS=44.4 %
H avr S, A= 42,07 % |
H<25 |
89 |
121 |
69 |
85 |
113 |
477 |
|
H>=76 |
8 |
4 |
16 |
47 |
0 |
75 |
|
|
25<=H<=75 |
623 |
595 |
635 |
588 |
607 |
3048 |
|
|
Totals.1 |
720 |
720 |
720 |
720 |
720 |
3600 |
|
|
H-max % |
80,5 |
80,5 |
90 |
97,5 |
69,15 |
||
|
H-min % |
17,5 |
14,5 |
10,5 |
13 |
15 |
||
|
H-moy % |
40,24 |
35,72 |
44,52 |
44,52 |
37,89 |
||
|
Period.2 [16/05_14/06]
Hmoy RETS=29.1 %
H avr S, A=27,12 % |
H<25 % |
470 |
412 |
303 |
312 |
481 |
1978 |
|
H>=76 % |
0 |
0 |
5 |
0 |
0 |
5 |
|
|
25<=H<=75 % |
250 |
308 |
412 |
408 |
239 |
1617 |
|
|
Totals.2 |
720 |
720 |
720 |
720 |
720 |
3600 |
|
|
H-max % |
43,5 |
56 |
79,5 |
56 |
60,5 |
||
|
H-min % |
7,5 |
6 |
9 |
7 |
7,5 |
||
|
H-avr % |
21,76 |
26,65 |
30,58 |
26,94 |
22,74 |
||
|
Period.3 [16/08_14/09]
Havr RETS=30,45 %
H avr S, A=26,34 % |
H<25 % |
320 |
301 |
471 |
148 |
326 |
1566 |
|
H>=76 % |
0 |
11 |
0 |
11 |
0 |
22 |
|
|
25<=H<=75 % |
400 |
408 |
249 |
561 |
394 |
2012 |
|
|
Totals.3 |
720 |
720 |
720 |
720 |
720 |
3600 |
|
|
H-max % |
68,5 |
90 |
50,5 |
89 |
75,5 |
||
|
H-min % |
9 |
11,5 |
10 |
13 |
14 |
||
|
H-avr % |
27,69 |
31,69 |
22,8 |
35,78 |
26,84 |
||
|
Period.4
[16/11_15/12]
Havr RETS=56.55%
H avr S, A=54.68% |
H<25 |
0 |
16 |
22 |
9 |
4 |
51 |
|
H>=76 |
26 |
120 |
43 |
58 |
121 |
368 |
|
|
25<=H<=75 |
694 |
584 |
655 |
653 |
595 |
3181 |
|
|
Totals.4 |
720 |
720 |
720 |
720 |
720 |
3600 |
|
|
H-max % |
87,5 |
95 |
86,5 |
95 |
95 |
||
|
H-min % |
30,5 |
21 |
20,5 |
20,5 |
24 |
||
|
H-avr % |
53,3 |
56,56 |
49,79 |
55,85 |
58,18 |
||
In Table 7, we see that the average length of spring and autumn are shorter in comparison with summer and winter, represent respectively; 54 days, 52 days, 135 days and 124 days, during the five years study. In the two previous Tables 8 and 9, we note that the full south orientation is better compared to the studied East-South orientation 35° (real state of housing), because the duration of sunshine of hot periods of the latter and more significant than the first (due south). Therefore, there is more consumption linked to air conditioning (same comments for Figures 30, 31, 32 and 33).
Table 7. Average length of each Ghardaïa season [2012-2016]
|
|
Heating diagram |
Air conditioning diagram |
DJC, DJF (Weather) |
Average |
|
Winter |
135 |
127 |
110 |
124 |
|
Springer |
51 |
54 |
58 |
54 |
|
Summer |
138 |
141 |
126 |
135 |
|
Automn |
41 |
43 |
71 |
52 |
|
Totals |
365 |
365 |
365 |
365 |
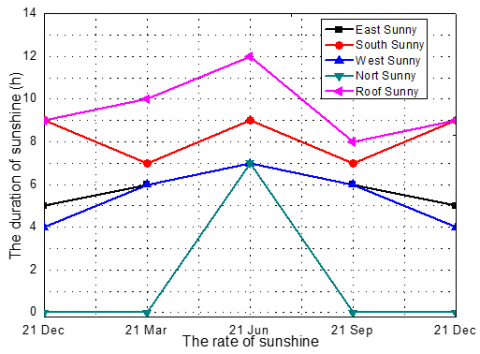
Table 8. Sunrise and sunset at the start of each season; duration of sunshine of each face and the sunshine rate for each face in Ghardaïa, for a clear sky facing south
|
|
Sunrise |
Sunset |
Day length |
Duration of sunshine due south orientation |
|||||||||
|
E |
% |
S |
% |
O |
% |
N |
% |
T |
% |
||||
|
21 D |
07h43’ |
17h44’ |
10h01’ |
05h |
50 |
09h |
90 |
04h |
40 |
00h |
00 |
09h |
90 |
|
21 M |
06h47’ |
18h57’ |
12h10’ |
06h |
50 |
07h |
58 |
06h |
50 |
00h |
00 |
10h |
83 |
|
21 J |
05h39’ |
19h55’ |
14h16’ |
07h |
50 |
09h |
64 |
07h |
50 |
07h |
50 |
12h |
86 |
|
21 S |
06h32’ |
18h42’ |
12h10’ |
06h |
50 |
07h |
58 |
06h |
50 |
00h |
00 |
08h |
67 |
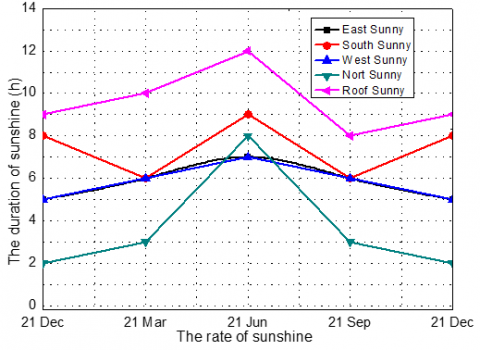
Table 9. Sunrise and sunset at the start of each season; duration of sunshine of each facade as well as the rate of sunshine for each facade in Ghardaïa, for a clear sky east_south orientation with 35 ° [the case study (accommodation location)]
|
|
Sunrise |
Sunset |
Day length |
Duration of sunshine orientation East_South of 35° (real situation) |
|||||||||
|
E |
% |
S |
% |
O |
% |
N |
% |
T |
% |
||||
|
21 D |
07h43’ |
17h44’ |
10h01’ |
05h |
50 |
08h |
80 |
05h |
50 |
02h |
20 |
09h |
90 |
|
21 M |
06h47’ |
18h57’ |
12h10’ |
06h |
50 |
06h |
50 |
06h |
50 |
03h |
25 |
10h |
83 |
|
21 J |
05h39’ |
19h55’ |
14h16’ |
07h |
50 |
09h |
64 |
07h |
50 |
08h |
57 |
12h |
86 |
|
21 S |
06h32’ |
18h42’ |
12h10’ |
06h |
50 |
06h |
50 |
06h |
50 |
03h |
25 |
08h |
67 |
Figure 30. The duration of the sunshine on the surface of each facade during the year (hour) of Full south orientation in Ghardaïa
Figure 31. The duration of the sunshine on the surface of each facade during the year (hour) of East-South Orientation with 35 ° in Ghardaïa [The study case]
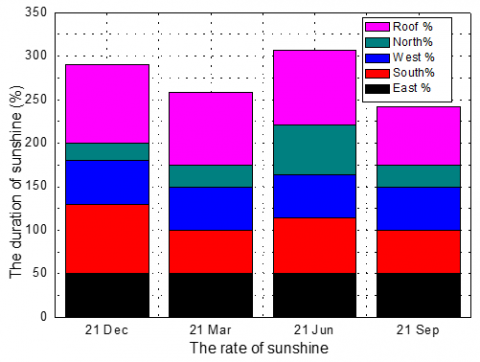
Figure 32. The duration of the sunshine on the surface of each facade during the year (%) of Full south orientation in Ghardaïa
Figure 33. The duration of the sunshine on the surface of each facade during the year (%) of East_South Orientation with 35 ° in Ghardaïa [The study case]
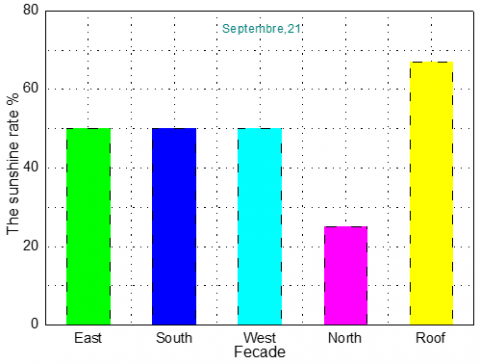
Figure 34. The sunshine rate of each façade on December 21
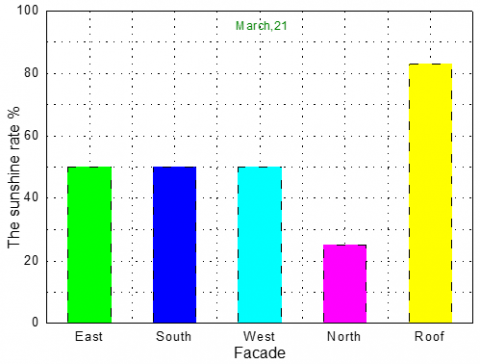
Figure 35. The rate of sunshine of each Facade on March 21
Figure 36. The rate of sunshine of each Facade on June 21
Figure 37. The rate of sunshine of each Facade on September 21
Figure 38. Comfort temperatures as a function of average monthly temperatures 2012, compared with stool [19]
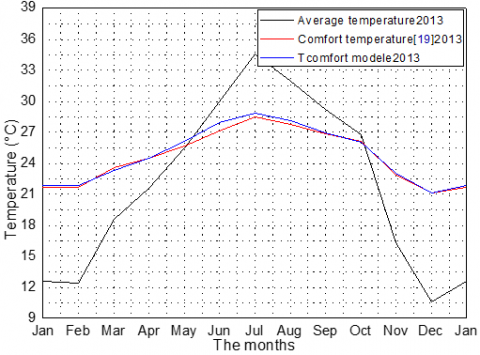
Figure 39. Comfort temperatures as a function of average monthly temperatures for 2013, compared with stool [19]
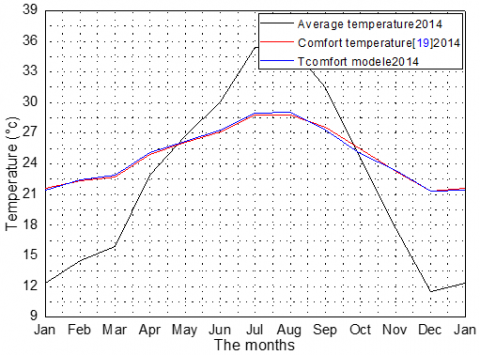
Figure 40. Comfort temperatures as a function of average monthly temperatures for 2014, compared with stool [19]
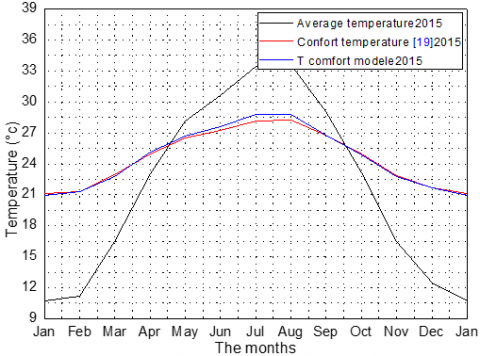
Figure 41. Comfort temperatures as a function of average monthly temperatures for 2015, compared with stool [19]
Table 10. The days of average energy expenditure in all seasons for the five selected years [2012-2016]
|
Period of the Selected five-year seasons [2012_2016] |
Number of day in the selected season |
Number of ours of season |
Number of hours of natural comfort without heating and without air conditioning |
Number of days expenses [heating - air conditioning] |
|
P1[01/12_28/02] |
90 |
2160 |
215h$\approx$9 Day |
81 |
|
P2[01/03_31/05] |
92 |
2208 |
1165h$\approx$49 Day |
43 |
|
P3[01/06_31/08] |
92 |
2208 |
360h$\approx$15 Day |
77 |
|
P4[01/09_30/11] |
91 |
2184 |
927h$\approx$39 Day |
52 |
|
Totals |
365 |
8760 |
112 |
253 |
Table 11. Comfort real temperature in the Ghardaïa region
|
|
2012 |
2013 |
2014 |
2015 |
2016 |
|||||
|
|
Tavr |
Tconf |
Tavr |
Tconf |
Tavr |
Tconf |
Tavr |
Tconf |
Tavr |
Tconf |
|
January |
10.73 |
21.18 |
12.57 |
21.83 |
12.38 |
21.46 |
10.72 |
20.92 |
13.9323 |
22.11 |
|
February |
09.87 |
21.02 |
12.43 |
21.91 |
14.54 |
22.43 |
11.15 |
21.31 |
14.7552 |
22.50 |
|
March |
16.15 |
22.68 |
18.57 |
23.29 |
15.90 |
22.89 |
16.50 |
22.78 |
17.1516 |
23.08 |
|
April |
20.90 |
23.98 |
21.58 |
24.52 |
22.87 |
25.09 |
23.00 |
25.13 |
22.7367 |
24.98 |
|
May |
26.89 |
26.09 |
25.52 |
26.17 |
26.75 |
26.21 |
28.19 |
26.67 |
27.2742 |
26.34 |
|
June |
34.16 |
28.27 |
30.00 |
27.95 |
30.04 |
27.32 |
30.62 |
27.59 |
31.8233 |
27.76 |
|
July |
36.61 |
29.31 |
34.61 |
28.86 |
35.40 |
28.94 |
33.41 |
28.77 |
34.3759 |
28.78 |
|
August |
34.96 |
28.72 |
32.00 |
28.13 |
35.57 |
29.05 |
33.59 |
28.82 |
32.9968 |
28.26 |
|
September |
28.98 |
26.81 |
29.20 |
26.98 |
31.43 |
27.29 |
29.04 |
26.75 |
29.4333 |
27.03 |
|
October |
24.75 |
25.57 |
26.77 |
26.02 |
24.64 |
24.98 |
23.11 |
24.88 |
24.9839 |
25.12 |
|
November |
17.55 |
23.39 |
16.30 |
23.05 |
17.71 |
23.31 |
16.45 |
22.81 |
16.5433 |
23.21 |
|
December |
12.50 |
21.68 |
10.59 |
21.08 |
11.49 |
21.36 |
12.47 |
21.67 |
12.3000 |
21.52 |
Figures 34, 35, 36 and 37 show the rate of sunshine of each Facade on March 21st, June 21st, September 21st and December 21st, however the Comfort temperatures as a function of average monthly temperatures 2012, 2013, 2014 and 2015 compared with stool [19] are presented in the Figures 38, 39, 40 and 41. The days of average energy expenditure in all seasons for the five selected years [2012-2016] are mentioned in the Table 10, where the recapitulation Table 11 presents the comfort real temperature in the Ghardaïa region. All the last figures and tables are presented to enrich and detail the previous explanations.
In this study I determined exactly the real hygrothermal parameters of the Ghardaïa region of each season as well as the daily lengths of; (summer period with 135 days, winter period 124 days, spring 54 days and autumn 52 days) by a new easy graphical method will allow to determine the beginning and the end of each season (an integral method). In this study, we also determine the comfort temperatures of each ego in this region (Ghardaïa). The real determination of the seasons and parameters of the Ghardaïa region give a real solid scientific platform, to decision makers and investors for the development of this region as well as regions of the same climate (Sahara), more than that opened a window on the integration of renewable energies and especially in the thermal field (heating, air conditioning, domestic hot water, etc.).According to this technique, We have proved that the summer period is predominant on the thermal side in our region, follow it by the winter period; This means a mad consumption of the country's energy capacities, which affects not only our economic balance, but also our environment and our living environment. Therefore, the authorities must consider these conditions in the future in their development policies for these regions. The latter made from the integration of new socioeconomic, thermal, ecological and environmental solutions; such as green dams, water dams, nanomaterial, intelligent materials, new bioclimatic cities with low energy consumption, etc. The results clearly showed the moderate spring and fall seasons, which were few in this region. To also combat and remedy high-energy consumption and reduce heat waves; solutions must be found to increase the interval between these seasons (spring and autumn). This new integral method, reliable, modern and profitable, allows determining exactly the heating periods and cooling periods of any zone, region and country.
[1] Belgherras S., Bekkouche, S.M.A., Benouaz, T., Benamrane, N. (2017). Prospective analysis of the energy efficiency in a farm studio under Saharan weather conditions. Energy and Buildings, 145: 342-353. https://doi.org/10.1016/j.enbuild.2017.04.030
[2] Lalmi, D., Benseddik, A., Bensaha, H., Bouzaher, M.T., Arrif, T., Guermoui, M., Rabehi, A. (2019). Evaluation and estimation of the inside greenhouse temperature, numerical study with thermal and optical aspect. International Journal of Ambient Energy, 42(11): 1269-1280. https://doi.org/10.1080/01430750.2019.1594369
[3] Bekkouche, S.M.A., Benouaz, T., Hamdani, M., Cherier, M.K., Yaiche, M.R., Benamrane, N. (2015). Judicious choice of the building compactness to improve thermo-aeraulic comfort in hot climate. Journal of Building Engineering, 1: 42-52. https://doi.org/10.1016/j.jobe.2015.03.002
[4] Bekkouche, S.M.A., Benouaz, T., Cheknane, A. (2009). A modelling approach of thermal insulation applied to a Saharan building. Thermal Science, 13(4): 233-244. https://doi.org/10.2298/TSCI0904233B
[5] Carbonari, A., Naticchia, B., D’Orazio, M. (2015). Innovative evaporative cooling walls, eco-efficient materials for mitigating building cooling needs. In Design, Properties and Applications, pp. 215-240. http://www.sciencedirect.com/science/book/9781782423805.
[6] Stojanovi, B.V., Janevski, J.N., Mitkovi, P.B., Stojanovi, M.B., Ignjatovi, M.G. (2014). Thermally activated building systems in context of increasing building energy efficiency. Thermal Science, 18(3): 1011-1018. https://doi.org/10.2298/TSCI1403011S
[7] Mohamed, Z., Djafer, D., Chouireb, F. (2017). New approach to establish a clear sky global solar irradiance model. International Journal of Renewable Energy Research, 7(3).
[8] Rabehi, A., Guermoui, M., Lalmi, D. (2018). Hybrid models for global solar radiation prediction: a case study. International Journal of Ambient Energy, 41(1): 31-40. https://doi.org/10.1080/01430750.2018.1443498
[9] Khelifi, R., Guermoui, M., Rabehi, A., Lalmi, D. (2018). Multi-step-ahead forecasting of daily solar radiation components in the Saharan climate. International Journal of Ambient Energy, 41(6): 707-715. https://doi.org/10.1080/01430750.2018.1490349
[10] Fang, Z., Li, N., Li, B., Luod, G., Huang, Y. (2014). The effect of building envelope insulation on cooling energy consumption in summer. Energy and Buildings, 77: 197-205. https://doi.org/10.1016/j.enbuild.2014.03.030
[11] Choi, I.Y., Cho, S.H., Kim, J.T. (2012). Energy consumption characteristics of high-rise apartment buildings according to building shape and mixed-use development. Energy and Buildings, 46: 123-131. https://doi.org/10.1016/j.enbuild.2011.10.038
[12] Castellani, B., Morini, E., Filipponi, M., Nicolini, A., Palombo, M., Cotana, F., Rossi, F. (2014). Clathrate, hydrates for thermal energy storage in buildings: Overview of proper hydrate-forming compounds. Sustainability, 6(10): 6815-6829. https://doi.org/10.3390/su6106815
[13] Venko, S., de Ventós, D.V., Arkar, C., Medved, S. (2014). An experimental study of natural and mixed convection over cooled vertical room wall. Energy and Buildings, 68: 387-395. https://doi.org/10.1016/j.enbuild.2013.09.014
[14] Tsikaloudaki, K., Theodosiou, T., Laskos, K., Bikas, D. (2012). Assessing cooling energy performance of windows for residential buildings in the Mediterranean zone. Energy Conversion and Management, 64: 335-343. https://doi.org/10.1016/j.enconman.2012.04.020
[15] Tsikaloudaki, K., Laskos, K., Theodosiou, T., Bikas, D. (2015). The energy performance of windows in Mediterranean regions. Energy and Buildings, 92: 180-187. https://doi.org/10.1016/j.enbuild.2015.01.059
[16] Guermoui, M., Abdelaziz, R., Gairaa, K., Djemoui, L., Benkaciali, S. (2019). New temperature-based predicting model for global solar radiation using support vector regression. International Journal of Ambient Energy. https://doi.org/10.1080/01430750.2019.1708792
[17] Lalmi, D., Bensaha, H., Benseddik, A., Rabehi, A., Guermoui, M., Bouzaher, M.T. (2018). Comparative study of geometrical configuration at the thermal performances of an agricultural greenhouse. International Conference on Renewable Energy (ICREN 2018). https://doi.org/10.1051/e3sconf/20186100003
[18] Tsanasa, A., Xifarab, A. (2012). Accurate quantitative estimation of energy performance of residential buildings using statistical machine learning tools. Energy and Buildings, 49: 560-567. https://doi.org/10.1016/j.enbuild.2012.03.003
[19] Lalmi, D., Bezari, S., Bensaha, H., Guermoui, M., Rabehi, A., Abdelouahab, B., Hadef, R. (2018). Analysis of thermal performance of an agricultural greenhouse heated by a storage system. Modelling, Measurement and Control B, 87(1): 15-20.
[20] Lü, X., Lu, T., Kibert, C.J., Viljanen, M. (2015). Modeling and forecasting energy consumption for heterogeneous buildings using a physical–statistical approach. Applied Energy, 144: 261-275. https://doi.org/10.1016/j.apenergy.2014.12.019