Michael Mengisti | Tekleab Gala* | Girma Birru
© 2021 IIETA. This article is published by IIETA and is licensed under the CC BY 4.0 license (http://creativecommons.org/licenses/by/4.0/).
OPEN ACCESS
A proper development of railway transportation is critical for sustainable socio-economic and environmental benefits. Nonetheless, in Eritrea, a country that once had a vibrant railway system, it is currently nonfunctional. There are also ambitious sectoral investments in neighboring Ethiopia and Sudan, pressing Eritrea to revitalize its decimated railway transportation system. Therefore, this study used population settlement pattern, environmental and physical criteria as inputs to a least-cost multi-criteria decision-making for modeling the railway network for Eritrea. Accordingly, seven railway routes, covering a total of 1, 610 km distance, were modeled. Four are running in the north-to-south directions, while three are running in the east-to-west directions. This railway network will give services to 5 out of 6 Eritrean’s administrative regions, where 93% of the estimated 5.8 million people reside. Additionally, it will service the 21 urban centers, where an estimated population of 1,658,749 live; approximately 70% of Eritrea’s urban population. Besides, it shall boost regional integration, peace, and development thereof, in an otherwise conflict-ravaged geographical region.
spatial analysts (SA), least cost path, multi-criteria decision support, railway transportation, Eritrea, socio-economic, environmental sustainability
Sustainable development of railways transport service is critical for economic growth, regional integration, and social development [1-4]. According to Sugawara [2], a port to heartland railway US railway transportation supports an estimated import and export of 1,839 million tons of freights, which worth $3.193 billion in 2007. Additionally, US agriculture is heavily dependent on the railway transport service such that removing the current railroad networks from the United States, could reduce US agricultural productivity by 60% [4]. Railway transportation service is also critical in reducing traveling time and traffic, ecological health, and improvement of travel comforts [1]. Americans lose 3.7 billion hours and 2.3 Billion gallons of fuel sitting in traffic jams per annum; which is estimated to cost \$200 billion. Improved railroads network expected to reduce highway congestion, fuel consumption, and pollutant emission [2]. Furthermore, a study reported that a 10% increase in the number of populations using passenger trains, would reduce fuel consumption by 50% [3].
Despite all these critical socio-economic benefits, Eritrean railway transport service is nonexistent today. This is despite, historically, Eritrea had a vibrant railway system that goes back to the late 19th century. During the colonial era, Italians constructed a 337 km (i.e., 209 mi) railway that connects the port city Massawa with the gold mine at Bisha west of the town Agordat [5, 6]. However, the country fell under the British military administration in 1941. This is following the defeat of Italy by the allied forces in WWII. Under British administration, Eritrea’s public infrastructures, including the railway were vandalized and embezzled as part of war compensation. Ever since the railway was nonfunctional [7], and hence there is a need to revitalize the modern railway network system for the country.
Additionally, two major neighboring countries, Ethiopia, and Sudan are heavily investing in their railway transport infrastructure nationally and thereby enhance the regional integration. For instance, Ethiopia has built a 750 km (460-mile) railway, recently [8]. It links Addis Ababa, the nation’s capital, to the Red Sea port city of Djibouti. Additionally, Ethiopia has further launched an ambitious national railways network project, which covers a 4,780 km distance [9]. The goal of the ambitious plan is to connect the country with Kenya in the south, Sudan in the west, and Eritrea in the North. Similarly, the Sudan Railway network system is also envisioning an ambitious plan of railway infrastructural development. Sudan Railways Corporation, which currently administers the longest network (i.e., 4,578 km) in the continent of Africa, is planning to expand the network system to its neighboring countries Chad, Ethiopia, and South Sudan [10]. It is in response to these ambitious expansion plans that Eritrea is pressed to revitalize its railway transportation system.
Moreover, several attributes of Eritrea’s unique geographical location, environment, and culture that would attract tourists from all over the world, incentivize a presence of robust railway transportation service in the country. Eritrean has a coastline extended over 1000 km, which is scarcely populated and limited human intervention thereof. Consequently, Eritrea’s shoreline and sand beach are some of the cleanest on earth for international tourists’ attractions. The Red Sea is rich in coral reefs, which providing potential for extensive nature-based tourism for visitors [11]. Unlike other competing shorelines, along the Red Sea, Eritrea’s lowland coastal areas are only two hours from the highlands near Asmara, the capital city, which exhibits a remarkable breath of a cooler temperate climate.
Therefore, the objective of this study was to design and plan a railway network, with a less environmental footprint, for Eritrea. It deployed the multi-criteria least-cost path algorithm for modeling Eritrea’s railway routes to this effect. Additionally, the study assessed the socio-economic and political impacts of the modeled railway transportation service. The traditional railway route planning of manual field engineering surveys is increasingly complemented by modern GIS-assisted techniques for efficiency and quality design [12]. Hence, a modern GIS assisted route planning, embedded in spatial analyst tools, is deployed. Multiple environmental, topographical, social, and cultural criteria were accounted for cost-effective designing and planning of railway routings [13, 14].
2.1 Overview of the study area
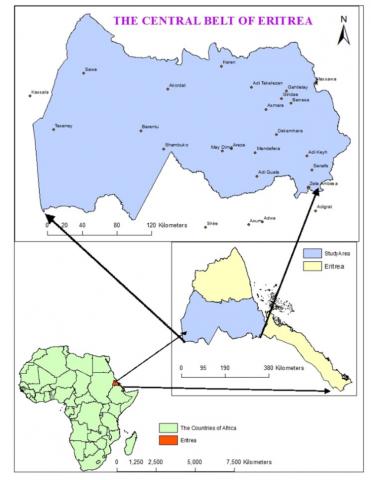
Eritrea is located in North-Eastern Africa (Figure 1). It is bordering Ethiopia and Djibouti in the south, Sudan in the west, and the Red Sea, in the east. The study area covers the central belt of Eritrea, starting from the coastal area from Massawa in the east to the Sudanese border, in the west. It consists of the Maekel zone, Southern Zone, Gash-Barka Zone, Anseba Zone, and Semenawi Keyih Bahri zone administrative regions of Eritrea.
Figure 1. The study area in Eritrea and in the context of Africa
Topographically, the study area is generally mountainous, with a central highland plateau bounded by eastern and western escarpments. The Eastern escarpment start as an abrupt cliff at the edge of the central highland eastward. And then it becomes gentler towards the flat plains of eastern lowlands. Similarly, the western escarpments also become gentler and end at the undulating western lowlands. The elevation of the study area ranges from sea level, at the port city Massawa, to its peak at Emba Soira Mt, which is 3013m (9885 feet) above sea level.
With regards to climate, the coastal lowland areas are hot with an average temperature of 41℃ /106˚F; whereas the highland varies from cool to relatively cold temperature. The coldest months are December and January, with an average temperature of 15.1℃ (59.18˚F). Eritrea’s annual rainfall ranges from 200mm along coastal lowlands to more than 900mm in the Highlands (Climates to travel n.d.). The eastern lowlands receive unpredictable little rain during October through March, while the central and western lowlands get regular rainfall from June through September.
2.2 Research data description
Chang [15] analyzed the various relevant criteria for planning and designing environmentally conscious railway routes and station selection in the least cost multi-criteria modeling algorithm. Accordingly, the nodes of urban centers, environmental, physical, and socio-cultural criteria were considered. The nodes of urban centers are deployed to account for the population distribution, public accessibility, and physical feasibility. The Land Use Land Cover (LULC) types were considered as environmental criteria, while topographic characteristics as the biophysical criteria. Historical, archaeological, and religious sites and other landmarks are socio-economic criteria. These data, except the socio-cultural, were considered for modeling Eritrea’s railway system routing. Data of historical, archaeological, and religious sites and other landmarks are not well developed and available for Eritrea.
2.2.1 Urban center data
These are locations of major urban centers in Eritrea meant to account for population patterns and public accessibility. They are to produce source and destination nodes, which are inputs to the modeling exercises. The urban centers' data were collected from the XY coordinates on Google Earth. The coordinates were then recorded on an excel spreadsheet, before been converted into Text (MS-DOS) format to make it importable to ArcMap 10.4 as XY add event GIS. The GIS event data was spatially referenced into the World Geodetic System of Geographic coordinate system 1984 (i.e., GCS_WGS_1984) and converted to GIS data that was clipped and rasterized for preparation as the source and destination inputs to the modeling.
2.2.2 Topographic variables
Digital Elevation Model (DEM) gives a reliable model to calculate the degree of difficulty imposed by rugged terrains. The Digital Elevation Models (DEMs) were downloaded from the National Map portal of the United States Geological Survey (USGS). The DEMs were acquired by the Advanced Spaceborne Thermal Emission and Reflection Radiometer (ASTER). Ten Digital Elevation Models (DEMs), with 30 meters resolution, were needed to cover the study area. The DEMs were downloaded, stacked together to form a seamless mosaic, and clipped into the study area in preparation for deriving topographic variables need as inputs to the model.
2.2.3 Landsat satellite images
LANDSAT satellite images are acquired to produce LULC data, the environmental criteria needed for modelling. The study opted for legacy images, to choose quality over the currency. The images were captured at the spatial resolution 30m*30m and on Paths 169 and 170 and Rows 48, 49, and 50. These LANDSAT images were downloaded from the United States Geological Survey (USGS) data centre after been georeferenced to the World Geodetic System (WGS) 1984 ellipsoid and the Universal Transverse Mercator (UTM) coordinate system. Five LANDSAT images, enough to cover the study area. The summary of some important details about the LANDSAT Legacy images are found in Table 1.
2.2.4 Landsat satellite images
For this study, national and regional boundaries shapefile maps were acquired as boundary base-maps. These maps were base-maps used as backgrounds for displaying the model’s outputs. They were also used for clipping the produced LULC and topographic characteristics map into the study area. The shapefile data was acquired from the United Nations Office for the Coordination of Humanitarian Affairs (OCHA).
2.3 Research methodology
2.3.1 Terrain analysis
The digital terrain analysis was conducted to specify the topographic characteristics of the study area. It is done using neighborhood and slope toolsets of ArcGIS spatial analyst. While the neighborhood tool is providing a moving window of 3*3 to present context to a specific location, the slope tool calculates the topographic characteristics as rates of change in the topographic gradient (Figure 2). The algorithm utilized for estimating slope gradient is developed [16]. The topographic characteristics, in the horizontal (1) and vertical (2) directions, for 3*3 window of the following elevation data is expressed as:
([dz/dx]) = ((c + 2f + i) - (a + 2d + g) / (8 * x cell size)
([dz/dy]) = ((g + 2h + i) - (a + 2b + c)) / (8 * y cell size)
where: ([dz/dx]) is rate of topographic gradient and a, b, c, d, e, f, g, h, and i are elevation values corresponding to the pixels. The topographic gradient rates were measured in degrees using an algorithm expressed as:
Topographic gradient rates (degrees) = ATAN (√ ([dz/dx]2 + [dz/dy]2)) * 57.29578
where: ATAN is an Arc tangent.
Finally, the topographic gradient rates of the study area were classified into five classes of topographic characteristics using USDA’s standard slope classification system [17].
Figure 2. The 3*3 neighborhood cells of the DEM
2.3.2 Land Use and Land Cover (LULC) mapping
The five LANDSAT images were classified separately. This is because images have different acquisition dates and times with possible varying solar illuminations and irradiation thereof. Supervised image classification was conducted using archived high-resolution Google Earth images for ground-truthing and selecting training samples. In general, training samples were collected for five major LULC types identified and recognized (Table 2). Multiple training samples were collected for each LULC types to account for variabilities within classes.
The training samples used for training an algorithm for image classifier (i.e., Maximum Likelihood Classifier (MLC)) after been evaluated for spectral separability. The MLC algorithm, which allocates pixels based on the likelihood probability of membership to a class, is the most commonly used supervised image classification algorithm [18].
2.3.3 Least cost path for modeling Eritrea railway network
The Least cost path analysis is a multi-criteria decision supporting tool in ArcGIS spatial analyst [19, 20]. It operates on raster data for routing the least cumulative cost of a path (traveling) from a selected source to a destination. The algorithm requires computations of the cost distance, backlink raster (cost direction), and destination node (Figure 3). The cost distance and direction are surface data showing an accumulative cost to a source; based on predetermined source node data and weighted raster (Figure 3). Sources are major urban centers in the areas, while the weighted raster exhibit the cost of traveling between these urban centers through each raster cell. They were computed as a function of selected criteria influencing the cost of designing and planning the railway routing.
Table 1. Specifications of LANDSAT thematic mapper (TM) images
|
Date of acquisition |
1999/10/14 |
1999/10/14 |
1999/11/15 |
2000/01/27 |
2000/01/27 |
|
Image quality |
9 |
9 |
9 |
9 |
9 |
|
WRS Row/ WRS Path |
170/48 |
170/49 |
170/50 |
169/49 |
169/50 |
|
Datum |
WGS84 |
WGS84 |
WGS84 |
WGS84 |
WGS84 |
|
Satellite/ Sensor |
LANDSAT 7/ ETM+ |
LANDSAT 7/ ETM+ |
LANDSAT 7/ ETM+ |
LANDSAT 7/ ETM+ |
LANDSAT 7/ ETM+ |
Table 2. Specifications of the major LULC types identified in the study area
|
Role No. |
Classes of Land use land cover Types |
Descriptions |
|
1 |
Agricultural lands |
Arable lands under various forms of crop farming such as annual and perennial crops and pasture and grasslands. |
|
2 |
Steppe |
Unvegetated lands usually barren, rock out crops, bedrock, desert pavement, where low growths or grasslands accounts for less than 15% of total cover. |
|
3 |
Vegetation areas |
Areas dominated by trees generally greater than 5 meters tall, and greater than 20% of total vegetation cover. More than 75% of the tree species shed foliage simultaneously in response to seasonal change. |
|
4 |
Shrublands |
Lands are forested land dominated by densely populated trees with canopy cover is greater than 20%. |
|
5 |
Waterbodies |
Areas of covered by open water, usually sea, lakes, ponds and etc. |
Figure 3. Figure showing how the model is routing though complex terrains avoiding costly topographic characteristics (a) and land use land cover (LULC) types (b)
In this study, terrain and LULC variables were selected criteria. Between terrain and LULC types, the criteria were weighted in such a way that 67% weight was given to terrain characteristics, while the 33% weight was given to LULC types. The reason is that the study area inherently consists of complex terrains, which would be costlier to model railway than the LULC types unless that LULC type is waterbodies. Waterbodies are considered a complete impediment to modeling railway routings and hence given a 100% weight. Within the terrain criterion, individual classes of topographic characteristics were again weighted. Level to undulating topographies was given a lower coefficient (i.e., cost) compared to the coefficients of hilly and very hilly terrains, which were higher. Similarly, the Steppe LULC types were weighted with a lower coefficient, while Shrublands were intermediate, and agricultural and forested areas were assigned a higher coefficient.
The Cost distance, which represents a surface of the least cumulative cost of getting back to the source, is derived from the combination of cost raster and the source data (i.e., rasterized urban areas). However, cost distance does not tell the optimal routing direction. Hence, the backlink raster (i.e., cost direction) is computed to identify the least cost path-direction to the nearest source. This is similar to cost distance, as both determine minimum travel routing cost from a source to each cell on a raster, but the backlink raster also accounts for horizontal and vertical factors influencing the cost of routing the least cost path.
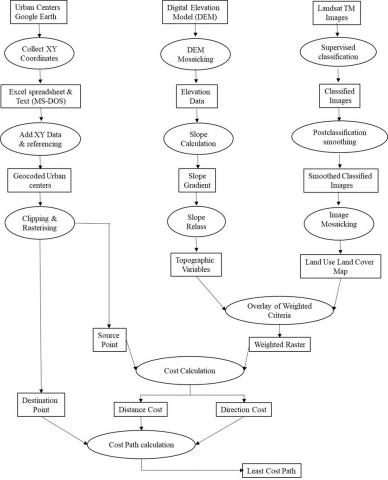
The least-cost path analyses were applied for all urban center nodes to model the least-cost segments. The segments were modeled, progressively, from the eastern port of Massawa, to the urban centers along the Sudanese border. Each least-cost segment was then combined for developing three resultant east-to-west running railway lines. Similar exercises were also conducted to model the least-cost segment connecting the northern cities of the study area to the southern urban cities bordering Ethiopia. Again, each least-cost segment was then combined for developing four North-to-South running railway lines. Detailed flowchart least cost multi-criteria decision making for design and planning Eritrean railway network is described in Figure 4.
Figure 4. Flow Chart of Multicriteria for railway planning and routing for Eritrea
2.3.4 Impacts of the modelled railway network
The least-cost path analyses were applied for all urban centre nodes to model the least-cost segments. The segments were modelled, progressively, from the eastern port of Massawa, to the urban centres along the Sudanese border. Each least-cost segment was then combined for developing three resultant east-to-west running railway lines. Similar exercises were also conducted to model the least-cost segment connecting the northern cities of the study area to the southern urban cities bordering Ethiopia. Again, each least-cost segment was then combined for developing four North-to-South running railway lines. Detailed flowchart least cost multi-criteria decision making for design and planning Eritrean railway network is described in Figure 4.
3.1 Model parameters (variables)
3.1.1 Source destination nodes
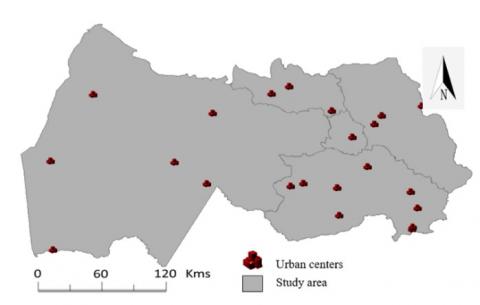
Twenty-one major urban centers were geocoded and rasterized as sources and destination inputs to the least-cost multi-criteria modeling (Figure 5). The urban centers were not uniformly distributed in the study area. More urban centers are in the eastern half compared to the western half of the study area. Additionally, more urban centers (i.e., 7 urban centers) are located in the Debub administrative region, followed by Gash-Bark (i.e., 6 urban centers). Equal urban centers (i.e., 3) are located in the Semenawi Keyih Bahir and Anseba administrative regions; whereas Maekel had one center, which is Asmara, the nation’s capital. The distribution of urban centers is reflective of the population settlement pattern and density.
The major urban centers selected as sources and destinations input are consistent with the E-geopolis list of cities of Eritrea [21]. Seventeen out of the 18 urban areas listed by E-geopolis are geocoded as source and destination model inputs, indicating the representation of population patterns and public accessibility in the modeling exercise. The E-geopolis is the only existing scientific database available for updating our knowledge of cities and urban growth worldwide. Additionally, these urban centers are ten of the eleven largest cities of Eritrea listed by Mongabay population data, again substantiating the sources and destinations accounting of population distribution and physical feasibility in the modeling process [22]. Founded by Rhett Butler, the Mongabay is the database of the world’s largest cities, listed by region and country.
Figure 5. Urban centers that serve as origin and destination nodes
3.1.2 Topographic characteristics
Figure 6 shows the topographies of the complex terrains, multiple slopes, and irregular landscapes of the study area. Five topographic characteristics were identified, namely leveled, undulating, rolling, hilly, and very hilly. It ranges from about 0% slope gradient in some areas to over 60% gradient in the other areas. The level to undulating topography (i.e., 0 – 5%) is the dominant terrain of the study area stretching over 20,687 km2 area, which is 38% of the study area. It is followed by gently rolling landscape (i.e., 5 – 10%), which stretched over 12,894 km2 (i.e., 24%) and the moderately rolling landscape (i.e., 10 – 20%) covered about 9,524 km2 (i.e., 18%). The hilly and very hilly topographies cover 7,848 km2 (14%) and 3,035 km2 (6%), respectively. The latter two hilly and mountainous landscapes make up only 20% of the study area (Table 3) and are found in the eastern and central parts of the study area. The leveled to gently undulating and rolling landscapes, on the other hand, are topographies of the coastal and western lowlands.
Figure 6. Eritrea’s Topographic characteristics
The complex topographies of the study area corroborate reports from other studies in Eritrea [23, 24]. Additionally, it is also consistent with similar landscapes of the neighboring Tigray, northern Ethiopia [25, 26]. For instance, the topographies of Eritrea are highland plateaus in the center; leveled to undulating lowlands in the west; and flatter lowlands in the west [24]. Eritrea’s topographies are also rugged hills and steeply slope in the east and central parts [24]. Additionally, the findings are comparable with complex landforms and landform elements in the adjacent northern highlands of Ethiopia [25]. Gala et al. [25] identified the landscape topographies through a multi-hierarchical classification approach of land system analysis of landscape with similar lithological structures and geology.
Table 3. Topographic characteristics and their respective area coverage in km2 and % coverage
|
Slope % |
Description |
Area (km2) |
Area (%) |
|
0 – 5 |
Level to undulating |
20,687 |
38 |
|
5 – 10 |
Gently rolling |
12,894 |
24 |
|
10 – 20 |
Moderately rolling |
9,524 |
18 |
|
20 – 30 |
Hilly |
7,848 |
14 |
|
Over 30 |
Very hilly |
3,035 |
6 |
3.1.3 Land Use Land Cover (LULC) types
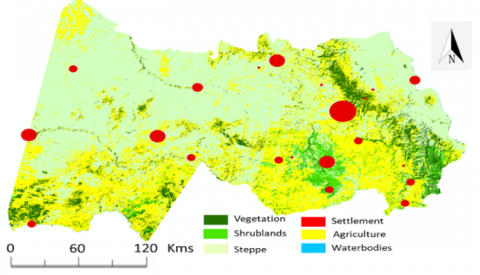
There are five LULC types in the study area (Figure 7). These are Agricultural lands, Steppe, Vegetation, Shrublands, and Waterbodies. The shape of towns and cities (i.e., settlement areas) in a manner proportional to their population size, and was superimposed on the LULC map. The dominant LULC type is Agricultural lands followed by the Steppe vegetation and woodlands (Table 4). Agriculture is stretched over 26,314 km2 area, 46% of the study area; while Steppe is expanded in the northeast and northwest (24, 692 km2) and covering 43% of the study area. Vegetation areas are found on the western escarpment of the great East African rift valley, stretched over 3,979 km2, and cover 7% of the study area. On the other hand, Scrublands are primarily found in the south-central over 2,283 km2, which 4% of the landscape. Settlement areas and Water bodies are found as pocket all over the study area.
Figure 7. The Land use land cover (LULC) types of the study area, with urban centers symbolized proportional to their population size
Table 4. Land use and land cover types and their corresponding area coverage
|
LULC Types |
Area (km2) |
Area (%) |
|
Agriculture |
26,314 |
46 |
|
Vegetation |
3,979 |
7 |
|
Scrublands |
2,283 |
4 |
|
Steppe |
24,692 |
43 |
|
Water bodies |
33 |
~0 |
The LULC types of the study area are comparable to findings of other studies conducted in Eritrea and east African highlands [18, 24, 27, 28]. It recovered 6 of the 9 LULC types identified by the European space agency land cover map for Eritrea [29, 30]. Additionally, the vegetation areas on the western escarpment of East African Rift Valley and the dominant agricultural land use in the southern and southwestern part of the study area are similar to what was reported [24]. It is also parallel with Built-up, rain-fed, and irrigated agriculture, grazing land, plantation vegetation, and water body documented for the central highlands of Eritrea [27].
3.2 Least cost multi-criteria modeling Eritrea railway routes
3.2.1 Modeling the north south railway routes
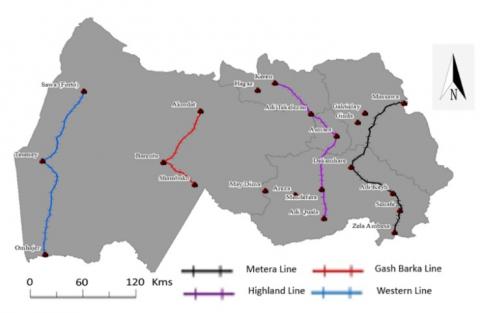
Figure 8 shows the result of the modeled North-to-South railway routes. Accordingly, four major north-south routes were modeled, namely the Metera line, Highland line, Gash Barka line, and Western line. The Metera line, which is named after the Mt. Metera, is a route that is crossing through different cities and towns of Eritrea in the eastern parts. It starts from the port city of Massawa runs to the southeastern border city known as Zalambessa, for 169 km crosses historical cities, such as Qohayto and Belew-Kelew, and the panoramic highlands of Mt. Metera. Notable segments of the route include the 84km segment from Massawa to Dekemhare cities; and the 45 km segment from Dekemhare to Adikeyh cities. It also includes another 21 km segment from Adikey to Senafe and the 19 km segment from Senafe to the final destination Zalambesa, the border city of Eritrea and Ethiopia (Figure 8; Table 5). The second North-to-South route is the Highland line because it cuts through the central highland plateaus of Eritrea. The line starts from the northern city, Keren, the country’s second-most populous city to the southern city of Adiquala near the Ethiopian border. The line also crosses through Asmara the nation’s capital. This route consisted of three segments; namely, the 75 km segment from Keren to Asmara city; the 54 km segment from the city of Asmara to Mendefera, and the 28 km segment from Mendefera to the southern city of Adiquala (Figure 8; Table 5).
Figure 8. Modeled North-to-South railway routes
Table 5. Source and destination nodes and distances of segment of each route on North-to- South modelled railway lines
|
Line Name |
Origin City/Town |
Destination City/Town |
Segment Name |
Segment Distance (Kms) |
LineTotal Distance (Kms) |
|
Metera Line |
Massawa |
Zelambesa |
Massawa- Dekemhare |
84 |
169 |
|
Dekemhare-Adikeyh |
45 |
||||
|
Adikeyh-Senafe |
21 |
||||
|
Senafe-Zelambesa |
19 |
||||
|
Highland Line |
Keren |
AdiQuala |
Keren-Asmara |
75 |
156 |
|
Asmara-Mendefera |
This study has found topographic characteristics, LULC data, and source and destination nodes as physical, environmental, and social input parameters necessary for modeling am environmentally sustainable least-cost railway network. Accordingly, five major LULC classes were found. The dominant LULC class is Agricultural lands (i.e., 46%), followed by Steppe (i.e., 43%). The remaining LULC types expand only on 11% of the study area, indicating their lesser influences in the modeling. Additionally, topographically, the study area mainly consists of level to gently rolling landscape (i.e., 64%), and only 20% is hilly or very hilly topography to pose difficult terrain for routing for railway lines. The least-cost multi-criteria decision support applied for designing and planning a railway network modeled seven major routes. The four routes run North-to-South (i.e., Metera, Highland, Gash Barka, and Western lines), while three run East-to-West (i.e., Senhit, Central, and Belt lines). In general, the modeled railway network system covers an overall distance of 1,610 km, which the capacity of serving five of the six administrative regions constituting 93% of the nearly 5.8 million Eritrean population. It also connects 24 major urban centers and settlement areas with an estimated 1,658,749 population; approximately 70% of the 2,370,492 Eritrea’s urbanites.
These findings are significant to revitalize Eritrea’s railway transportation service decimated over a century ago. It would provide alternative or additional transportation services (i.e., passengers and freights) to Eritrea’s current road, air, and sea transportations; thereby reducing environmental pollution, traffic congestion, and travel time. It also creates opportunities for the agriculture sector generating new internal economic ventures and international trading prospects. The international connection to neighboring countries would identify a tremendous market opportunity that could be involving approximately 160 million people in the horn of Africa. The railway's service is also significant in boosting Eritrean and the broader East African tourism industry, by leveraging the beauty of the landscapes, the region’s socio-cultural and historical richness, diversity, and the hospitality of the indigenous communities. Finally, it is a gateway to the Ethiopia tourism attractions (i.e., Semien Mountains, Axum 4th century A.D. kingdoms and villages, Gonder city and its medieval era civilizations (cathedrals, castles, palaces), and other rare and distinctive UNESCO World Heritage sites.
However, these findings can further be improved with the following considerations. Firstly, the environmentally conscious criteria considered in this study are settlement, elevation, and LULC data. A consideration of more criteria, such as but not limited to, logistical, economic, and cultural in the modeling exercise can improve the outcome. Unfortunately, these criteria are, currently, not available for use. Secondly, the modeling was conducted by connecting every major urban center into source-destination nodes' shortest path line segment. Better alternative routing could be modeled through systematic iterative additions or eliminations. Such iteration can compute the shortest path between all pair of nodes, thereby in effect, produce fewer nodes of relatively shortened segments. Thirdly, routing algorithms are changing in recent years. Advances in these algorithms have brought about methods performing the modeling faster and efficiently than Dijkstra’s algorithm used in the Least Cost Paths modeling adopted in this study. Availability of the various routing algorithms and the advances in the field is the indication that there hasn’t been a single best routing algorithm hitherto. Future research exploring and exploiting alternative and advances in routing algorithms could improve the result of this multi-criteria railway route planning network.
Our heartfelt thanks to the anonymous reviewers of this manuscript. Their constructive feedback has significantly improved the content and presentation of this manuscript. Additionally, the authors are grateful to Google Earth Enterprise, U.S. Geological Survey (USGS), and the United Nations Office for the Coordination of Humanitarian Affairs (OCHA) for the provision of data need for this study. Chicago State University (CSU) and CSU’s GIS laboratory are acknowledged for software provision and Clark lab for some technical supports.
|
˚C |
Degree celsius |
|
˚F |
Degree Fahrenheit |
|
ATAN |
Arc Tangent |
|
DEM |
Digital Elevation Model |
|
ETM+ |
Enhanced Thematic Mapper Plus |
|
GCS |
Geographic coordinate system |
|
GIS |
Geographical Information Systems |
|
m |
meters |
|
km |
kilometers |
|
LULC |
Land Use and Land Cover |
|
MLC |
Maximum Likelihood Classifier |
|
OCHA |
United Nations Office for the Coordination of Humanitarian Affairs |
|
TM |
Thematic Mapper |
|
USDA |
United States Department of Agriculture |
|
USGS |
United States Geological Survey |
|
UTM |
Universal Transverse Mercator |
|
TM |
Thematic Mapper |
|
WGS |
World Geodetic System |
[1] Coatsworth, J.H. (1979). Indispensable railroads in a backward economy: The case of Mexico. The Journal of Economic History, 39(4): 939-960.
[2] Sugawara, J. (2016). Port and hinterland network: a case study of the Crescent Corridor intermodal freight program in the US. Transportation Research Procedia, 25: 916-927. http://dx.doi.org/10.1016/j.trpro.2017.05.466
[3] Lingaitisa, V., Gintaras, S. (2014). Passenger transport by railway: Evaluation of economic and social phenomenon. Social and Behavioral Sciences, 110: 549 559. http://dx.doi.org/10.1016/j.sbspro.2013.12.899
[4] Donaldson, D., Hornbeck, R. (2016). Railroads and American economic growth: A “market access” approach. The Quarterly Journal of Economics, 131(2): 799-858. http://dx.doi.org/10.1093/qje/qjw002
[5] Mitchell, D. (2008). Eritrean Narrow Gauge: An Amazing Reinstatement. Narrow Gauge Branch Lines Series. Midhurst, West Sussex, UK: Middleton Press.
[6] Robinson, Neil (2009). World Rail Atlas and Historical Summary. Volume 7: North, East and Central Africa. Barnsley, UK: World Rail Atlas Ltd.
[7] Yohannes, B.A. (2014). Why the British Looted Eritrea During Its Occupation. Modate. http://www.madote.com/2014/07/why-british-looted-eritrea-during-their.html, accessed on Sep. 4, 2020.
[8] Agence France-Press. (2016). Next stop the Red Sea: Ethiopia Opens Chinese-Built Railway to Djibouti. The Guardian, US Edition. https://www.theguardian.com/world/2016/oct/06/next-stop-the-red-sea-ethiopia-opens-chinese-built-railway-to-djibouti.
[9] Berhane, D. (2017). Ethiopia: Mekelle-Woldya railway project at a Standstill. Horn Affairs. https://hornaffairs.com/2017/05/13/ethiopia-mekelle-woldya-railway-project-standstill/, accessed on 5 May 2020.
[10] Stafford, A. (2018). Sudan Railway Assessment. Logistics Capacity Assessments (LCAs). https://dlca.logcluster.org/display/public/DLCA/2.4+Sudan+Railway+Assessment;jsessionid=D329EDFA5DADFB3D09DE7630E6A77E1C, accessed on Dec. 3, 2018.
[11] Rauer, Elizabeth. n.d. (2020). Coral Reef Biodiversity in the Red Sea. The Khaled bin Sultan Living Oceans Foundation. Retrieved from https://www.livingoceansfoundation.org/red-sea-coral-reef-biodiversity/, accessed on Mar. 5, 2020.
[12] Chen, H.M., Ulianov, C., Shaltout, R. (2015). 3D laser scanning technique for the inspection and monitoring of railway tunnels. Transport Problems, 10. http://dx.doi.org/10.21307/tp-2015-063
[13] Djenaliev, A. (2007). Multicriteria decision making and GIS for railroad planning in Kyrgyzstan. http://kth.diva-portal.org/smash/record.jsf?pid=diva2%3A1065447&dswid=4038.
[14] De Luca, M., Dell’Acqua, G., Lamberti, R. (2012). High-speed rail track design using GIS and multi-criteria analysis. Procedia-Social and Behavioral Sciences, 54: 608-617. http://dx.doi.org/10.1016/j.sbspro.2012.09.778
[15] Chang, Kang-Tsung. (2016). Introduction to Geographic Information System. 8th Edition. New York, NY: McGraw-Hill Education.
[16] Burrough, P.A., McDonell, R.A. (1998). Principles of Geographical Information System. New York: Oxford University Press.
[17] USDA Soil Science Division. (2017). Landscapes, Geomorphology, and Site Description. In C. Ditzler, K. Scheffe, and H.C. Monger (eds.). Soil survey manual. USDA Handbook 18. Government Printing Office, Washington, D.C.
[18] Boakye, L., Gala, T. (2021). Monitoring environmental changes and their drivers: The Case study of central Ethiopian highlands. Journal of Geosciences and Geomatics, 9(1): 1-9. http://dx.doi.org/10.12691/jgg-9-1-1
[19] Gonçalves, A.B. (2010). An extension of GIS-based least-cost path modelling to the location of wide paths. International Journal of Geographical Information Science, 24(7): 986-993. http://dx.doi.org/10.1080/13658810903401016
[20] Riad, P., Billib, M., Hassan, A., Salam, M., El Din, M. (2011). Application of the overlay weighted model and Boolean logic to determine the best locations for artificial recharge of groundwater. Journal of Urban and Environmental Engineering, 5(2): 57-66. http://dx.doi.org/10.4090/juee.2011.v5n2.057066
[21] Geopolis. (2012). Geopolis Data - 2012 Revision. E-Geopolis Institute. https://arquivo.pt/wayback/20141127095822mp_/http://www.e-geopolis.eu/africapolis/Rubrique70_Metadata/FICHE_PAYS_ERYTHREE.pdf, accessed on Dec. 22, 2020.
[22] Mongabay. (2019). World population data. Largest cities in Eritrea. Mongabay.org. https://population.mongabay.com/population/eritrea/, accessed on Dec. 22, 2020.
[23] Mihretab, G.G., Yang, T.B., Yang, X.M., Masihulla, K. (2019). Extracting and analyzing forest and woodland cover change in Eritrea based on Landsat data using supervised classification. The Egyptian Journal of Remote Sensing and Space Science, 19(1): 37-47. https://doi.org/10.1016/j.ejrs.2015.09.002
[24] Measho, S., Chen, B., Trisurat, Y., Pellikka, P., Guo, L., Arunyawat, S., Tuankrua, V., Ogbazghi, W., Yemane, T. (2019). Spatio-temporal analysis of Vegetation dynamics as a response to climate variability and drought patterns in the Semiarid Region, Eritrea. Remote Sensing, 11(6): 724. https://doi.org/10.3390/rs11060724
[25] Gala, T.S., Pazner, M., Beyene, S. (2011). Evaluating biophysical attributes of environmentally degraded landscapes in northern Ethiopia using LANDSAT ETM data and GIS. Ethiopian Journal of Environmental Studies and Management, 4(1). http://dx.doi.org/10.4314/ejesm.v4i1.1
[26] Machado, M.J. (2015). Geomorphology of the Adwa District. In Landscapes and Landforms of Ethiopia, pp. 163-178. Springer, Dordrecht.
[27] Tewolde, M.G., Cabral, P. (2011). Urban sprawl analysis and modeling in Asmara, Eritrea. Remote Sensing, 3(10): 2148-2165. http://dx.doi.org/10.3390/rs3102148
[28] Gala, T., Boakye, L. (2020). Spatiotemporal analysis of remotely sensed Landsat time series data for monitoring 32 years of urbanization. Int. J. Hum. Capital Urban Manage, 5(2): 85-98. http://dx.doi.org/10.22034/IJHCUM.2020.02.01
[29] FAO GeoNetwork. (2002). Multipurpose Landcover Database for Eritrea - AFRICOVER. 2002. http://www.fao.org/geonetwork/srv/en/main.home?uuid=a85d886a-8541-4cf494268069d3154e07, accessed on Jan. 22, 2020.
[30] Di Gregorio, A., Latham, J. (2009). AFRICOVER land cover classification and mapping project. Land Use, Land Cover and Soil Sciences, 1: 236-251.
[31] World Population Review. (2020) Population of Cities in Eritrea. World Population Review. https://worldpopulationreview.com/countries/cities/eritrea/. accessed on Sep. 4, 2020.
[32] Cao, J., Xiaoyue C.L., Yinhai W., Qingquan L. (2013). Accessibility impacts of China’s high-speed rail network. Journal of Transport Geography, 28: 12-21. https://doi.org/10.1016/j.jtrangeo.2012.10.008