Mohamed Douak* | Noureddine Settou
© 2021 IIETA. This article is published by IIETA and is licensed under the CC BY 4.0 license (http://creativecommons.org/licenses/by/4.0/).
OPEN ACCESS
In these present days, the electricity consumption of buildings represents 43% of the total energy produced by fossil fuels in Algeria. This issue could be greatly reduced by using renewable energy to generate the required electricity. However, a bigger challenge facing electricity coming from renewable energy systems are the irregular existence of these sources, as well as the issues of storage and transport. In order to solve these problems, this paper proposes a model of an efficient hybrid system consisting of photovoltaic panels (PV), wind turbines (WT) and fuel cell (FC) elements which will be able to meet the demand for a typical off-grid house located in the Adrar region (Algeria) in a sustainable way. The mathematical model used considers the sub-models of each component of this hybrid system, the reliability criteria. Afterward, the optimal configuration is determined on the basis of the minimum total annual cost TAC. The results of the optimization suggest that, relative to hybrid PV/FC or WT/FC, a PV /WT/FC configuration is more economically feasible for the Adrar site (Algeria).
hybrid systems, total annual cost, relative excess power generated, power supply probability
Global energy demand has risen throughout all sectors worldwide [1], and it is estimated to increase by 53% in 2035 [2]. Actually, more than 80% of the energy used in different sectors is coming from traditional energy sources. Which will result in air pollution and global warming. Moreover, the availability of fossil fuels is 70 years at the current rate of use [3]. So, the biggest problem is how to sustainably handle and satisfy the growing demand?
The move towards renewable energy seems to be a promising option [4, 5]. Among all types of renewable energies, solar and wind energies are the best solution for producing clean electrical power for off-grid houses [6]. However, the common disadvantages of these energies are their stochastic nature and their variations that may not correspond to the hourly requirement of the load. Thus, an energy storage device is required to avoid these drawbacks of a solar /wind power system. Various types of storage systems have been proposed such as battery bank [7], and hydraulic storage system [8]. Recent researchers work has focused on hydrogen to store the overproduction of electricity [9, 10].
The integration of a PV panels, wind turbines and fuel cell lead to get a reliable power system. In this system, the excess electric power of the PV and WT generators is used to supply the electrolyzer for producing hydrogen; this hydrogen production would be considered as another source and can then be used to supply a FC when the demand is high.
To use the hybrid system efficiently and economically, an optimum configuration is needed. In this way, various optimization techniques have been developed such as a graphical construction method, linear programming, probabilistic approach, iterative, and heuristic technique. In the previous works, the system reliability studies have taken into account only one kind of technological reliability such as the energy deficiency. While in the present study, the system reliability takes in consideration the relative excess of power generated (REPG) and the losses of power supply probability (LPSP) during the dynamic operation of the hybrid power system.
In this study, the iterative optimization approach based on technical reliability criteria, as well as, the total annual cost TAC was used to obtain the optimal configuration of the hybrid power system proposed, and to satisfy the energy load requirements of an off-grid home situated in the Adrar region (Algeria). The originality aspects of the proposed systems are: investigating the feasibility of the combination between PV panels, wind turbines and hydrogen for the development of a new energy system. In addition, analyzing and comparing the energy behavior of each system, testing the use of (FC/electrolyzer/H2 tank) as a backup storage system.
The PV/ WT/FC hybrid system configuration considered is presented in Figure 1. This configuration includes a monocrystalline-type PV subsystem (PVs), a horizontal-axis wind turbine generator (WTG), a PEM fuel cell subsystem (FC), an electrolyzer, a hydrogen tank, four dedicated grid converters (DC/DC), and an inverter (DC/AC). The PEM electrolyzer operates at 1.2 bar, while most PEM electrolyzer operate at 30 bar and do not use a compressor [11, 12]. In addition, the PEM electrolyzer becomes an attractive option, especially in the case where hydrogen requires a storage system [13]. In this article, the electrolyzer is directly connected to a hydrogen storage tank. The system operation mode is as follows: The power generated by PV and WT feeds the load, and when their power generated is more than the load demand, the power is directed towards the electrolyzer for hydrogen storage in H2 tanks. In the case of a power production deficit, the FC resumes the production of energy using the hydrogen from the tank and when the state of charge of the hydrogen tank reaches its maximum value, the control system stops the charging process.
Figure 1. PV/WT/FC hybrid system configuration
3.1 Wind turbine model
For a typical wind turbine and at wind speed V(t), the output power PWT can be simulated by [14].
${{P}_{WT}}\left( t \right)=\left\{ \begin{align} & 0\text{ }V\left( t \right)<{{V}_{cut-in}} \\ & {{P}_{r}}\frac{{{V}^{2}}\left( t \right)-V_{_{cut-in}}^{2}}{V_{r}^{2}-V_{_{cut-in}}^{2}}\text{ }{{V}_{cut-in}}\le V\left( t \right)\le {{V}_{r}} \\ & {{P}_{r}}\text{ }{{V}_{r}}\le v\left( t \right)\le {{V}_{cut-out}} \\ & \text{0 }V\left( t \right)>{{V}_{cut-out}}\text{ } \\\end{align} \right.$ (1)
where, Vcut-in=2.5m/s, Vr=11m/s, Vcut-out=13m/s, Pr=1kW are the starting, nominal, cut-off wind speeds and nominal power respectively.
3.2 PV generator model
At a solar radiation G (W/m2), the power (PPV) produced by the tilted plane module is given by [15]:
${{P}_{PV}}={{P}_{r-pv}}\frac{G\left( t \right)}{{{G}_{r}}}\left[ 1+{{F}_{t}}\left( {{T}_{a}}+\frac{25.6G\left( t \right)}{1000}-{{T}_{r}} \right) \right]$ (2)
where, Pr-pv is the rated power under the reference radiation Gr equals 1000W/m2, and the reference temperature Tr equals 25℃, Ft is -3,6.10-3(1/℃), and Ta is the ambient temperature.
3.3 Fuel cell (FC)/electrolyzer
The equivalent hydrogen energy is taken from the electrolyzer and stored in the hydrogen tank. When the energy recorded by the system (WT/PV) exceeds the load demand at time t, the production of the electrolyzer will be directed to storage, which is described by Eq. (3).
${{E}_{st}}\left( t \right)={{E}_{st}}\left( t-1 \right)+\left[ {{E}_{g}}\left( t \right)-{{{E}_{Load}}\left( t \right)}/{{{\eta }_{inv}}}\; \right].{{\eta }_{el}}$ (3)
where, ESt(t) and ESt(t-1) are the energy stored in the form of hydrogen at times t and t-1 respectively, Eload is the energy required by the load, ηinvis the inverter efficiency, ηel is the efficiency of the electrolyzer and Eg(t) is the energy generated by NPV panels (EPV) and NW turbines (EW) at time t, and it is given by:
${{E}_{g}}\left( t \right)={{N}_{PV}}{{E}_{PV}}\left( t \right)+{{N}_{W}}{{E}_{W}}\left( t \right)$ (4)
The FC provides the load when the demand is greater than the energy supplied by the WT/PV system. In this case, the energy equivalent the quantity of hydrogen in the tank is obtained by:
${{E}_{st}}\left( t \right)={{E}_{st}}\left( t-1 \right)-\left[ {{{E}_{Load}}\left( t \right)}/{{{\eta }_{inv}}}\;-{{E}_{g}}\left( t \right) \right]/{{\eta }_{FC}}$ (5)
where, ηFC represents the overall performance of the FC and its DC/DC converter. When the energy produced by the PV systems and the wind turbines is greater than the load demand. As well as, the state of tank reaches a maximum value Estmax, the control system ends the charging process. Therefore, there will be no energy provided by the FC. In addition, there will be no energy deficit in this case. However, the energy to be discharged equals the difference between the energy generated by the PV/WT system and the load demand, the induced excess power generation (EPG) can be calculated as follows:
$EPG\left( t \right)={{E}_{g}}\left( t \right)-{{{E}_{Load}}\left( t \right)}/{{{\eta }_{inv}}}\;+\left( {{E}_{st\max }}-{{E}_{st}}\left( t-1 \right) \right)/{{\eta }_{el}}$ (6)
when the H2 tank is at its minimum level Estmin, the control system disconnects the load. Then this deficit, called lost power supply (LPS) at time t can be calculated by:
$LPS\left( t \right)={{E}_{Load}}\left( t \right)-({{E}_{g}}\left( t \right)+({{E}_{st}}\left( t-1 \right)-{{E}_{st\min }}){{\eta }_{FC}}){{\eta }_{inv}}$ (7)
The mass of hydrogen mst stored is calculated by [11]
${{m}_{st}}\left( t \right)={{E}_{st}}\left( t \right)/HH{{V}_{{{H}_{2}}}}$ (8)
where, the higher hydrogen heating value (HHVH2) is equivalent to 39.7 kWh/kg.
The system’s reliability of this work is determined in terms of (LPSP) and (REPG), that can be defined as follows [12]:
$REPG\left( t \right)={\sum\limits_{t=1}^{T}{EPG\left( t \right)}}/{\sum\limits_{t=1}^{T}{{{E}_{Load}}\left( t \right)}}\;$ (9)
$LPSP={\sum\limits_{t=1}^{T}{LPS\left( t \right)}}/{\sum\limits_{t=1}^{T}{{{E}_{Load}}\left( t \right)}}\;$ (10)
The primary aim of this section is to minimize the total annual cost (TAC) of the system, which consists of the annual investment cost (CAC), annual replacement cost (Carep), and annual maintenance cost (CO&M). So, the TAC is given by the following equation:
$TAC={{C}_{AC}}+{{C}_{arep}}+{{C}_{O\And M}}$ ($/yr) (11)
The annual investment cost (CAC) of the system is defined by [13].
${{C}_{AC}}={{C}_{IC}}.CRF={{C}_{IC}}\frac{i{{\left( 1+i \right)}^{n}}}{{{\left( 1+i \right)}^{n}}-1}$ (12)
where, i (5%) is the annual interest rate and n denotes the system’s lifetime (20 years), CIC represents the primary investment cost of the system which includes the price of each component plus 20% of components price for the civil works, and connection cables. In addition, during the project lifetime, the annual maintenance cost of each element is assumed to be constant (see Table 1).
The annualized replacement cost Carep can be defined as follow [13]:
${{C}_{arep}}={{C}_{rep}}\frac{i}{{{\left( 1+i \right)}^{nr}}-1}$ (13)
where, nr is the lifetime of the replaced component.
The economic data of the components used in the present study is given in Table 1.
Table 1. Description data of selected components
|
Description |
Price ($) |
CO&m |
Life span (year) |
|
PV Panel |
480.00 |
0 $/year |
20 |
|
WT |
4.10 |
2% of price |
20 |
|
FC |
19.41 |
10$/kW/year |
5 |
|
Electrolyzer |
20 |
10$/kW/year |
5 |
|
H2 tank |
2 |
0 $/year |
20 |
|
Converter/inverter |
2 |
0 $/year |
10 |
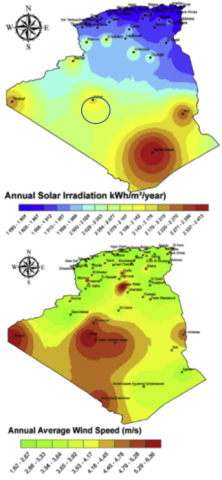
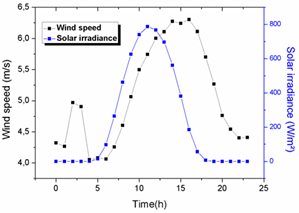
The proposed model was applied to design a hybrid PV/WT/FC system, designed to generate electricity for residential households situated in the Adrar province of Algeria. Figure 2 shows the geographical location of Adrar region. As well as the annual average of the global horizontal solar irradiation and the annual average of wind speed. It also shows that this region has a considerable solar and wind energies, particularly wind energy. The data from which the optimization problem solved are obtained from the database of METEONORM software (from 1983 to 2015), it consists of the hourly average data of solar radiation on the horizontal plane surface and the hourly average speed of wind at the height of 10 m as shown in Figure 3. The originality of the load profile data presented in the Figure 4 is studied by Blal et al. [16], For all days of the year this profile is considered the same and corresponds to the load profile that usually found in the regions located in the south of Algeria.
Figure 2. Annual average of the global horizontal solar irradiation and Annual average of wind speed of Algeria –cordinates of Adrar (latitude: 27,90, longitude: -0,20°) [16]
Figure 3. Annual average hourly renewable resources in Adrar site
Figure 4. Annual average hourly load in Adrar site
To evaluate the performance of the proposed approach, a program developed in FORTRAN language to determine the optimal size of each configuration's components. In this program, all configurations of PV/WT/FC-based hybrid system which satisfy the rate of 0% of LPSP and 0% of REPG are retained. However, only one optimal configuration is predicted on the basis of the minimum cost. In this study, PV/FC and WT/FC are also considered for investigation. The minimum and maximum number of each component is defined on the interval [0 - 100]. In addition, at the initial moment, the hydrogen tank state is 30% of its maximum capacity.
After the technical process, the optimal hybrid system size for zero Lost Power Supply Probability and zero Excess Power Generation Probability are given in Table 2. These configurations are considered as the optimal one that meet the required system reliability condition for the lowest TAC.
Table 2. Optimal dimensioning of the hybrid systems
|
Description |
NPV |
NW |
Ntank |
Ninv |
TAC ($/year) |
|
Wind/PV/FC |
3 |
14 |
22 |
5 |
13221.4 |
|
PV/FC |
86 |
0 |
94 |
4 |
22750.62 |
|
FC/Wind |
0 |
15 |
23 |
4 |
13410.85 |
On the other hand, the examination of Table 2 shows that the lowest TAC is found when the capacity of storage takes a minimum value because H2 tank is much more expensive.
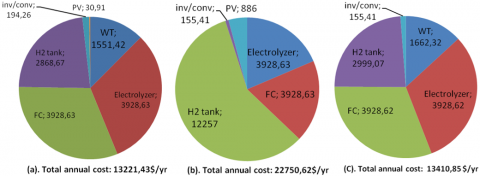
The total annual cost (TAC) presented in Table 2 demonstrates that the lower cost is given by PV/WT/FC system and the higher one is given by PV/FC system, because it needs a high capacity of storage (94 tank of H2). In addition, Table 2 shows that there is a bit difference between the TAC of WT/FC and the PV/WT/FC system. Moreover, Figure 5b shows that for the PV/FC system, the cost of H2 tank is 12257 $/yr. Whereas, Figure 5a-5c shows that the cost of H2 tank of WT/FC and PV/WT/FC systems are 2868.67 $/yr and 2999.07 $/yr respectively. Consequently, the combination between the WTs and the hydrogen storage system is more benefic than PV/hydrogen combination.
As shown in Figure 5, the annual cost of the FC and the electrolyzer are the same for the three systems. Thus, the breakdown of the yearly overall expense ($/yr) of the components of each system shows that the component which has the highest cost for the three systems is the H2 tank, especially, in the case of PV/FC system where the cost of storage system represents more than 50% of TAC.
Figure 5. Breakdown of the yearly overall expense ($/yr). (a) WT /PV /Fuel cell; (b) PV/Fuel cell; (c) WT/Fuel cell
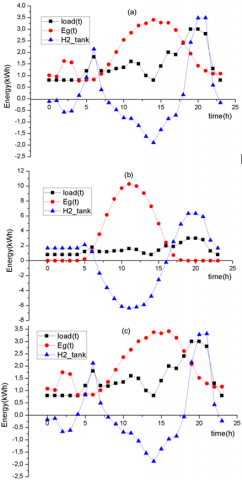
The hourly energy balance of the optimal hybrid power systems studied above is illustrated in Figure 6. The negative sign corresponding to the curve of the hydrogen tank means that the electrolyzer is in “ON” position and that the tank stores the excess power generated by the supply system. While the positive sign means that the hydrogen tank supplies the power deficit of the load, it means also that the power generated (Eg) by the supply system cannot fulfil the load. Thus, the fuel cell begins to operate in order to meet the load demand. Furthermore, Figure 6 illustrates a good matching between the load demand, electrolyzer, PV/WT generation and FC. As a summary to the analysis of the three systems shown in Figure 6, the energy balances of the first and the third one are quasi similar. Whereas, the second one is different from them.
The total energy consumed by the load is the same in the three systems, and it is 35.53 kWh. Table 3 presents the total energy produced by the three systems. As well as, the total energy consumed by the electrolyzer, the energy supplied from the FC, and the lost energy. For the same load (35.53 Kwh), the energy produced by the second system is bigger than that produced by the first and the second ones. In addition, the same remark is observed concerning the energy consumed by the electrolyzer and that produced by the FC. However, the lost energy is almost the same for the three systems.
Figure 6. Hourly energy balance for the optimal hybrid systems. (a) WT /PV /Fuel cell; (b) PV/Fuel cell; (c) WT/Fuel cell
Table 3. Hourly energy balance of the hybrid systems (kWh)
|
Description |
Eg |
Electro-lyzer |
FC |
Lost energy |
|
1-Wind/PV/FC |
46 |
15.45 |
6.9 |
1.92 |
|
2-PV/FC |
73.92 |
57.56 |
21 |
1.83 |
|
3-FC/Wind |
46.5 |
15.42 |
6.32 |
1.87 |
Figure 7 presents the difference between the energy produced and requested at the time t (ΔE(t)= Eg(t)-Eload(t)) of the three optimized systems, the negative sign of ΔE indicates that the energy generated by the PV/WT system is not enough to supply the load. So, the storage system should be used to meet the remaining load demand as shown in Figure 8. For example, at 8: 00 p.m. ∆E is negative (Figure 7) in the three systems. At this time, it is seen that the storage level of the hydrogen tank is positive as shown in Figure 8. This means that the storage device supplies the deficit power via the FC. In addition, from Figure 7 and Figure 8 it can be seen that, the curve of (WT/PV/FC) system and that of (WT/FC) are closely similar because the energy generated by the both comes closely from the same source (wind energy) as presented by the Table 2.
Figure 7. Difference between generated and demanded power
Figure 8. Storage level of hydrogen tank
The present study proposes a global methodology that resulted in the optimal sizing of a stand-alone hybrid system (PV/WT/FC) that can be used in rural electrification of remote sites. The development of a technical-economic approach is achieved using reliability models under the definition of total deficit power (LPS) and the economic model centered on the cost estimate. The combination of these two models leads to the optimal configuration ensuring total autonomy of the most cost-effective system. By applying this method, all configurations that give the 0% rate for LPSP and REPG are retained. This study shows that the PV/Wind/FC system is the optimal solution for the Adrar site.
|
CAC |
annual investment cost, $/year |
|
Carep |
annual replacement cost, $/year |
|
CO&M |
operating and maintenance cost, $/year |
|
CIC |
inicial investment cost, $/year |
|
CRF |
capital recovery factor |
|
Eload |
energy required by the load, kWh |
|
EPV |
energy generated by the PV panels, kWh |
|
Eg |
energy generated by PVs and WTs, kWh |
|
EW |
energy generated by the WTs, kWh |
|
Es |
energy stored in the form of H2, kWh |
|
Ft |
constant, ºC -1 |
|
G |
solar radiation, W.m-2 |
|
Gr |
reference solar radiation, W.m-2 |
|
HHVH2 |
higher heating value of H2, kWh.kg-1 |
|
i |
annual interest rate, % |
|
mst |
masse of H2, kg |
|
n |
system’s lifetime, year |
|
nr |
lifetime of the replaced component, year |
|
PPV |
output power of the PV panel, kW |
|
Pr-PV |
rated power of the PV panel, kW |
|
Pr-WT |
rated power of the WT, kW |
|
PWT |
output power of the WT, kW |
|
t |
time, hour |
|
Ta |
ambiant temperature, ℃ |
|
Tr |
reference temperature, ℃ |
|
V |
wind speed, m.s-1 |
|
Vcut-in |
cut-in wind speed, m.s-1 |
|
Vcut-out |
cut-out wind speed, m.s-1 |
|
Vr |
rated wind speed, m.s-1 |
|
Greek symbols |
|
|
ηel |
efficiency of the electrolyzer, % |
|
ηinv |
efficiency of the inverter, % |
|
ηFC |
efficiency of the fuel cell, % |
|
Subscripts |
|
|
AC |
alternative current |
|
DC |
direct current |
|
FC |
fuel cell |
|
H2 |
hydrogen |
|
LPSP |
losses of power supply probability |
|
NPV |
number of PV panels |
|
NW |
number of wind turbins |
|
PV |
photovoltaic |
|
REPG |
relative excess of power generation |
|
WT, WTG |
wind turbine generator |
[1] Ghedamsi, R., Settou, N., Gouareh, A., Khamouli, A., Saifi, N., Recioui, B. (2016). Modeling and forecasting energy consumption for residential buildings in Algeria using bottom-up approach. Energy and Buildings, 121: 309-317. https://doi.org/10.1016/j.enbuild.2015.12.030
[2] Matsuo, Y., Yanagisawa, A., Yamashita, Y. (2013). A global energy outlook to 2035 with strategic considerations for Asia and Middle East energy supply and demand interdependencies. Energy Strategy Reviews, 2(1): 79-91. https://doi.org/10.1016/j.esr.2013.04.002
[3] Rahman, M.M., Mostafiz, S., Paatero, J.V., Lahdelma, R. (2014). Extension of energy crops on surplus agricultural lands: A potentially viable option in developing countries while fossil fuel reserves are diminishing. Renewable and Sustainable Energy Reviews, 29: 108-119. https://doi.org/10.1016/j.rser.2013.08.092
[4] Abbasi, T., Abbasi, S.A. (2011). Renewable” hydrogen: Prospects and challenges. Renewable and Sustainable Energy Reviews, 15(6): 3034-3040. https://doi.org/10.1016/j.rser.2011.02.026
[5] Shafiei, E., Davidsdottir, B., Leaver, J., Stefansson, H. (2017). Asgeirsson EI. Energy, economic, and mitigation cost implications of transition toward a carbon-neutral transport sector: A simulation-based comparison between hydrogen and electricity. Journal of Cleaner Production, 141: 237-247. https://doi.org/10.1016/j.jclepro.2016.09.064
[6] Manukonda, D., Gorantla, SR. (2019). Design and comparison of standalone bladeless wind solar hybrid system with the conventional standalone wind solar hybrid system. European Journal of Electrical Engineering, 21(3): 327-232. https://doi.org/10.18280/ejee.210310
[7] Maouedj, R., Benmedjahed, M., Saba, D., Mamemri, A., Barbaoui, B., Bezari, S. (2019). Experimental analysis of a stand-alone wind-photovoltaic hybrid system in the Sahara Desert. European Journal of Electrical Engineering, 21(1): 93-97. https://doi.org/10.18280/ejee.210114
[8] Chenna, A., Aouzellag, D.G.K. (2020). Journal Europé en des Systèmes Automatisés, 53: 95-102.
[9] Li, C. (2019). Techno-economic study of off-grid hybrid photovoltaic/battery and photovoltaic/battery/fuel cell power systems in Kunming, China. Energy Sources, Part A: Recovery, Utilization, and Environmental Effects, 41(13): 1588-1604. https://doi.org/10.1080/15567036.2018.1549134
[10] Brka, A., Al-Abdeli, YM., Kothapalli, G. (2016). Predictive power management strategies for stand-alone hydrogen systems: Operational impact. International Journal of Hydrogen Energy, 41(16): 6685-6698. https://doi.org/10.1016/j.ijhydene.2016.03.085
[11] Kashefi Kaviani, A., Riahy, G.H., Kouhsari, S.M. (2009). Optimal design of a reliable hydrogen-based stand-alone wind/PV generating system, considering component outages. Renewable Energy, 34: 2380-2390. https://doi.org/10.1016/j.renene.2009.03.020
[12] Kaabeche, A., Ibtiouen, R. (2014). Techno-economic optimization of hybrid photovoltaic/wind/diesel/battery generation in a stand-alone power system. Solar Energy, 103: 171-182. https://doi.org/10.1016/j.solener.2014.02.017
[13] Al Zohbi, G., Hendrick, P., Bouillard, P. (2015). Wind characteristics and wind energy potential analysis in five sites in Lebanon. International Journal of Hydrogen Energy, 40(44): 15311-15319. https://doi.org/10.1016/j.ijhydene.2015.04.115
[14] Borhanazad, H., Mekhilef, S., Gounder Ganapathy V., Modiri-Delshad, M., Mirtaheri, A. (2014). Optimization of micro-grid system using MOPSO. Renewable Energy, 71: 295-306. https://doi.org/10.1016/j.renene.2014.05.006
[15] Yang, H., Wei, Z., Chengzhi, L. (2009). Optimal design and techno-economic analysis of a hybrid solar-wind power generation system. Applied Energy, 86(2): 163-169. https://doi.org/10.1016/j.apenergy.2008.03.008
[16] Blal, M., Belasri, A., Benatillah, A. (2018). Assessment of solar and wind energy as motive for potential hydrogen production of Algeria country; development a methodology for uses hydrogen- based fuel cells. International Journal of Hydrogen Energy, 43(19): 9192-9210. https://doi.org/10.1016/j.ijhydene.2018.03.200