Alla F. Bondarenko | Liudmyla S. Zakharkina | Liubov O. Syhyda* | Liudmyla Yu. Saher
© 2020 IIETA. This article is published by IIETA and is licensed under the CC BY 4.0 license (http://creativecommons.org/licenses/by/4.0/).
OPEN ACCESS
The subject of the research is the territory’s attractiveness. The main research activities are focused on 15 countries with different levels of development. Thus, the purpose of the study is to provide an empirical study on measuring the attractiveness of defined countries and on identifying their positions comparing with others. The study suggests measuring the territory’s attractiveness from two points of view: economic and marketing attractiveness. It is proposed to measure economic attractiveness using five sub-indexes: business, production, trade & investment, environment, and logistics. At the same time marketing attractiveness consists of the following sub-indexes: social, touristic, territory’s convenience, innovation, and demand. The research results allow plotting countries on a nine-cell matrix and separate three groups of countries – countries with high (group 1), medium (group 2) and low (group 3) economic and marketing attractiveness. Recommendations and strategies of further attractiveness improvement depending on countries' current position are formed.
attractiveness, competitiveness, country marketing of territory, matrix, measurement, positioning
1.1 Problem statement
Significant competition between different territories (cities, regions, countries) for people, financial support, tourists, resources, etc. arises and becomes burning in current conditions. Territories need to provide close relationships with citizens and other counterparts (investors, tourists, etc.), they must find ways to be more interesting for different target audiences. From this perspective, the problem of the territorial attractiveness measurement at different levels is up to date.
Accordingly, this research is aimed to conduct an empirical study of the attractiveness measurement of some countries with different levels of development.
1.2 Literature review
Territorial marketing is one of the new marketing concepts. Scientists around the world maintain its importance and state that nowadays territorial marketing is a great tool to make territories well-known, popular, competitive and attractive. Territorial marketing isn’t a new idea. It was established in the 19th century, but the 21st century highlighted the importance of this concept and the interest has raised again.
Many scientists work over the concept of territorial marketing. Thus, Amajid et al. [1] mentioned that territorial marketing “is connected to marketing, management, globalization... It deals with strategic and operational aspects to serve various purposes: generation of cash flows, acquiring market shares, satisfying targeted markets”.
Alaux et al. [2] maintain that “… territorial marketing consists of a number of approaches, techniques, and tools used to build and develop the attractiveness of a given territory through the promotion of companies, products, and services, talent, Know-how; the radiance of the territory (notoriety, image, visibility); the attraction and maintenance of people and capital ...”.
According to Parvex [3], territorial marketing “… seeks to produce added value, position the territory, attract, welcome and retain users”.
Alaoui et al. [4] in the research discuss the new practices of territorial marketing – holistic marketing, shared marketing, citizen-based marketing, hypersegmentation marketing, excellence marketing, creative marketing, digital marketing, customization marketing, viral marketing, experience marketing, identity marketing. They highlight the importance of these practices as the way for territory to be competitive and attractive.
Ukrainian scientists have started exploring some aspects of territorial marketing too. In particular, Rosokhata et al. [5] analyze of import substitution`s strategy as an opportunity to enhance the image of Ukrainian industrial machine-building enterprises in international markets within the limits of increasing the countries attractiveness. Bilan et al. [6, 7] investigate the influence of social progress and brand’s factors on the macroeconomic stability of the countries. Lyulyov et al. [8] define the infrastructure component of territory.
Analyzing the abovementioned definitions, we can say that there are two crucial components of territorial marketing – competitiveness and attractiveness. At first sight, it seems that these two terms are similar, but more detailed analysis lets us see the difference. Comparing these definitions, we emphasize the main aspects of each (Table 1).
Table 1. The comparative analyses of the definitions “territorial competitiveness” and “territorial attractiveness”
|
Author |
Definition |
Key elements |
|
Attractiveness |
||
|
Lonska J., 2014 [9] |
… is a capacity of territory to attract and at the same time to retain and preserve the necessary resources for ensuring competitiveness of the territory: attractiveness of the territory ensures emergence of competitive advantages within the area, which is a significant component of territorial competitiveness and it is its driving force |
Basis for competitive advantages’ emergence. Capacity to attract, to retain and preserve the necessary resources |
|
Serrano Fr. A. [10] |
… represents an effort to reinvent or redesign cities in terms of its resources and institutions to obtain a better economic level for its citizens |
Recourses of territory. Economic level for citizens |
|
Goetz M. [11] |
… a set of advantages and disadvantages in the place of investment |
Advantages and disadvantages of the territory |
|
Barboric et al. [12] |
… grounds on a mobility concept and implies the capacity of a place to attract and retain subjects from other places, due to its advantageous features |
Advantages of the territory. Capacity to attract people |
|
Russo A., Smith Ia., Atkinson R. et al. [13] |
… the interaction of a complex set of characteristics based on the presence/absence of certain forms of Territorial Capital with the attraction of various “audiences” varying in their level of transience in place from long-term residents as working population to short-term visitors and some hybrids mobilities between the two |
Capacity to attract people |
|
Hamri H. M., Zerouali |
the concept of territorial attractiveness generally indicates the territory ability to attract and retain both national and foreign companies
… attractiveness can also describe the ability of a territory to capture foreign investment and retain investments that are already present and established on the territory |
Capacity to attract investment |
|
The Attract-SEE [15] |
territorial attractiveness grounds on a mobility concept and implies the capacity of a place to attract and retain subjects from other places, due to its advantageous features |
Advantages of the territory. Capacity to attract people |
|
Madsen and Zhang [16] |
the attractiveness of a city or region can be assessed by analyzing its ability to attract and retain users (visitors, residents, firms) and investments that are considered beneficial for a region. This ability to attract depends on the quality of the (living, business, visitor) environment. Cities and Regions can be considered attractive if they have sufficient urban amenities to offset agglomeration disadvantages such as high housing and land prices |
Advantages and disadvantages of the territory. Capacity to attract people |
|
Competitiveness |
||
|
Lonska J. [9] |
… capacity to manage, create and improve environment, which is favorable for people and enterprises, where people are able to increase their prosperity and enterprises have possibility to create the added value |
Ability to create the added value. Prosperity of people |
|
Atkinson R. [17] |
… the ability of a region to export more in value added terms than it imports |
Ability to create the added value |
|
Schwab K. [18] |
… the set of institutions, policies, and factors that determine the level of productivity of an economy, which in turn sets the level of prosperity that the country can achieve |
Level of productivity. Prosperity of country |
|
World Competitiveness [19] |
… manages the totality of its resources and competencies to increase the prosperity of its population. … vital for the long-term health of a country’s economy as it empowers businesses to achieve sustainable growth, generate jobs and, ultimately, enhance the welfare of citizens |
Prosperity of people and economy |
|
Kohler W. [20]. |
… a country’s ability to generate sustained economic well-being for its citizens, with a minimum degree of inequity regarding personal or regional distribution of income and wealth… A country’s welfare is determined by its absolute level of productivity |
Welfare of people. Country’s productivity |
|
Porter M.E. [21] |
… show its relationship to a nation’s standard of living, and outline a conceptual framework for understanding its causes |
Welfare and prosperity of people |
|
Chikán A. [22] |
… a capability of a national economy to operate ensuring an increasing welfare of its citizens at its factor productivity sustainably growing |
Welfare of people. Sustainable growing of productivity |
|
Sally et al. [23] |
… the set of factors – policies, institutions, strategies and processes – that determines the level of a city’s sustainable productivity |
Productivity |
As we can see, the comparison of competitiveness and attractiveness is a challenging task. Nevertheless, highlighting the key elements of the mentioned definitions helps us to identify mutual borderlines between them (Table 1). So, we can describe territorial competitiveness using these key elements: added value, prosperity, productivity, economic development, welfare. And territorial attractiveness includes such key elements as competitive advantages and capacity to attract. These two elements show that territory already has competitive advantages and can attract people, investments, resources, etc. that makes it interesting for different target audiences. Competitiveness is more future- and business-oriented. Our further research will deal with the attractiveness of the territory.
The problems of the market attractiveness of countries with different level of economic development are discussed in the papers of [24-27].
The scientists in the papers [9, 28-30] proved the importance of territories’ attractiveness development and defined its marketing aspects.
Economic aspects and touristic aspects of territory’ attractiveness scientists highlight in the following studies [31-36].
The methodical basis of this research makes analytic and descriptive approaches as well as factor analysis and economic and mathematical analysis.
In this study to identify the attractiveness of countries with different levels of development the authors’ approach was conducted. This approach was established thanks to the authors’ deep theoretical analysis of topic-related literature, its systematization, and comparison.
Thus, the most well-known and the most widespread approach to territory’s attractiveness measurement deals with five aggregated indicators: environmental capital, antropic capital, socio-cultural capital, economic/human capital, and institutional capital. This approach is mentioned and used in works of different scientists, including [12, 13, 26, 37].
Hamri et al. [14] propose their vision of regional attractiveness measurement. From their position, regional attractiveness can be defined using five factors: economic, technical and financial environment, human resources, organizations and actors, quality of life, the territory’s image.
Snieska et al. [38] propose the multi-criterion measurement of attractiveness. It includes attractiveness in regard to the intelligence of the location; attractiveness in regard to networking and infrastructure of the location; attractiveness in regard to the coherence of the location; attractiveness in regard to the digitalization of the location; attractiveness of the location in regard to learning; attractiveness in regard to the mobility of the location; attractiveness in regard to the innovativeness of the location; attractiveness in regard to how much the location is based on knowledge.
According to Eddine Harroussi and Chakor [39] territory’s attractiveness is a combination of economic attractiveness; tourism and ecological attractiveness; cultural attractiveness; residential attractiveness; technological attractiveness; scientific attractiveness.
Additionally, Ezmale [40] emphasizes that territorial attractiveness includes: availability and mobility; economic development, employment and material welfare of inhabitants; the quality and availability of health care services; the quality and availability of social care services; the quality and availability of educational services; ecological quality; participation in the community’s social life diversification; the quality and availability of administrative services provided by the state and municipality; the quality and availability of shopping services; the quality and availability of housing; the quality and availability of physical safety and security.
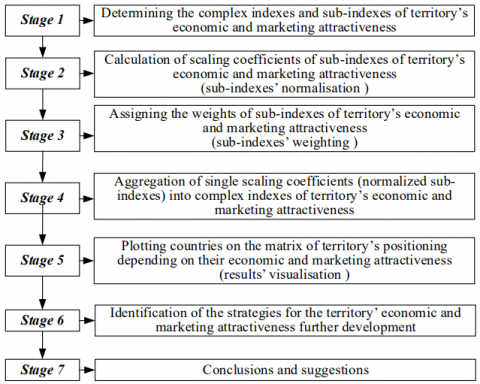
The research of the theoretical and methodological basis of territory attractiveness management allows building the authors’ model of territory attractiveness measurement (Figure 1).
Figure 1. Authors’ approach to territory’s attractiveness measurement
At the first stage we propose to measure two aspects of the territory’s attractiveness – the economic attractiveness (further on – EconAttr) and the marketing attractiveness (further on – MarkAttr) – and calculate two complex indexes respectively.
Both the complex index of economic attractiveness and the complex index of marketing attractiveness are formed by the system of single sub-indexes. As single sub-indexes, we use indexes calculated by the world organizations and containing complex information (Table 2).
According to Table 2, complex index of economic attractiveness (EconAttr) includes 5 sub-indexes:
$EconAttr=(\mathrm{BS} ; \mathrm{PS} ; \mathrm{TIS} ; \mathrm{ES} ; \mathrm{LS}). Vary from 0 to 1.$ (1)
At the same time, complex index of marketing attractiveness (MarkAttr) includes following 5 sub-indexes:
$MarkAttr =(\mathrm{SS} ; \mathrm{TS} ; \mathrm{TCS} ; \mathrm{IS} ; \mathrm{DS}). Vary from 0 to 1.$ (2)
Table 2. Single sub-indexes of territory’s economic and marketing attractiveness measurement
|
No |
Economic attractiveness (EconAttr) |
Marketing attractiveness (MarkAttr) |
||
|
Sub-index |
Source |
Sub-index |
Source |
|
|
1 |
Business sub-index (BS) |
Ease of Doing Business Index |
Social sub-index (SS) |
Human Development Index |
|
2 |
Production sub-index (PS) |
Structure of Production Index |
Touristic sub-index (TS) |
Travel & Tourism Competitiveness Index |
|
3 |
Trade & Investment sub-index (TIS) |
Global Trade & Investment Index |
Territory’s convenience |
Ranking of World Happiness |
|
4 |
Environmental sub-index (ES) |
Sustainable Resources Index |
Innovation |
Global Innovation Index |
|
5 |
Logistical sub-index (LS) |
Logistics Performance Index |
Demand sub-index (DS) |
Demand Environment Index |
Source. Based on [41-48].
To make the chosen sub-indexes of countries’ economic and marketing attractiveness comparable and to bring them onto a common scale they are normalized and the scaling coefficients for each sub-index are calculated on the second stage. For that purpose, a variation of the methods of multidimensional average is applied.
To do this, the ratio of the difference between each single sub-index of the defined territory and the same minimum sub-index among these territories to the difference between maximum and minimum meanings of this sub-index among analyzed territories is determined:
1) if the growth of a single sub-index has positive impact on the complex index:
$k_{\text {econi }}=\frac{x_{\text {econi }}-x_{\text {mineconi }}}{x_{\text {maxeconi }}-x_{\text {mineconi }}}$;
$k_{\text {marki }}=\frac{x_{\text {marki }}-x_{\text {minmarki }}}{x_{\text {max marki }}-x_{\text {minmarki }}}$; (3)
2) if the growth of a single sub-index has negative impact on the complex index:
$k_{\text {econi}}=1-\frac{x_{\text {econi}}-x_{\text {mineconi}}}{x_{\text {maxeconi}}-x_{\text {mineconi}}}$;
$k_{m a r k i}=1-\frac{x_{m a r k i}-x_{m i n m a r k i}}{x_{m a x m a r k i}-x_{m i n m a r k i}}$, (4)
where, keconi and kmarki – scaling coefficients for i-sub-index of territory’s economic and marketing attractiveness respectively;
хeconi and хmarki – i-sub-index of defined territory’s economic and marketing attractiveness respectively;
xmin econi and xmax econi – minimum and maximum meanings of i-sub-index of economic attractiveness of analyzed territory;
xmin marki and xmax marki – minimum and maximum meanings of i-sub-index of marketing attractiveness of analyzed territory;
і – sequence number of sub-indexes of territory’s economic and marketing attractiveness; іecon=1, …, n; іmark = 1, …, m;
n – number of sub-indexes of territory’s economic attractiveness, $n=\overline{1,5}$;
m – number of sub-indexes of territory’s marketing attractiveness, $m=\overline{1,5}$;
In this study, equal weights are used to obtain complex indexes of countries’ economic and marketing attractiveness. The sum of the weights of the sub-indexes within each complex index must be:
$v_{e c o n}=\sum_{i=1}^{n} v_{e c o n i}=1 ; \quad v_{m a r k}=\sum_{i=1}^{m} v_{m a r k i}=1$ (5)
where, veconi – weights of the i-sub-index of territory’s economic attractiveness;
vmarki – weights of the i-sub-index of territory’s marketing attractiveness.
We use this weighting method as there are no statistical or empirical grounds for choosing a different scheme [49].
According to Hagerty and Land [50], “equal weighting policy WE = [1/K,1/K,1/K,...]T is the mini-max estimator” and it is better to use unique weights that minimizes maximum possible disagreement over all possible distributions when individuals’ weights are not known.
So, all sub-indexes within complex index of economic attractiveness and within complex index of marketing attractiveness have an equal status. Since we consider single sub-indexes to be equivalent, their weights within complex index of economic attractiveness and within complex index of marketing attractiveness are the same and are taken as 0.2 (total weight is taken as 1 and each complex index is formed by 5 sub-indexes).
Aggregation of single scaling coefficients into complex indexes of territory’s marketing and economic attractiveness is done by multiplying weights of sub-indexes (see Eq. (5)) on their appropriate scaling coefficients (see Eqns. (3) and (4)):
1) weighted complex index of economic attractiveness:
$EconAttr=\sum_{i=1}^{n} k_{\text {econi}} \cdot v_{\text {econi}}$; (6)
2) weighted complex index of marketing attractiveness:
$MarkAttr=\sum_{i=1}^{m} k_{\text {marki}} \cdot v_{\text {marki}}$. (7)
The visualization of obtained results is done on the next stage: all countries are plotted on the matrix of territory’s positioning depending on their economic and marketing attractiveness. This matrix of visualization helps users to understand information better.
To visualize the results, it’s proposed to use the McKinsey-General Electric nine-cell matrix [51].
The McKinsey-General Electric matrix was chosen as it is a good tool for multi-criteria decision analysis. It helps to evaluate researched units, prioritize them and provide further strategic implications.
Also, according to Tsakalerou [52], by grouping the variables into a small number of classes, GE/McKinsey matrix provides an effective way to reduce the effect of noise in the data and to identify only major trends thus strengthening the conclusions of the corresponding decision analysis.
Adopting McKinsey-General Electric matrix to the research problem, instead of two classical factors (the attractiveness of the relevant industry and the unit’s competitive strength within that industry) we use such factors as complex index of territory’s economic attractiveness and complex index of territory’s marketing attractiveness. So, all territories are evaluated on two axes: economic attractiveness and marketing attractiveness.
Since the complex indexes of economic and marketing attractiveness vary from 0 to 1, we divide the axes of economic and marketing attractiveness into nine cells on the marks of 0.33 and 0.67. Accordingly, the value of the complex indexes of marketing or economic attractiveness from 0 to 0.33 indicates that the level of attractiveness is low, the value of the indexes from 0.34 to 0.67 means that the level of attractiveness is medium and the value of the indexes from 0.68 to 1 means that level of attractiveness is high.
As a result, each territory can belong to one of three possible groups – with high, medium or low economic and marketing attractiveness.
Thus, a methodological approach to assessing the economic and marketing attractiveness of the territory has been formed. It allows identifying the competitive advantages of the territory, which provide it with leadership positions in the eyes of different target groups.
Considering [53, 54] we’ve divided all countries into four groups according to the level of their gross domestic product per capita and countries for further analysis were chosen in each group. Groups and countries are the following:
All chosen countries were analyzed using authors’ approach to territory’s attractiveness measurement (Figure 1).
Firstly, the meaning of all sub-indexes of economic and marketing attractiveness of analyzed countries in 2018 were gathered (see Table 3 and Table 4 respectively). Then single sub-indexes were normalized using Eq. (3) as all sub-indexes have positive impact on the complex indexes. Next, using Eqns. (6) and (7), complex indexes of territory’s economic and marketing attractiveness were calculated considering that all sub-indexes have weights equal to 0.2.
The calculation process of territory’s economic and marketing attractiveness measurement for Ukraine is below.
Scaling coefficients of economic sub-indexes for Ukraine:
$k_{\text {econBS}}=\frac{68.25-52.89}{84.14-52.89}=0.492$. $k_{\text {econPS}}=\frac{5.17-1,66}{8.85-1.66}=0.488$.
$k_{\text {econTIS}}=\frac{5.11-1,98}{7.73-1.98}=0.544 . \quad k_{\text {econES}}=\frac{72.8-46.4}{81.1-46.4}=0.761$. $k_{\text {econLS}}=\frac{2.83-2.53}{4.2-2.53}=0.180$
Complex index of Ukraine’s economic attractiveness is:
EconAttrUkraine = 0.2 · 0.492 + 0.2 · 0.488 + 0.2 · 0.544 + 0.2 · 0.761 + 0.2 · 0.180 = 0.493.
Scaling coefficients of marketing sub-indexes for Ukraine:
$k_{\text {markSS}}=\frac{0.75-0.528}{0.946-0.528}=0.531 . \quad k_{\text {markTs}}=\frac{3.7-2.8}{5.4-2.8}=0.346$. $k_{\text {markTCS}}=\frac{4.332-4.015}{6.985-4.015}=0.107$
$k_{\text {maxKIS}}=\frac{37.4-14.49}{67.24-14.49}=0.434 . k_{\text {markDS}}=\frac{4.53-3.17}{8.54-3.17}=0.253$
Complex index of Ukraine’s marketing attractiveness is:
MarkAttrUkraine = 0.2 · 0.531 + 0.2 · 0.346 + 0.2 · 0.107 + 0.2 · 0.434 + 0.2 · 0.253 = 0.334.
Economic and marketing attractiveness of the rest analyzed countries was measured in the same way. The obtained results are in the Table 3 and Table 4 which contain single sub-indexes and complex indexes of economic and marketing attractiveness of analyzed countries in 2018 respectively.
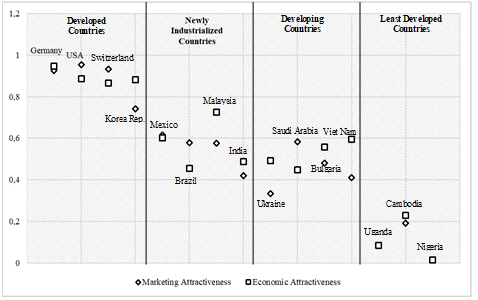
Therefore, using the proposed approach, the economic and marketing attractiveness of the analyzed countries was calculated. Looking at the summary data in Table 3 and Table 4 and on the Figure 2, we can say that economic and marketing attractiveness is different in different countries. In developed countries it is at a high level. It means that these countries use an integrated approach for attractiveness development
We can see the same tendency in the least developed countries (Uganda and Cambodia) with the difference that both indicators are low in the least developed countries. The exception is Nigeria. There is a gap between its economic and marketing attractiveness: the country has higher marketing attractiveness while having a low economic attractiveness. Also, there are gaps between the economic and marketing attractiveness of developing and newly industrialized countries (except Mexico): taking care of one aspect, countries forget about the other. To compare the positions of analyzed countries and identify directions of their further development, we plot them on the matrix (Figure 3). On Figure 3 we see the clear difference between the attractiveness of countries with different levels of development.
There are all developed and one newly industrialized country in group I – countries with high economic and marketing attractiveness. As we can see, developed countries (the USA, Switzerland, Germany and the Republic of Korea) have better positions than Malaysia. The economic attractiveness of Malaysia is very close to the economic attractiveness of developed countries. Malaysia is relatively close to developed countries in business and trade & investment sub-indexes. The biggest difference is that developed countries are better in production, logistical and environmental aspects comparing with newly industrialized ones. Manufacturing is crucially important for Malaysia. But it has much less experience and its readiness is less too. Malaysia must concentrate on the supply chain development and supply chain management within the country (domestic perspective) and finding ways to involve deeper into the world supply chain (an international perspective). This country must become more logistically “friendly”. Considering the relevantly short period of the country’s development it is explainable that it still needs time to improve environmental policy.
Table 3. Countries’ economic attractiveness in 2018
|
Country |
Economic Attractiveness’ sub-indexes |
Complex Index of Economic Attractiveness |
||||
|
Business sub-index |
Production sub-index |
Trade & Investment sub-index |
Environmental sub-index |
Logistical sub-index |
||
|
Germany |
78.90 |
8.68 |
7.32 |
81.1 |
4.2 |
0.947 |
|
USA |
82.75 |
7.78 |
7.73 |
74.5 |
3.89 |
0.886 |
|
Switzerland |
75.69 |
8.39 |
7.21 |
78.8 |
3.9 |
0.866 |
|
Korea Rep. |
84.14 |
8.85 |
6.82 |
78.3 |
3.61 |
0.882 |
|
Mexico |
72.09 |
6.74 |
6.25 |
68.5 |
3.05 |
0.602 |
|
Brazil |
60.01 |
5.22 |
5.27 |
70.6 |
2.99 |
0.454 |
|
Malaysia |
80.60 |
6.81 |
7.39 |
69.6 |
3.22 |
0.725 |
|
India |
67.23 |
5.99 |
5.2 |
61.1 |
3.18 |
0.487 |
|
Ukraine |
68.25 |
5.17 |
5.11 |
72.8 |
2.83 |
0.493 |
|
Saudi Arabia |
63.5 |
5.16 |
5.41 |
64.8 |
3.01 |
0.448 |
|
Bulgaria |
71.24 |
5.23 |
5.4 |
74.5 |
3.03 |
0.558 |
|
Viet Nam |
68.36 |
4.96 |
7 |
71.1 |
3.27 |
0.596 |
|
Uganda |
57.06 |
2.25 |
1.98 |
52.6 |
2.58 |
0.085 |
|
Cambodia |
54.8 |
3.56 |
3.96 |
61.8 |
2.58 |
0.229 |
|
Nigeria |
52.89 |
1.66 |
2.37 |
46.4 |
2.53 |
0.014 |
Source: own calculations.
Table 4. Countries’ marketing attractiveness in 2018
|
Country |
Marketing Attractiveness’ sub-indexes |
Complex Index of Marketing Attractiveness |
||||
|
Social sub-index |
Touristic sub-index |
Territory’s convenience sub-index |
Innovation sub-index |
Demand sub-index |
||
|
Germany |
0.939 |
5.4 |
6.985 |
58.19 |
7.55 |
0.925 |
|
USA |
0.920 |
5.3 |
6.892 |
61.73 |
8.54 |
0.953 |
|
Switzerland |
0.946 |
5.0 |
7.480 |
67.24 |
6.68 |
0.933 |
|
Korea Rep. |
0.906 |
4.8 |
5.895 |
56.55 |
6.40 |
0.741 |
|
Mexico |
0.767 |
4.7 |
6.595 |
36.06 |
5.85 |
0.616 |
|
Brazil |
0.761 |
4.5 |
6.300 |
33.82 |
6.10 |
0.579 |
|
Malaysia |
0.804 |
4.5 |
5.339 |
42.68 |
6.32 |
0.576 |
|
India |
0.647 |
4.4 |
4.015 |
36.58 |
7.4 |
0.421 |
|
Ukraine |
0.750 |
3.7 |
4.332 |
37.40 |
4.53 |
0.334 |
|
Saudi Arabia |
0.857 |
3.9 |
6.375 |
32.93 |
6.19 |
0.583 |
|
Bulgaria |
0.816 |
4.2 |
5.011 |
48.08 |
4.27 |
0.481 |
|
Viet Nam |
0.693 |
3.9 |
5.175 |
38.84 |
5.22 |
0.410 |
|
Uganda |
0.528 |
3.2 |
4.189 |
25.60 |
3.17 |
0.085 |
|
Cambodia |
0.581 |
3.4 |
4.700 |
26.59 |
3.93 |
0.192 |
|
Nigeria |
0.534 |
2.8 |
5.265 |
14.49 |
5.28 |
0.166 |
Source: own calculations.
Figure 2. Economic and marketing attractiveness of analyzed countries
Figure 3. Results of countries plotting on the matrix
Developed countries are much stronger in questions of sustainable development. A good example is the German Sustainable Development Strategy which is based on the 2030 Agenda for Sustainable Development. It is entitled “Transforming our world”. The Federal Government adopted the new version of the German Sustainable Development Strategy on 11 January 2017 [55]. The Strategy is based on such principles as inter-generational equity, quality of life, social cohesion and global responsibility. According to this Strategy, the German government is about to cut the emissions of greenhouse gases by 40 percent by 2020 and 60 percent of the energy mix will be renewables by 2050 [56].
In Switzerland, the implementation of the 2030 Agenda at the federal level is an important task too. And to achieve this task the 2016-2019 Sustainable Development Strategy was adopted as a part of Switzerland's broader legislative planning process [57, 58]. Additionally, in 2017, Switzerland was named one of the top five countries achieving the UN’s Sustainable Development Goals the fastest. Examples of the sustainability are a sustainable city; impressive waste management; preserving water-quality; capturing carbon; protecting climate refugees [59].
Republic of Korea has established its National Strategy for Sustainable Development 2011-2015 which was aimed to sustainable development with four key agenda on enhancing sustainability of environments and natural resources; adaptation to climate change response mechanisms; promoting social equity and public health and improving sustainability economics and industrial structure [60].
However, we already can see that Malaysia is moving to sustainable development and nature protection [61].
At the same time, developed countries have better positions in marketing attractiveness. We can see the main difference through such sub-indexes as touristic, social and innovation. Travel & tourism sector in developed countries is presented more effectively. Besides, travelers know more about these countries and they seem to be more stable for them. Countries have the better-established infrastructure, better services, a sustainable environment and so on.
Malaysia works on its touristic attractiveness too. It is one of the prospective industries in the country. Now the government of Malaysia aims to be among the world’s most tourist destinations [62, 63]. Also, Malaysia has a shade worse position in innovation and demand sub-indexes.
Mexico is about to get to group I too, though it is in group II now. To do this, Mexico has to improve either its marketing attractiveness or its economic attractiveness.
The Government of Mexico, as well as the government of Malaysia, also works on achieving the 2030 Agenda for Sustainable Development [64]. According to the report of Mexican government “Crunching Numbers: Quantifying the Sustainable Development Co-benefits of Mexico’s Climate Commitments”, the Mexico’s Nationally Determined Contribution commitments are: achieving 43% of electricity generation from clean sources; achieving a net-zero deforestation rate; guaranteeing and monitoring the treatment of urban and industrial wastewater in human settlements larger than 500,000 inhabitants; achieving 500,000 electric vehicle sales in Mexico; and reducing energy demand in the three most energy-intensive industrial sectors, namely cement (by 1.8%), chemicals (by 9.6%) and iron and steel (by 14.7%) by 2030 [64]. Besides, tourism is one of the most well-established, developed, safest, most reliable and fastest-growing industries in Mexico and it shows one of the largest economic growth in the country. 8.7% of Mexico’s GDP is formed by tourism. It highlights the importance of this industry for the country [65].
The least developed countries have marketing and economic attractiveness close to the 0. It shows their non-ability to be attractive for target audiences. They belong to group III.
Rest of the newly industrialized countries (except Malaysia) and all developing countries belong to group II.
Saudi Arabia is one of developing countries, but with pretty high level of marketing attractiveness. Saudi Arabia positions are relatively close to positions of developed and newly industrialized countries (Mexico, Malaysia, Brazil) in social and territory convenience and demand sub-indexes.
Brazil already has good environmental sub-index. By improving four other sub-indexes of economic attractiveness, the country will move to the group I.
Bulgaria and Vietnam are developing countries but with relatively strong economic attractiveness, especially in business and environmental sub-indexes. Bulgaria is also good in social and territory’s convenience sub-indexes in marketing attractiveness. Other sub-indexes need to be improved. By increasing economic and/or marketing attractiveness, the country will be able to move to group I.
India is already good in marketing attractiveness: in touristic and demand sub-indexes. India wins in the production sub-index in economic attractiveness. Other sub-indexes are about to be improved. By increasing economic and/or marketing attractiveness, the country will be able to move to group I. Ukraine has the potential for economic attractiveness improvement that will help it to move to group I. But its marketing attractiveness is insufficient and is three times less than the marketing attractiveness of developed countries.
We can see the gaps between newly industrialized countries and developing countries, as well as between developing countries and the least developed countries. And these gaps have both economic and marketing character.
Generalizing the achieved results, we see that developed countries have great territorial attractiveness both from economic and marketing points of view. And they have the potential for further improvement. The attractiveness of Mexico and Malaysia is close to the attractiveness of developed countries, especially in the economic aspect, but marketing attractiveness still needs to be improved. Other newly industrialized countries are closer to developing countries as they are only at the beginning of their growth. Anyway, the newly industrialized countries increase own potential and are about to become powerful competitors to developed countries in the very near future.
The developing countries have almost twice less attractiveness comparing with developed and newly industrialized countries. But some of them show good dynamics in attractiveness creation.
The least developed countries have the lowest level of attractiveness and they have too little potential to improve their position in the coming years.
As a result of the conducted research, we propose the following action strategies for countries in each cell. For countries in group I, it is advisable to use the following strategies: strategy of competitive advantages support and strategy of competitive advantages development. There are countries with the highest level of economic and marketing attractiveness. So, they must maintain the obtained level of development and keep strengthening competitive advantages.
For further attractiveness increasing for the countries in group II, the strategy of selective intensive development is the best. It means the efforts’ concentration in one direction of development.
The strategy of competitive advantage formation is advisable for countries in group III.
In order to study features of the analysis and assessment of the territory’s attractiveness, two crucial components of territorial marketing have been identified:
The conducted analysis helped us to provide the authors’ approach to the territory’s attractiveness measurement. The evaluation methodology involves 7 stages of the calculation of indexes of the territory's economic and marketing attractiveness.
Thus, using this approach, it’s possible not only to lead a comprehensive measurement of the territory's economic and marketing attractiveness but also to identify the weaknesses and competitive advantages of the analyzed territory. And, as a result, it’s possible to determine strategies of territories further development and ways of their promotion for different target groups.
The calculation of countries' complex indexes of economic and marketing attractiveness shows that there are gaps in the level of attractiveness between developed and newly industrialized countries; newly industrialized and developing countries; developing and the least developed countries.
While developed countries use an integrated approach for attractiveness development, they have good positions in both economic and marketing attractiveness. Newly industrialized countries use opportunities and improve themselves too. If they keep maintaining this approach, they will reach positions of developed countries soon enough.
Developing countries have much worse positions and must work hard to increase attractiveness. The least developed countries only start forming economic and marketing attractiveness. The common problem of some analyzed countries is that taking care of one aspect of attractiveness they forget about the other.
Ukraine has an average level of economic attractiveness. Its attractiveness is one of the lowest among the analyzed developing countries. The highest rates of attractiveness have Germany, the USA, and Switzerland. In terms of marketing attractiveness, these countries are also among the leaders, while Ukraine's position is one of the lowest. Moreover, only the social sub-index among the investigated marketing sub-indexes is above average in Ukraine, the others are below the average.
So, the conducted analysis helped us to investigate the problem of the territory’s attractiveness. As a result, we have determined the level of economic and marketing attractiveness of 15 countries with different levels of development – developed countries; newly industrialized countries; developing countries; least developed countries and plotted these countries on the matrix. Also, the strategies of countries' attractiveness further development are as follows 1) for countries in group I – strategy of competitive advantages support and strategy of competitive advantages development; 2) for countries in group II – strategy of selective intensive development; 3) for countries in group III – strategy of competitive advantage formation.
The paper was written according to budget money from the Ministry of Education and Science in Ukraine, given to develop research topic № SR 0117U003922 “Innovative drivers of national economic security: structural modeling and forecasting”.
|
EconAttr |
dimensionless complex index of territorial economic attractiveness |
|
MarkAttr |
dimensionless complex index of territorial marketing attractiveness |
|
BS |
business sub-index, score |
|
PS |
production sub-index, score |
|
TIS |
trade & investment sub-index, score |
|
ES |
environmental sub-index, score |
|
LS |
logistical sub-index, score |
|
SS |
social sub-index, value |
|
TS |
touristic sub-index, score |
|
TCS |
territory’s convenience sub-index, score |
|
IS |
innovation sub-index, score |
|
DS |
demand sub-index, score |
|
k |
dimensionless scaling coefficient for sub-index of territory’s attractiveness |
|
х |
sub-index of territory’s attractiveness, dimension depends on type of sub-index |
|
v |
dimensionless weights of the sub-indexes of territory’s attractiveness |
|
Subscripts |
|
|
econ |
identifier of territory’s economic attractiveness |
|
mark |
identifier of territory’s marketing attractiveness |
|
min |
minimum meaning of sub-indexes of territory’s attractiveness |
|
max |
maximum meaning of sub-indexes of territory’s attractiveness |
|
і |
sequence number of sub-indexes of territory’s attractiveness |
|
n |
number of sub-indexes of territory’s economic attractiveness |
|
m |
number of sub-indexes of territory’s marketing attractiveness |
[1] Amajid, G., El Wazani, Y., Elwazani, Y. (2016). Territorial marketing and its effects on Development, approach from the literature. Revue Marocaine de Recherche en Management et Marketing, 13: 111-129.
[2] Alaux, C., Gayet, J. (2015). Pays d’Apt Luberon Les enjeux et défis pour demain de l’attractivité. In Conjseil Communautaire, 1-36.
[3] Parvex, F. (2009). Marketing territorial quand le territoire devient produit. https://slideplayer.fr/slide/5323718/, accessed on Jan. 10, 2020.
[4] Alaoui, Y., Abba, R. (2019). The R(Evolution) of territorial marketing: Towards an identity marketing. Journal of Marketing Research and Case Studies, 2019: 944163. https://doi.org/10.5171/2019.944163
[5] Rosokhata, A., Kysil, T., Kolodka, A. (2014). Import substitution as a means of image forming: prospects forecast of industrial enterprises in Ukraine. Economics & Sociology, 7(2): 123-135. https://doi.org/10.14254/2071-789X.2014/7-2/10
[6] Bilan, Y., Lyeonov, S., Lyulyov, O., Pimonenko, T. (2019). Brand management and macroeconomic stability of the country. Polish Journal of Management Studies, 19(2): 61-74. http://dx.doi.org/10.17512/pjms.2019.19.2.05
[7] Bilan, Y., Vasilyeva, T., Lyulyov, O., Pimonenko, T. (2019). EU vector of Ukraine development: Linking between macroeconomic stability and social progress. International Journal of Business and Society, 20(2): 433-450.
[8] Lyulyov, O., Pimonenko, T., Stoyanets, N., Letunovska, N. (2019). Sustainable development of agricultural sector: Democratic profile impact among developing countries. Research in World Economy, 10(4): 97-105. https://doi.org/10.5430/rwe.v10n4p97
[9] Lonska, J. (2014). Interrelation of the stages of the territory’s development process. Regional Formation and Development Studies, 3(11): 124-134. https://doi.org/10.15181/rfds.v11i3.615
[10] Serrano, F.A. (2003). City competitiveness and attractiveness: A new approach to evaluate economic development in Mexican cities. PhD Thesis, University of Glasgow, p. 70.
[11] Goetz, M. (2008). Cluster, Competitiveness, Attractiveness, Innovativeness – How Do They Fit Together? https://www.pucsp.br/icim2009/portugues/downloads/pdf_proceedings_2008/01.pdf, accessed on Jan. 13, 2020.
[12] Barboric, B., Zivkovic, L., Esposito, G. (2013). Attract-ASS – assessing territorial attractiveness in South East Europe. Establishing a common territorial monitoring framework. Proceedings REAL CORP, Tagungsband, Rome, Italy, pp. 1105-1112.
[13] Russo, A., Smith, Ia., Atkinson, R., Servillo, L., Madsen, B., van der Borg, J. (2013). ESPON ATTREG Project ATTREG. The Attractiveness of European regions and cities for residents and visitors. http://www.espon.eu/main/Menu_Projects/Menu_AppliedResearch/attreg.html, accessed on Jan. 1, 2020.
[14] Hamri, H.M., Zerouali Ouariti, O.Z., Sadiqui, A. (2014). Territory attractiveness: Case of Souss-Massa-Draa region. International Journal of Research in Management & Business Studies, 1(4): 27-31.
[15] The Attract-SEE. 2013. http://www.gis.si/media/attract-see/AttractSEE_Government_Gazette.pdf, accessed on Dec. 22, 2019.
[16] Madsen, B., Zhang, J. (2020). Scenario analysis for Territorial attractiveness and mobility flows. Documentation and applications of the ATTREG-future model. http://www.wiod.org/conferences/groningen/Paper_Madsen_Zhang.pdf, accessed on Jan. 10, 2020.
[17] Atkinson, R.D. (2013). Competitiveness, innovation and productivity: Clearing up the confusion. The Information Technology & Innovation Foundation, pp. 1-7.
[18] Schwab, K., Sala-i-Martín, X. (2017). The Global Competitiveness Report 2017-2018. World Economic Forum. Geneva, p. 381.
[19] IMD World Competitiveness Yearbook 2012. (2012). IMD World Competitiveness Center. Lausanne, Switzerland, 256 p.
[20] Kohler, W. (2006). The ‘Lisbon goal’ of the EU: Rhetoric or substance? Journal of Industry, Competition and Trade, 6(2): 85-113.
[21] Porter, M.E., Schwab, K., Sala-i-Martin, X. (2004). Building the Microeconomic Foundations of Prosperity: Findings from the Business Competitiveness Index. In the Global Competitiveness Report 2003-2004, 29-56.
[22] Chikán, A. (2008). National and firm competitiveness: A general research model. Competitiveness Review: An International Business Journal, 18(½): 20-28. http://dx.doi.org/10.1108/10595420810874583
[23] Sally, R., Gignac, C., Smith, D.L. (2014). The Competitiveness of Cities. Cologny/Geneva: World Economic Forum. Retrieved from http://www3.weforum.org/docs/GAC/2014/WEF_GAC_CompetitivenessOfCities_Report_2014.pdf, accessed on Jan. 17, 2020.
[24] Tripodo, G., Dazzi, N. (1995). Market attractiveness of developing countries. International Series in Operations Research & Management Science, Boston, MA, pp. 287-303. https://doi.org/10.1007/978-1-4615-1665-1_9
[25] Nganga, P.S., Maruyama, Y. (2015). Market attractiveness evaluation of sub-saharan Africa, applying swot analysis and AHP methods. Journal of Economics and Economic Education Research, 16(1): 1-18.
[26] Servillo, L., Atkinson, R., Russo, A.P. (2011). Territorial attractiveness in EU urban and spatial policy: A critical review and future research agenda. European Urban and Regional Studies, 19(4): 349-365. https://doi.org/10.1177/0969776411430289
[27] Nowak, J., Pöschl, J. (1999). An assessment of progress in transition, economic performance, and market attractiveness of CEFTA countries. Journal of East-West Business, 4(4): 27-48.
[28] Budnikevych, I., Gavrysh, I. (2017). Modern marketing concepts as the basis for formation and increase of the attractiveness of cities and territories. Baltic Journal of Economic Studies, 3(1): 12-18.
[29] Hassib, R., Ibtissem, S. (2018). Territorial marketing: A tool for developing the attractiveness of territories. A/Z ITU Journal of Faculty of Architecture, 15(3): 61-69. https://doi.org/10.5505/itujfa.2018.14622.
[30] Amajida, G., Souafb, M., El Wazani, Y. (2017). Territorial Marketing Toolbox, an operational tool for territorial mix formalization. World Scientific News, 65: 37-58.
[31] Korchagina, I., Sychyova-Peredero, O. (2019). Technological entrepreneurship potential as a diversification factor of the territory’s economy. Regional economy. South of Russia, 7(4): 4-12. http://dx.doi.org/10.15688/re.volsu.2019.4.1
[32] Gavrilovaa, M.A., Shepeleva, V.M., Kosyakovaa, I.V., Belikovab, L.F., Chistikc, O.F. (2016). Assessment of entrepreneurial territorial attractiveness by the ranking method. International Journal of Environmental & Science Education, 11(14): 6866-6875.
[33] Kolesnikov, S.I., Dolzhenko, L.M. (2018). Methodology for assessing the level of the territory’s economic security. Mathematical Analysis with Applications, in Honor of the 90th Birthday of Constantin Corduneanu, Ekaterinburg, Russia, pp. 359-364.
[34] Viatkin, K., Shyshkin, E., Kamieniev, O., Pankeieva, A., Viatkin, R., Moroz, N. (2020). Economic aspects for determining attractiveness of territories. E3S Web Conference, 157.
[35] Mitra, S. (2019). A different perspective to measure tourism attractiveness. Current Issues in Tourism. http://dx.doi.org/10.1080/13683500.2019.1656711
[36] Wang, X., Li, X., Zhen, F., Zhang, J.H. (2015). How smart is your tourist attraction? Measuring tourist preferences of smart tourism attractions via a FCEM-AHP and IPA approach. Tourism Management, 54: 309-320. http://dx.doi.org/10.1016/j.tourman.2015.12.003
[37] Zivkovic, L., Trapani, F., Berk, S., Esposito, G. (2015). Towards a monitoring information system for territorial attractiveness and policy management in South East Europe. Geodetski Vestnik, 59(4): 752-766. http://dx.doi.org/10.15292/geodetski-vestnik.2015.04.752-766
[38] Snieska, V., Zykiene, I., Burksaitiene, D. (2019). Evaluation of location’s attractiveness for business growth in smart development. Economic Research Ekonomska Istraživanja, 32(1): 925-946. http://dx.doi.org/10.1080/1331677X.2019.1590217
[39] Eddine Harroussi, B., Chakor, A. (April 2019). The attractive territory: Contribution of the Territorial positioning and the innovative theoretical and historical models. European Scientific Journal, 15(10): 43-61. http://dx.doi.org/10.19044/esj.2019.v15n10p43
[40] Ezmale, S. (2012). Strategies for enhancing attractiveness of the cities in Latgale region. European Integration Studies, 6: 121-127. http://dx.doi.org/10.5755/j01.eis.0.6.1601
[41] Human Development Index trends, 1990-2018. (2019). http://hdr.undp.org/en/content/human-development-index-hdi, accessed on Jan. 10, 2020.
[42] Helliwell, J.F., Layard, R., Sachs, J.D. (2019). World Happiness Report. New York: Sustainable Development Solutions Network, р. 136.
[43] Uppink Calderwood, L., Soshkin, M. (2019). The Travel & Tourism Competitiveness. Report 2019. Travel and Tourism at a Tipping Point. Insight Report. World Economic Forum.
[44] Kearney, A.T. (2018). Readiness for the Future of Production Report 2018. Insight Report. World Economic Forum, 266 р.
[45] Dutta, S., Lanvin, B., Wunsch-Vincent, S. (2019). Global innovation index 2019. Creating Healthy Lives – The Future of Medical Innovation. 12th edition. Cornell University, INSEAD, and the World Intellectual Property Organization, р. 451.
[46] Aggregated LPI 2012-2018. https://lpi.worldbank.org/international/aggregated-ranking, accessed on Jan. 18, 2020.
[47] Doing business 2019 (2019). Training for Reform. Comparing business regulation for domestic firms in 190 economies. the 16th. A World Bank Group Flagship Report, р. 311.
[48] The Sustainable Development Report 2019 (SDG Index and Dashboards) (June 2019). р. 478.
[49] 10 Step Guide. Competence Centre on Composite Indicators and Scoreboards. https://composite-indicators.jrc.ec.europa.eu/?q=10-step-guide, accessed on Jan. 18, 2020.
[50] Hagerty, M.R., Land, K.C. (2007). Constructing summary indices of quality of life: A model for the effect of heterogeneous importance weights. Sociological Methods Research, 35: 455-496. http://dx.doi.org/10.1177/0049124106292354
[51] Enduring Ideas: The GE–McKinsey nine-box matrix. McKinsey Quarterly. (2008). https://www.mckinsey. com/business-functions/strategy-and-corporate-finance/our-insights/enduring-ideas-the-ge-and-mckinsey-nine-box-matrix#, accessed on Jan. 15, 2020.
[52] Tsakalerou, M. (2015). GE/McKinsey matrices revisited: a mixed mode tool for multi-criteria decision analysis. European Journal of Contemporary Economics and Management, 2(1): 92-98. http://dx.doi.org/10.19044/elp.v2no1a5
[53] Country classification (2014). Data sources, country classifications and aggregation methodology. World Economic Situation and Prospects, 143-150. https://www.un.org/en/development/desa/policy/wesp/wesp_current/2014wesp_country_classification.pdf, accessed on Dec. 23, 2019.
[54] Upadhyaya, Sh. (2013). Country grouping in UNIDO statistics. Working paper. Statistics Unit UNIDO. United Nations Industrial Development Organization, Vienna, р. 36.
[55] German Sustainable Development Strategy. (2017). https://www.bundesregierung.de/resource/blob/975274/1588964/1b24acbed2b731744c2ffa4ca9f3a6fc/2019-03-13-dns-aktualisierung-2018-englisch-data.pdf?download=1, accessed on Jan. 10, 2020.
[56] Germany's National Sustainable Development Strategy. https://www.bundesregierung.de/breg-en/issues/sustainability/germany-s-national-sustainable-development-strategy-354566\, accessed on Jan. 10, 2020.
[57] Policy Coherence for Sustainable Development Country Profiles. https://www.oecd.org/governance/pcsd/Country%20Profile_Switzerland.pdf, accessed on Dec. 23, 2019.
[58] Sustainable Development Strategy 2016-2019. https://www.are.admin.ch/are/en/home/sustainable-development/strategy-and-planning/sustainable-development-strategy-2016-2019.html, accessed on Jan. 10, 2020.
[59] Robyn Farrell, S. 5 Examples of Sustainability in Switzerland (2019). https://sumas.ch/5-examples-of-sustainability-in-switzerland/, accessed on Dec. 23, 2019.
[60] Republic of Korea National Strategy for Sustainable Development 2011-2015. (2011). Sustainable Development Plan. https://www.greengrowthknowledge.org/national-documents/republic-korea-national-strategy-sustainable-development-2011-2015, accessed on Jan. 08, 2020.
[61] Augustin, R. (2019). Malaysia committed to sustainable development, says Dr M. https://www.freemalaysiatoday.com/category/nation/2019/11/06/malaysia-committed-to-sustainable-development-says-dr-m/, accessed on Jan. 10, 2020.
[62] Bernama (2018). Malaysia aims to be in world's top 10 tourist destinations by 2019. https://www.nst.com.my/news/nation/2018/09/409641/malaysia-aims-be-worlds-top-10-tourist-destinations-2019, accessed on Jan. 18, 2020.
[63] Tourism contributes RM41.69b to Malaysian economy in first half 2019, new data reveals (2019). https://www.malaymail.com/news/malaysia/2019/08/23/tourism-contributes-rm41.69b-to-malaysian-economy-in-first-half-2019/1783597, accessed on Jan. 15, 2020.
[64] Mead, L. (2019). Mexico Quantifies Development Co-benefits of Climate Action. https://sdg.iisd.org/thematic-experts/leila-mead/, accessed on Jan. 10, 2020.
[65] Luebke, A. (2019). Mexico’s tourism set to grow by 4.7% in 2019. Retrieved from https://www.tourism-review.com/mexicos-tourism-has-a-positive-outlook-news11149, accessed on Jan. 10, 2020.