Xiangyu Dai![]() | Tianyu Li*
| Tianyu Li*![]()
© 2024 The authors. This article is published by IIETA and is licensed under the CC BY 4.0 license (http://creativecommons.org/licenses/by/4.0/).
OPEN ACCESS
With the deepening of industrial technology, the monitoring of the thermodynamic state of complex equipment systems has become a key to ensuring production continuity and safety. The thermodynamic state not only reflects the immediate working performance of the equipment but is also decisive in preventing overheating failures. The application of real-time remote monitoring technology provides a new solution for equipment health management, significantly reducing unexpected downtime, preventing failures, thus improving production efficiency and equipment lifespan. However, existing research still shows limitations in real-time data analysis, diversity of equipment adaptability, and accurate fault prediction. This paper proposes three innovative algorithms for the real-time remote monitoring of the thermodynamic state of complex equipment systems, and a method for mining overheating early warning information. The first algorithm, based on reconstruction error, is suitable for equipment with a large amount of normal operation data, using machine learning technology to accurately simulate the normal state to identify anomalies. The second single-class monitoring algorithm, suitable for situations with only normal operating data, can effectively detect deviations from the normal thermodynamic parameters. The third algorithm, based on statistical quantities, uses the statistical characteristics of equipment operation data for fault warning. In addition, the paper explores the application of the Bucket Sorting Fpgrowth algorithm in the mining of overheating early warning information of the thermodynamic state, analyzing potential fault modes and association rules through efficient data mining technology. These methods not only enhance the applicability and predictive accuracy of monitoring algorithms but also provide valuable decision support for equipment managers.
complex equipment systems, thermodynamics state monitoring, real-time remote monitoring, overheating early warning, reconstruction error, single-class monitoring algorithm, statistical quantity monitoring, Bucket Sorting Fpgrowth algorithm
With the rapid development of industrial automation and information technology, complex equipment systems play a core role in many important fields. The stable and safe operation of these equipment systems is crucial for production efficiency and economic benefits [1, 2]. Since the thermodynamic state is a key indicator of equipment health [3-5], real-time remote monitoring of it not only ensures the effective operation of equipment but also prevents failures and accidents caused by overheating. This is particularly important in extending equipment life, reducing maintenance costs, and ensuring personnel safety [6, 7].
The significance of related research lies in the fact that through efficient real-time remote monitoring algorithms, potential overheating conditions can be detected and warned in advance, thus allowing for appropriate measures to be taken to prevent them [8-10]. Furthermore, these algorithms can assist technicians in understanding the operation of the equipment, optimizing maintenance and operational strategies [11, 12]. Additionally, the application of early warning information mining methods further enhances the predictive power of this monitoring system, providing deeper insights for equipment managers.
Although existing research has proposed various monitoring and early warning technologies, there are still deficiencies in terms of real-time performance, accuracy, and applicability [13-16]. Many methods struggle to adapt and accurately reflect the true condition of the equipment when faced with a diversity of equipment types and complex fault modes, particularly in the challenges of real-time data processing and accurate fault prediction [17-21].
The main research content of this paper covers two parts: First, it proposes three different types of real-time remote monitoring algorithms for the thermodynamic state of complex equipment systems. Among them, the monitoring algorithm based on reconstruction error uses advanced machine learning technology to accurately reconstruct the thermodynamic parameters of the normal state, thereby detecting and warning of abnormal states. The single-class monitoring algorithm focuses on situations where only normal state data is available, while the statistical quantity-based monitoring algorithm uses the statistical characteristics of equipment operation data for anomaly detection. Second, the Bucket Sorting Fpgrowth algorithm is introduced for mining overheating early warning information of the thermodynamic state. This algorithm can efficiently process large amounts of data to discover potential fault modes and association rules. These works not only enrich the theory and practice of equipment monitoring but also provide new technical means for equipment health management and fault prevention, having significant research value and practical application prospects.
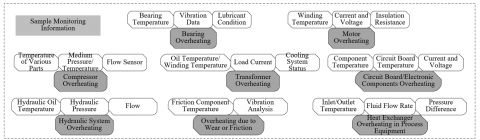
Overheating failures in equipment can be caused by a variety of reasons, often related to the equipment's thermodynamic state, which can be monitored in real time through various sensors. This paper lists some common types of equipment overheating failures, including: 1) Bearing overheating: usually caused by insufficient lubrication or bearing damage; 2) Motor overheating: may be due to overload, insulation damage, or poor heat dissipation; 3) Compressor overheating: may be caused by cooling system failure or compressor issues; 4) Transformer overheating: possibly due to overload, cooling system failure, or insulation material aging; 5) Circuit board/electronic component overheating: possibly caused by excessive current, short circuit, or cooling issues; 6) Hydraulic system overheating: may be due to excessive pressure from the pump, flow restrictions, or cooling system issues; 7) Overheating due to wear or friction: improper friction between mechanical parts generating excessive heat; 8) Overheating of heat exchangers in process equipment: possibly due to insufficient fluid flow or dirt accumulation affecting heat exchange efficiency. Figure 1 shows the monitoring sample data information for different types of equipment overheating failures.
In implementing a monitoring system, a hybrid approach is often needed, combining various types of monitoring with real-time remote monitoring technology to more comprehensively cover different types of equipment failures. Furthermore, the design of monitoring systems often needs to be customized according to specific application scenarios and equipment types. To this end, this paper proposes a real-time remote monitoring technology that combines the methods of real-time remote monitoring based on reconstruction error, single-class, and statistical quantities, for the real-time remote monitoring of the thermodynamic state of complex equipment systems.
Figure 1. Monitoring sample data information for different types of equipment overheating failures
2.1 Real-time remote monitoring method based on reconstruction error
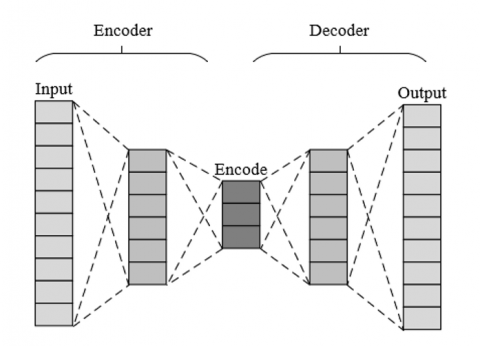
Figure 2. Schematic diagram of autoencoder structure
The real-time remote monitoring method based on reconstruction error is suitable for equipment with a large amount of normal operation data. It can be trained using an autoencoder to recognize the thermal state during normal operation. A fault may be indicated when the error between the actual monitored data and the data reconstructed by the model exceeds a certain threshold. This method is suitable for fault types that require fine pattern recognition, such as overheating of electronic components and motors. Figure 2 shows a schematic diagram of the structure of an autoencoder.
The goal of this method is to create a model that can accurately simulate the thermodynamic behavior of equipment under standard operating conditions. An autoencoder is an unsupervised learning model consisting of two parts: an encoder that transforms input data into a lower-dimensional representation, and a decoder that restores this representation to the original data. This structure is particularly suitable for learning the intrinsic structure and patterns in data. Further, it's important to determine which thermodynamic parameters are key features in the modeling process. For electronic components and motors, temperature might be the most important single feature, but other parameters such as current, voltage, and vibration may also significantly affect the model's accuracy. The autoencoder is trained using historical data, which involves adjusting various hyperparameters of the model, such as the number and size of hidden layers, learning rate, and regularization term. During the training process, the model's performance is continuously evaluated and optimized using a validation set to ensure good generalization ability to new data. Given an input a belonging to an l-dimensional space, the encoder maps a to a j-dimensional projection space.
Further, a real-time data stream processing system is established to ensure continuous collection, transmission, and processing of real-time data. In real-time monitoring, the model converts the thermodynamic parameters collected in real-time into an encoded representation and then attempts to reconstruct the input. Through function g, the input variable a is encoded into feature s=g(a), and the second network of the autoencoder uses the encoded feature s and mapping function d to reconstruct the data e=d(b)=d(g(a)). The difference between the reconstructed data and the original input data is the reconstruction error. This error reflects the model's adaptability to current data. The error r=a-e is defined as the difference between the original input a and the reconstructed signal e.
During the training phase, this study chooses to train with normal data of the equipment's historical thermodynamic behavior under standard operating conditions. The goal of the network training is to reduce the mean square error of r, i.e., 1/vΣvu=1(a-e)2. The threshold can be determined by analyzing the error distribution on the training dataset. The paper sets the threshold as the maximum mean square error during the training process TH=MAX(LTRNO), or it can be adjusted according to business needs and risk tolerance.
When the reconstruction error generated by real-time data exceeds the set threshold, the system will identify an abnormal state. This process needs dynamic adjustment and optimization, as the normal operating range of the equipment may change over time. Once an anomaly is detected, further analysis is required to determine the nature and possible causes of the anomaly. This may involve comparison with other system or sensor data, or the use of diagnostic algorithms to analyze the anomaly pattern. Let the test data be represented by aTE and the reconstruction matrix by eTE, calculate the error LOSS=aTE-eTE between it and the input test matrix. It can be considered that if LOSS>TH, a thermal fault is present; if LOSS<=TH, the condition is judged as normal.
2.2 Real-time remote monitoring method based on single-classification
The real-time remote monitoring method based on single-classification adopts a one-class support vector machine (SVM), suitable for cases where only normal operation data is available but abnormal conditions are unknown or variable. This method is typically used to identify rare events that deviate from the normal operational pattern. For instance, transformer overheating and bearing overheating faults might be well-suited for this method.
In constructing the single-classification problem, this paper first defines a decision function that maps points in the data space to the feature space and attempts to maximize the distance between normal data points and the origin in the feature space. This problem can be described as choosing a kernel function to map the input data to a high-dimensional space. In this space, a hyper-sphere is sought to include all the normal data points while excluding the outliers. The center of this hyper-sphere, denoted as Z, may not necessarily be at the origin, and its radius E should be as small as possible to ensure the most compact description of normal behavior. The relaxation factor is denoted by γu. The constraint is represented as ||ψj(au)-z||2<=E2+γu, with γu>=0, where ψj(au) represents the mapping function. The constrained problem can be characterized by the following equation:
MINE,z,γE2+ZΣγuu (1)
s.t. ||ψj(au)-z||2<=E2+γu,γu>=0,∀u (2)
A Lagrange function is constructed, incorporating the constraints of the original problem into the objective function using Lagrange multipliers. Each data point introduces a Lagrange multiplier, corresponding to the constraint of whether the point lies within the hyper-sphere. The optimal solution is determined by solving the dual problem of the Lagrange function. In the dual problem, the constraints of the original problem are transformed into restrictions on the range of the dual variables. The KKT conditions are applied, which provide necessary and sufficient conditions for checking the solution. The Lagrange function is defined as follows:
M(E,z,γ,β,ε)=E2+ZΣuγu-Σuβu(E2+γu-||ψj(au)-z||2)-Σuεuγu (3)
Taking partial derivatives of the function leads to the minimum value:
$\begin{align} & \sum{_{u}{{\beta }_{u}}=1} \\ & z=\sum{_{u}{{\beta }_{u}}{{\psi }_{j}}\left( {{a}_{u}} \right)} \\ & Z-{{\beta }_{u}}-{{\varepsilon }_{u}}=0,\forall u \\\end{align}$ (4)
In the context of one-class SVM, optimizing the objective function involves minimizing the square of the radius of the hyper-sphere, while maximizing the distance between the data points excluded from the hyper-sphere and its boundary. Exceptional values or noise are handled through penalty parameters, quantifying the extent to which data points violate the boundary of the hyper-sphere. The final optimization objective function is expressed as follows:
$\begin{align} & M=\sum{_{u}{{x}_{u}}{{\psi }_{j}}\left( {{z}_{u}} \right)}\cdot {{\psi }_{j}}\left( {{a}_{u}} \right) \\ & \text{ }-\sum{_{u,k}{{\beta }_{u}}{{\beta }_{k}}\left( {{\psi }_{j}}\left( {{a}_{u}} \right) \right)\cdot {{\psi }_{j}}\left( {{a}_{k}} \right)} \\ & t.s.0.\le {{\beta }_{u}},\forall u \\\end{align}$ (5)
After solving the quadratic programming problem based on βu, the center of the hyper-sphere can be further calculated by z=Σuβuψj(au). Suppose the support vectors are represented by ψj(aj), the radius of the hyper-sphere can be characterized by E2=(ψj(au)*ψj(aj))-2Σuβu(ψj(au)*ψj(aj))+Σu,kβuβk(ψj(au)*ψj(ak)). It can be considered that if ||c-z||2>E, then c lies outside the hyper-sphere, indicating a thermal fault; if ||c-z||2≤E, then c lies within the hyper-sphere, indicating a normal condition.
2.3 Real-time remote monitoring method based on statistical quantities
The real-time remote monitoring method based on statistical quantities is suitable for cases with clear statistical models and involves monitoring using statistical models of thermodynamic parameters. When actual measurements deviate from the established statistical model, it may indicate an anomaly. Fault types like compressor overheating and hydraulic system overheating, due to their relatively stable operating parameters, are well-suited for this method.
Hotelling’s statistic is a multivariate statistical quantity used to detect if a sample set has a significant mean vector difference. This paper collects historical thermodynamic parameter data of equipment under normal operating conditions. It calculates the mean vector and covariance matrix of each thermodynamic parameter based on historical data. Further, it collects real-time data and calculates its mean vector. Finally, it compares the mean vector of the new data with the historical mean vector, using the covariance matrix to standardize the difference and calculates the Hotelling’s T² statistic to determine if the current state significantly differs from the historical normal state. Suppose the Hotelling statistic is denoted by S² and the square prediction error statistic by TOR, with vector 2-norm represented by ||·||₂. The following equation gives the S² statistic calculation formula for sample aNEW:
S2=aNEWS OT-1oaNEWS=||T-1/2oaNEWS||22 (6)
Control limits are used to determine whether the statistic indicates an anomaly. Suppose the Hotelling’s statistic follows an F-distribution. The control limits are calculated based on historical data and a selected confidence level. If the real-time calculated Hotelling’s statistic exceeds the control limit, it indicates an abnormal state, possibly predicting an overheating fault. Suppose the confidence level is represented by 1-β, and an F-distribution with the first degree of freedom as j and the second degree of freedom as v-j is represented by Dx(j,v-j), the following equation gives the control limit calculation formula for the statistic:
Sβ=j(v2-1)/v(v-j)Dβ(j,v-j) (7)
If the system is in a normal condition, the sample's T² should satisfy S2<Sβ. Otherwise, a thermal fault can be identified.
The Squared Prediction Error (SPE) statistic is used to measure the error in the model's prediction of new data. For real-time data, first calculate the difference between its predicted and actual values. Summing the squares of these differences yields the SPE statistic. For a new sample aNEW(l*1), there is:
TOR=aNEWS(1-OS)aNEW (8)
Control limits are used for the SPE statistic to determine if an anomaly has occurred. SPE's distribution is estimated based on the residuals of the prediction model. The SPE control limit is calculated based on the residual distribution and confidence level. Comparing the real-time calculated SPE statistic with its control limit, exceeding the limit indicates an anomaly. The control limit calculation formula for the SPE statistic is:
ϕe=Σlk=j+1ηek(e=1,2,3) (9)
g0=1-2ϕ1ϕ3/3ϕ22 (10)
In statistical monitoring, it is generally assumed that the monitoring statistics under control conditions follow a standard normal distribution. The statistics are transformed into the scores of a standard normal distribution. Based on the standard normal distribution table, calculate the limits for the corresponding confidence level. An anomaly is considered to have occurred if the real-time monitoring score exceeds the confidence limit. The confidence limit of the standard normal distribution zβ satisfies:
O{V(0,1)>Vzβ(0,1)}=zβ (11)
Figure 3 shows the real-time remote monitoring flowchart for the thermodynamic state of complex equipment systems.
Figure 3. Real-time remote monitoring flowchart for the thermodynamic state of complex equipment systems
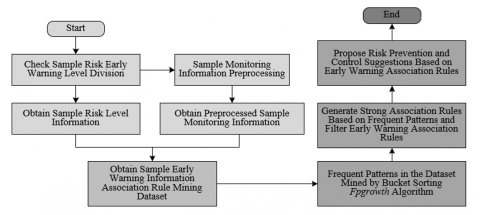
The thermodynamic parameters of complex equipment systems usually have rich correlations and inherent patterns. By mining frequent patterns among these parameters, typical parameter combinations before equipment overheating can be identified, providing a scientific basis for overheating early warning. Therefore, this paper proposes the Bucket Sorting Fpgrowth algorithm for mining overheating early warning information in the thermodynamic state of complex equipment systems. This method combines the data preprocessing capability of bucket sorting with the efficient pattern mining capability of Fpgrowth, effectively mining key overheating early warning information from large-scale complex equipment system thermodynamic parameter data. Figure 4 shows the flowchart of the proposed method for mining overheating early warning information in the thermodynamic state of complex equipment systems.
The proposed method for mining overheating early warning information of the thermodynamic state in complex equipment systems based on the Bucket Sorting Fpgrowth algorithm consists of two parts: FP tree construction and frequent pattern mining. The FP tree construction process is as follows:
Step 1: First, the system collects real-time thermodynamic parameters of the equipment, which may include temperature, pressure, flow, etc. Data needs to be recorded with timestamps to ensure the temporal accuracy of subsequent analysis. Further, scan the entire dataset, count each independent item, and establish a data dictionary containing each thermodynamic parameter and its corresponding occurrence count. This step not only lays the foundation for subsequent analysis but also provides the possibility for data compression. Suppose the name of the u-th item in the dataset is represented by ITu, its support count by NUMu, and the list of record numbers in the dataset where the item appears by mu=[x,...], with x representing the corresponding record number in the dataset where ITu appears. The dictionary expression is:
$F=\left\{ 'I{{T}_{u}}':\left\{ \begin{align} & 'Support\text{ }count':NU{{M}_{u}}', \\ & Number\text{ }of\text{ }this\text{ }item\text{ }in\text{ }the\text{ } \\ & dataset\text{ }records':{{m}_{u}} \\\end{align} \right\},... \right\}$ (12)
Finally, record the total number of records in the entire dataset, which is the basis for calculating the percentage of item support and helps determine the minimum support threshold.
Step 2: Set a minimum support threshold based on the characteristics of the equipment and past experience, reflecting the minimum frequency required for an item to be considered frequent. Using the set minimum support threshold, remove all infrequent items from the data dictionary that do not meet the criteria. Only those items that exceed the minimum support threshold can participate in the subsequent FP tree construction.
Step 3: To index all frequent items in the FP tree, create an item header table. It not only contains the name and support count of the item but also includes pointers to nodes in the FP tree with the same item. The item header table is sorted in descending order of item support count, ensuring that more frequent items are closer to the root of the tree, making the tree more compact.
Step 4: The bucket sorting algorithm is chosen for its efficiency under specific conditions. Since the support count of thermodynamic parameters may vary within a certain range, bucket sorting can complete sorting in nearly linear time. According to the range of support counts, different items are divided into different buckets. Items within each bucket are sorted according to their support count. After sorting is completed within each bucket, items from all buckets are merged to form a global list of items sorted in descending order of support count. The steps of the algorithm are:
(1) Before starting to build the FP tree, a list is needed to store the support count of each item. This list will be used to determine which items are frequent, i.e., they meet the requirements of the minimum support threshold.
(2) Check if the data dictionary is empty: Before processing the data dictionary, first check if the dictionary is empty. If the dictionary is empty, it means that no items meet the minimum support threshold, and therefore there is no need to build an FP tree.
(3) Traverse the data dictionary and add the support count of each item to the previously defined support count list. During the traversal, the support count of each item is stored in the support count list. This list will later be used to help sort and build the FP tree.
(4) Based on the distribution range of support counts, calculate the number of buckets needed. The efficiency of bucket sorting lies in its ability to evenly divide data into multiple buckets. Assuming an empty list is represented by Y, the minimum value of elements in S by MAX(S), and the maximum value of elements in S by MIN(S), the formula for calculating the number of buckets B_C is:
B_C=(MAX(S)-MIN(S))+1 (13)
According to the calculated number of buckets, initialize each bucket. Each bucket can be considered an array or list for storing items and their support counts within a specific range. After initializing the buckets, a two-dimensional list is obtained, with the content expression given by:
Y=[[0],[0],[0],[0],[0],[0],[0]] (14)
Figure 4. Method for mining overheating early warning information of thermodynamic state in complex equipment systems flowchart
(5) Traverse the data dictionary again, this time to allocate items to the appropriate buckets according to their support counts. Based on the support count of each item, determine which bucket they should enter. Items within each bucket are sorted according to support count, usually in descending order, to add nodes in order of support when building the FP tree. Suppose the support count of element u is represented by SUP(u), and the bucket number for storing element u is represented by Vu, then the bucket number for element u can be calculated through the following equation:
Vu=SUP(u)-MIN(S) (15)
Step 5: After completing the bucket sorting, we obtain a list of items sorted in descending order of support count. Such sorting is crucial for the construction of the FP tree. This list will be used as a blueprint for building the FP tree, with each record being constructed in the order of this list. This ensures the priority of frequent items during the construction of the tree. The order of the sorted result list also optimizes the structure of the FP tree, making it more likely that more frequent items share the same node, reducing memory usage and improving the efficiency of mining frequent itemsets.
Next, create the root node of the FP tree and process each record in the dataset based on the sorting results. The root node of the FP tree represents an empty set and provides a unified starting point for the added frequent items. For each record in the dataset, filter and sort the items of the record according to the sorting result list to generate a list of frequent items. This list only contains frequent items and is sorted by the frequency of the items.
Step 6: Traverse the list of frequent items of each record, starting from the root node, insert each item into the FP tree in the order of the list. If there is already a corresponding path in the tree, continue along this path and increase the count; if the path does not exist, create a new branch. While inserting nodes, update the linked list of the corresponding item in the item header table to maintain synchronization between the item header table and the nodes of the FP tree.
Once the FP tree is constructed, the FP_growth method can be executed to mine frequent patterns. The FP_growth method is a recursive method that first uses the linked list in the item header table to find all single item conditional pattern bases in the FP tree, and then builds a conditional FP tree for each conditional pattern base.
Here is the specific implementation process of the FP-growth method:
Step 1: First, the method FP_growth(FP_Tree, None) receives the initial FP tree and an empty prefix path (conditional pattern base). The initial FP tree already contains all frequent 1-itemsets, which are the starting points of the mining process. The item header table of the FP tree contains all frequent items and their linked list pointers, pointing to every instance of that item in the tree. The FP-growth algorithm starts from the bottom item of the item header table and visits each item in reverse order.
Step 2: For each item in the item header table, the algorithm traverses its linked list, collecting all its prefix paths. These paths form the conditional pattern base of the item. A conditional pattern base is a collection of paths remaining after pruning non-frequent branches from the tree. Then, the algorithm uses these conditional pattern bases to construct a new conditional FP tree, reflecting all transactions in the database that contain the current item. In building this tree, items that do not meet the minimum support are discarded. At this point, the FP_growth() method is recursively called, using the current item as a new suffix, combined with the previous prefix path (if any) to mine the conditional FP tree. This process generates all frequent patterns containing the current item. Each recursive call returns, combining the frequent itemsets mined at the current level with those at lower levels, gradually constructing the complete frequent patterns.
Step 3: By recursively constructing conditional FP trees and mining frequent patterns, the algorithm eventually generates all frequent itemsets. These frequent itemsets can be used to identify early warning patterns for equipment overheating. Finally, these frequent itemsets are analyzed to determine conditions that may cause equipment overheating. For example, if a specific combination of parameters frequently appears before overheating events, then this combination can be used as an early warning signal for overheating.
Table 1. Real-time remote monitoring information table for complex equipment systems
|
Sample Number |
Temperature |
Load Capacity |
Input Power |
Efficiency |
Speed Ratio |
|
1 |
50 |
54.26 |
332.25 |
85.36 |
0.9356 |
|
2 |
80 |
53.48 |
328.45 |
84.56 |
0.9248 |
|
3 |
110 |
52.69 |
324.56 |
84.26 |
0.9274 |
|
4 |
140 |
52.36 |
320.23 |
83.69 |
0.9146 |
|
5 |
170 |
51.78 |
319.56 |
82.78 |
0.9158 |
|
6 |
200 |
50.96 |
317.26 |
82.36 |
0.9023 |
Table 2. Comparison of accuracy between principal component regression and different real-time remote monitoring methods based on reconstruction error
|
Overheating Fault Type |
Kernel Principal Component Regression |
Multi-layer Autoencoder |
Convolutional Autoencoder |
Regularized Autoencoder |
|
Type 1 |
87.5 |
88.9 |
100 |
98.5 |
|
Type 2 |
95.6 |
97.8 |
97.8 |
97.8 |
|
Type 3 |
22.4 |
28 |
31.21 |
32.17 |
|
Type 4 |
95.6 |
97.3 |
98.51 |
98.2 |
|
Type 5 |
35.69 |
45.23 |
61.23 |
68.21 |
|
Type 6 |
98.4 |
98.5 |
100 |
100 |
|
Type 7 |
98.5 |
94.2 |
100 |
100 |
|
Type 8 |
88.4 |
91.3 |
92.31 |
95.3 |
The data in Table 1 covers parameters like temperature, load capacity, input power, efficiency, and speed ratio of complex equipment systems. By observing the data in the table, relationships between these parameters and how they vary with temperature can be found. It is observed that as the temperature increases from 50 to 200, the load capacity gradually decreases from 54.26 to 50.96, indicating that the equipment’s load capacity decreases with the rise in temperature. The input power decreases from 332.25 to 317.26, suggesting that the power required by the equipment decreases at higher temperatures, or due to the decrease in efficiency causing the change in input power. Efficiency drops from 85.36% to 82.36%, showing a decrease in efficiency with the increase in temperature. The speed ratio changes from 0.9356 to 0.9023, indicating that the equipment’s operating speed ratio to its design speed decreases with rising temperature. It can be concluded that the thermodynamic performance of the equipment declines with increasing temperature, reflected in the decrease in load capacity, efficiency, and speed ratio. The decrease in input power points to a drop in efficiency, as normally, with an increase in temperature, more energy is required to maintain the operation of the equipment if efficiency remains constant.
This paper proposes three different types of real-time remote monitoring algorithms for the thermodynamic state of complex equipment systems. Table 2 shows the accuracy comparison between Kernel Principal Component Regression and three different autoencoder-based monitoring methods (Multi-layer Autoencoder, Convolutional Autoencoder, Regularized Autoencoder) for different types of equipment overheating faults. It is evident that for Types 1, 2, 4, 6, and 7 of overheating faults, all methods demonstrate high accuracy, especially the Convolutional and Regularized Autoencoders, which achieved 100% accuracy in Types 1, 6, and 7. For all types of overheating faults, the accuracy of the autoencoders is generally higher than that of Kernel Principal Component Regression. This indicates that autoencoders are more effective in capturing abnormal patterns in equipment overheating data. The lower accuracy in Types 3 and 5 suggests that these fault types have significantly different characteristics from the others, or their abnormal patterns are more challenging to capture with these monitoring methods. Convolutional and Regularized Autoencoders generally have higher accuracy than Multi-layer Autoencoders, particularly in Type 5 where the Regularized Autoencoder significantly outperforms other methods, indicating its stronger recognition ability for complex or difficult-to-detect fault types. It can be concluded that the real-time remote monitoring methods based on reconstruction error using autoencoders are significantly effective for the detection of equipment overheating faults.
Table 3. Comparison of recall and fpr for different real-time remote monitoring methods based on single-classification
|
Overheating Fault Type |
Recall (%) |
FPR (%) |
||||
|
Decision Tree |
Linear SVM |
SMO |
Decision Tree |
Linear SVM |
SMO |
|
|
Type 1 |
85.64 |
98.56 |
100 |
0.14 |
0.13 |
0 |
|
Type 2 |
88.21 |
98.62 |
100 |
0.12 |
0.01 |
0 |
|
Type 3 |
87.14 |
99.36 |
99.46 |
0.84 |
0.64 |
- |
|
Type 4 |
87.85 |
99.54 |
100 |
2.36 |
0.04 |
0 |
|
Type 5 |
86.54 |
98.36 |
100 |
0.88 |
0.38 |
0 |
|
Type 6 |
85.14 |
99.35 |
98.25 |
0.21 |
0 |
0.006 |
|
Type 7 |
83.11 |
99.25 |
100 |
0.13 |
0 |
0 |
|
Type 8 |
84.69 |
98.47 |
95.36 |
2.2 |
0.11 |
0.14 |
Table 3 shows the comparison of Recall and FPR for different real-time remote monitoring methods based on single-classification, particularly Decision Tree, Linear SVM, and SMO. The table indicates that SMO has the highest or near-highest recall rates for all types of faults, especially achieving 100% in types 1, 2, 4, 5, and 7. Linear SVM also shows very high recall rates for all types of faults, especially exceeding 99% in types 3 and 4. While Decision Tree has a lower recall rate compared to SVM and SMO, it still maintains a high overall recall rate. Linear SVM generally has very low FPR, close to 0% in most fault types, indicating that it almost does not produce false alarms while maintaining a high recall rate. Decision Tree's FPR is slightly higher in some types of faults, particularly in types 4 and 8. SMO produces a very low FPR in type 6 and 0 FPR in other fault types. It can be concluded that SVM (especially Linear SVM and SMO) exhibits high effectiveness in real-time remote monitoring methods based on single-classification. Particularly in industrial applications requiring high reliability and precision, such as automated manufacturing, aviation, and nuclear industries, these characteristics are crucial. Linear SVM is favored for its simple model and ease of implementation, while SMO, as an effective algorithm for optimizing SVM, demonstrates excellent performance in detecting all types of faults.
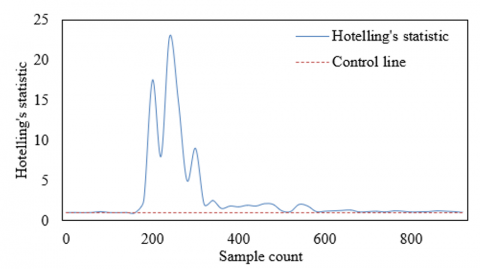
Figure 5 shows the Hotelling's statistic of a complex equipment system at different sample counts and the corresponding control lines.
Figure 5. Results of real-time remote monitoring of thermodynamic state in complex equipment systems based on statistical quantities
The graph indicates that most of the Hotelling's statistic values fluctuate near the control line, suggesting that most samples exhibit a normal thermodynamic state without significant anomalies. Around sample count 250, the Hotelling's statistic significantly exceeds the control line, reaching a range between 2.5 to 23. This indicates that the system experienced one or more overheating events at these sample points. The anomalies appearing around sample count 250 can help the maintenance team pinpoint the approximate time of the fault occurrence, analyze the causes of the fault, and take appropriate repair or preventive measures. It can be concluded that real-time remote monitoring methods based on statistical quantities can effectively monitor the thermodynamic state of complex equipment systems in real-time. As a monitoring tool, Hotelling's statistic can help maintenance teams identify abnormal changes in equipment status, especially overheating conditions. In this case, when the Hotelling's statistic value exceeds the control line, the method successfully identified potential overheating issues.
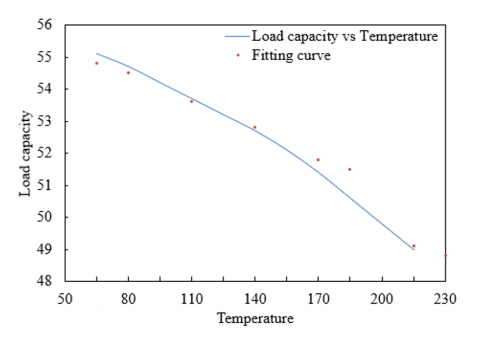
Figure 6. Temperature-load capacity fitting curve of complex equipment system
This paper further introduces the Bucket Sorting Fpgrowth algorithm for mining thermodynamic state overheating early warning information, which can efficiently process large amounts of data to discover potential fault modes and association rules. As seen from Figure 6, the load capacity shows a decreasing trend with the increase in temperature. This indicates that the equipment cannot maintain its maximum load capacity at higher temperatures. The fitting curve in the graph is typically used to predict or describe the trend of actual data. On most data points, the fitting curve closely approximates the actual data. However, the largest gap occurs at a temperature of 230, where the actual data shows a load capacity decrease to 49, while the fitted curve predicts 48.8. This suggests that the fitting model or algorithm can accurately capture the trend of the data. If this downward trend exceeds the normal operating parameter range of the equipment or is much faster than what historical data shows, it indicates that the equipment's load capacity is affected, due to overheating-induced damage or performance degradation. Particularly at high temperatures, if the reduction in load capacity exceeds the expected fitting curve, it can be an early signal of an overheating fault. In this case, with more data points, especially at points of sudden changes or anomalies, the Bucket Sorting Fpgrowth algorithm could be used to mine these potential rules.
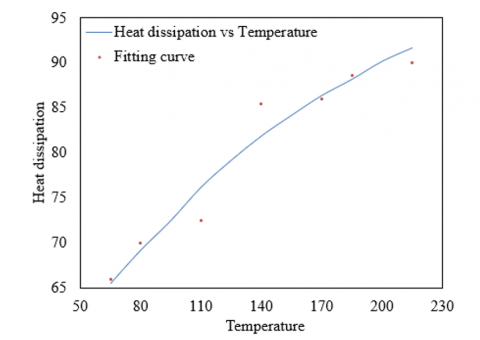
Figure 7 shows the relationship between temperature and heat dissipation in a complex equipment system, providing both actual observed data and corresponding fitting curve data. These data can be analyzed to understand how heat dissipation changes with temperature and to explore potential fault modes and association rules. The actual data indicates that as the temperature increases from 50°C to 230°C, the heat dissipation also increases from 65.5 to 91.7. This shows that the equipment's heat dissipation increases with temperature, which is consistent with physical laws, as heat dissipation is often related to the temperature difference. The fitting curve closely matches the actual data in the lower temperature range (50°C to 110°C), but at 140°C, the predicted heat dissipation of the fitting curve suddenly rises to 85.5, much higher than the actual 76.2. This sudden change suggests that the fitting model failed to accurately capture the trend of heat dissipation, or there is an anomaly in the equipment at this temperature point. If the actual value of heat dissipation significantly differs from the predicted value of the fitting curve, especially in the absence of obvious external factors, this points to issues with the equipment's cooling system. Mining association rules can reveal the precise relationship between temperature and heat dissipation, aiding in predicting expected values of heat dissipation at specific temperatures. Further, association rules can help understand at which temperature points the equipment's heat dissipation significantly deviates from the expected, thus allowing for early detection of faults or performance decline.
Figure 7. Temperature-heat dissipation fitting curve of complex equipment system
Table 4 provides the experimental results of mining overheating early warning information in complex equipment systems using the FPgrowth algorithm and the algorithm proposed in this paper, under different minimum support thresholds. These results include the runtime of both algorithms and the percentage of time saved by the proposed algorithm compared to the FPgrowth algorithm. By analyzing these data, the effectiveness of the proposed algorithm can be evaluated. In all given minimum support thresholds, the runtime of the proposed algorithm is shorter than that of the FPgrowth algorithm, indicating an efficiency improvement in the proposed algorithm. The time-saving percentage of the proposed algorithm compared to the FPgrowth algorithm varies between 8.35% and 21.78%. This means the proposed algorithm enhances computational efficiency, especially at minimum support thresholds set to 800 and 2789, where the highest time-saving percentages are 21.78% and 18.36%, respectively. As the minimum support threshold increases, the runtime of both algorithms decreases, as a higher minimum support threshold filters out more itemsets, thus reducing the number of frequent itemsets the algorithms need to process. The time-saving percentage of the proposed algorithm also increases with a higher minimum support threshold, particularly noticeable in the dataset of device 1. It can be concluded that the algorithm proposed in this paper demonstrates higher operational efficiency than the FPgrowth algorithm in all experimental settings for mining overheating early warning information in thermodynamic states. The time-saving percentage ranges from 8.35% to 21.78%, indicating that the proposed algorithm is particularly effective in processing large datasets, able to handle more data in less time. The effectiveness of the proposed algorithm is reflected not only in time savings but also in the optimization of the mining process, which is crucial for complex equipment systems requiring quick responses and real-time data analysis. By reducing computation time, fault warnings can be obtained faster, allowing for swifter measures to prevent potential damage due to equipment overheating.
Table 4. Results of overheating early warning information mining experiment on complex equipment systems' thermodynamic state
|
Dataset |
Minimum Support Threshold |
FPgrowth Algorithm Runtime |
Proposed Algorithm Runtime |
Time Saved by the Proposed Algorithm as a Percentage of Original Algorithm Runtime |
|
Equipment 1 |
400 |
8.456 |
7.895 |
8.35% |
|
600 |
2.135 |
2.153 |
9.45% |
|
|
800 |
1.254 |
0.874 |
21.78% |
|
|
Equipment 2 |
2458 |
289.36 |
245.32 |
16.89% |
|
2693 |
105.48 |
85.36 |
17.89% |
|
|
2789 |
27.89 |
21.45 |
18.36% |
The focus of this paper's research and experimental results is on developing and validating a series of real-time remote monitoring algorithms for timely detection and early warning of overheating faults in the thermodynamic state of complex equipment systems. The study proposes monitoring methods based on reconstruction error, single classification, and statistical quantities, as well as an optimized Bucket Sorting FPgrowth algorithm, to enhance the efficiency and accuracy of overheating warnings.
The reconstruction error monitoring algorithm uses machine learning technology to reconstruct normal state thermodynamic parameters for detecting anomalies. Experimental results show that autoencoder-based methods (multi-layer, convolutional, regularized autoencoders) have higher accuracy in detecting overheating faults compared to kernel principal component regression. The single classification monitoring algorithm focuses on situations where only normal state data is available. Experimental results indicate that SVM (linear SVM and SMO) shows higher recall rates and lower false positive rates in detecting different types of equipment overheating faults. The statistical quantity monitoring method uses the statistical characteristics of equipment operation data for anomaly detection. In practical applications, Hotelling’s statistic is used to detect significant changes in equipment status, effectively indicating potential overheating issues. The proposed algorithm for mining overheating early warning information in thermodynamic states is proven to be more efficient than the traditional FPgrowth algorithm in processing large amounts of data and discovering potential fault modes and association rules.
This paper validates the effectiveness of different real-time remote monitoring algorithms in monitoring the thermodynamic state of complex equipment systems through a series of experiments. These algorithms can timely detect equipment overheating faults, reducing the risk of equipment failure and ensuring stable system operation. Particularly, the optimized Bucket Sorting FPgrowth algorithm outperforms traditional methods in data mining efficiency and processing speed, crucial for industrial systems requiring real-time monitoring and rapid response. Overall, the application of these methods can improve the quality of equipment monitoring, reduce maintenance costs, and enhance the operational efficiency and reliability of the system.
This paper is a phased achievement of the scientific research project (Grant No.: 23C0762) funded by the Education Department of Hunan Province.
[1] Yan, H., Wang, J., Chen, J., Liu, Z., Feng, Y. (2022). Virtual sensor-based imputed graph attention network for anomaly detection of equipment with incomplete data. Journal of Manufacturing Systems, 63: 52-63. https://doi.org/10.1016/j.jmsy.2022.03.001
[2] Ren, H., Shi, X. (2022). Study on switching overvoltage of 500kV hydropower station with GIL outgoing line. In 2022 12th International Conference on Power, Energy and Electrical Engineering, Shiga, Japan, pp. 17-21. https://doi.org/10.1109/CPEEE54404.2022.9738655
[3] Madhvapathy, S.R., Arafa, H.M., Patel, M., Winograd, J., Kong, J., Zhu, J., Xu, S., Rogers, J.A. (2022). Advanced thermal sensing techniques for characterizing the physical properties of skin. Applied Physics Reviews, 9(4): 041307. https://doi.org/10.1063/5.0095157
[4] Le Thomas, N., Liu, Z., Lin, C., Zhao, H., Baets, R. (2021). Raman on-chip: current status and future tracks. Integrated Optics: Devices, Materials, and Technologies XXV, 11689: 7-17. https://doi.org/10.1117/12.2579222
[5] Qiu, L., Ouyang, Y., Feng, Y., Zhang, X., Wang, X. (2020). In vivo skin thermophysical property testing technology using flexible thermosensor-based 3ω method. International Journal of Heat and Mass Transfer, 163: 120550. https://doi.org/10.1016/j.ijheatmasstransfer.2020.120550
[6] Hu, P., Liu, H. (2017). Design and application of electrical equipment overheating monitoring based on wireless sensor. International Journal of Online Engineering, 13(7): 25-35. https://doi.org/10.3991/ijoe.v13i07.7277
[7] Žarković, M.D., Stojković, Z. (2015). Fuzzy logic and artificial neural network-based thermography approach for monitoring of high-voltage equipment. International Journal of Electrical Engineering Education, 52(1): 81-96. https://doi.org/10.1177/0020720915570541
[8] Kalhoro, M.U., Al-Saedi, K.A., Al-Awadhi, H.K., Nadeem, M. (2022). Remote monitoring of equipment performance through a customized real-time performance solution. In ADIPEC, Abu Dhabi, UAE, pp. SPE-211853-MS. https://doi.org/10.2118/211853-MS
[9] Su, C., Chen, W. (2022). Design of remote real-time monitoring and control management system for smart home equipment based on wireless multihop sensor network. Journal of Sensors, 2022: 6228440. https://doi.org/10.1155/2022/6228440
[10] Kaliappan, S., Natrayan, L., Garg, N. (2023). Checking and supervisory system for calculation of industrial constraints using embedded system. In 2023 4th International Conference on Smart Electronics and Communication, Trichy, India, pp. 87-90. https://doi.org/10.1109/ICOSEC58147.2023.10275952
[11] Lee, Y.J., Kwon, H.J., Seok, Y., Hong, S.J. (2022). IOT-based in situ condition monitoring of semiconductor fabrication equipment for e-maintenance. Journal of Quality in Maintenance Engineering, 28(4): 736-747. https://doi.org/10.1108/JQME-10-2020-0113
[12] Hu, J., Zhang, X. (2023). Defogging of monitoring images of soil and water conservation of consumer UAV based on image enhancement. In 2023 2nd International Conference on 3D Immersion, Interaction and Multi-sensory Experiences, Madrid, Spain, pp. 62-66. https://doi.org/10.1109/ICDIIME59043.2023.00018
[13] Verma, N., Singh, S., Prasad, D. (2022). A review on existing IoT architecture and communication protocols used in healthcare monitoring system. Journal of The Institution of Engineers (India): Series B, 103(1): 245-257. https://doi.org/10.1007/s40031-021-00632-3
[14] He, Z., Wang, Z., Ma, H., Shi, D., He, J., Mu, Z., Bai, Y. (2022). Study on the handheld monitoring equipment and the supervisory method for transportation loss of oil tank trucks. Journal of Physics: Conference Series, 2195: 012005. https://doi.org/10.1088/1742-6596/2195/1/012005
[15] Arif, M., Al Jneibi, A.M. (2022). Driving operations excellence during COVID-19 pandemic by capitalizing on digitalization. In ADIPEC, Abu Dhabi, UAE, pp. SPE-211264-MS. https://doi.org/10.2118/211264-MS
[16] Kun, X., Wang, Z., Zhou, Z., Qi, W. (2021). Design of industrial internet of things system based on machine learning and artificial intelligence technology. Journal of Intelligent & Fuzzy Systems, 40(2): 2601-2611. https://doi.org/10.3233/JIFS-189252
[17] Su, M., Wei, S., Huang, L., Xu, H. (2019). Instrument and equipment monitoring system based on the internet of things technology. Tenth International Symposium on Precision Engineering Measurements and Instrumentation, 11053: 912-915. http://doi.org/10.1117/12.2512174
[18] Vrvilo, P., Vidović, T., Matulić, N., Roldo, L., Radica, G. (2023). Methods and equipment for analysis and diagnostics of marine engines. In 2023 8th International Conference on Smart and Sustainable Technologies, Split/Bol, Croatia, pp. 1-6. https://doi.org/10.23919/SpliTech58164.2023.10193170
[19] Saini, M.K., Saini, J.S., Kumar, R. (2020). Coiflet based deblurring of insulator images for remote monitoring. In 2020 IEEE 9th Power India International Conference, Sonepat, India, pp. 1-6. https://doi.org/10.1109/PIICON49524.2020.9113053
[20] Li, J., He, H. (2019). Design of rice intelligent water-saving irrigation system based on agricultural internet of things. Journal of Physics: Conference Series, 1176: 052068. https://doi.org/10.1088/1742-6596/1176/5/052068
[21] Robert, S., Fiffick, W., Davis, D., Guillory, R., Myers, J., Mandava, C. (2018). Optimizing Remote Operations Support Using an Effective Real-Time Model for Improved Drilling Performance. In IADC/SPE Drilling Conference and Exhibition, Fort Worth, Texas, USA, pp. SPE-189663-MS. https://doi.org/10.2118/189663-MS