Wei Yang![]() | Peibo You*
| Peibo You*![]()
© 2023 IIETA. This article is published by IIETA and is licensed under the CC BY 4.0 license (http://creativecommons.org/licenses/by/4.0/).
OPEN ACCESS
As infrastructure ages, their stability and durability of bridge structures will face new challenges caused by the coupling of multiple physical fields, among which the thermal stress has a particularly profound impact on the structural integrity and safety of bridges. Centered on this coupling effect, this study aims to give a comprehensive investigation on the thermal stress of bridge structures under the influence of multi-field coupling and assess their fatigue life. At first, this study explores in detail the calculation methods for homogeneous material properties, such as the coefficient of linear expansion, elastic modulus, and Poisson's ratio under the influence of various physical fields, and gains accurate calculation results of the linear expansion coefficient and thermal stress of bridge concrete. Then, models are built for analyzing the bridge fatigue performance based on stiffness degradation, including a bridge structure fatigue damage model and a fatigue damage model based on load-bearing capacity degradation, also, a model for the degradation of load-bearing capacity of bridges with stiffness degradation and its residual load-bearing capacity are computed. Existing studies mostly focus on the effects of a single physical field or simplified fatigue damage accumulation models, neglecting the influence of the complex coupling of physical fields and the nonlinearity nature of material properties. By introducing considerations about the structural stiffness degradation under multi-field coupling, this study provides a new perspective and method for assessing the fatigue life of bridges. The findings of this paper not only increase the accuracy of structural thermal stress analysis but also provide theoretical basis and practical guidance for the prediction and maintenance of long-term bridge performance in bridge engineering through establishment of fatigue damage models.
multi-field coupling, bridge structures, thermal stress analysis, fatigue life assessment, stiffness degradation, load-bearing capacity, residual life
Bridges are indispensable infrastructures of transportation, and their stability and durability are crucial for socio-economic development [1-3]. During their long-term service, inevitably, bridge structures are subject to the coupling effect of multiple physical fields, among which the effects of thermal stress effects are particularly significant [4, 5]. Temperature variations can cause thermal expansion and contraction, thereby critically impacting the structural integrity and safety of bridges. So an in-depth analysis of thermal stress in bridge structures under multi-field coupling, along with the resultant changes in fatigue life, form a foundation for ensuring safe bridge operations [6-9].
The significance of related studies is not only reflected in the direct impact on bridge safety but also relates to the maintenance cost and service life of bridges [10-13]. With increasing loads on the bridges and the changing environmental conditions, the fatigue damage of bridge structures will gradually intensify [14, 15], thus, accurately assessing the fatigue life of bridges under the influence of multi-field coupling is of great economic value and social significance for bridge design, evaluation, and maintenance, and these are helpful in the optimization of bridge design and maintenance strategies [16, 17].
However, existing methods generally have limitations in bridge thermal stress analysis and fatigue life assessment under multi-field coupling. For instance, some studies are confined to the effects of a single physical field or they assume simplified boundary conditions, overlooking the interactive impacts between different physical fields [18-20]; and some studies fail to fully consider non-linear characteristics of materials or the impact of structural stiffness degradation on fatigue performance over prolonged service periods when adopting linear cumulative damage theories to assess the fatigue life [21-24].
To address these gaps, this paper aims to systematically analyze the thermal stress in bridge structures under multi-field coupling and assess their fatigue life on this basis. The first part of this paper discusses in detail the methods for calculating the properties of homogeneous materials, such as the coefficient of linear expansion, elastic modulus, and Poisson's ratio, under multi-field coupling, and the accurate calculation of the linear expansion coefficient and thermal stresses of bridge concrete. The second part constructs a bridge structural fatigue damage model based on stiffness degradation, and meticulously analyzes the bridge load-bearing capacity degradation model and its residual load-bearing capacity. The methods and models presented in this study provide more accurate theoretical basis for the design and evaluation of bridge engineering, and they have high practical value in the formulation of maintenance strategies and life prediction of bridges.
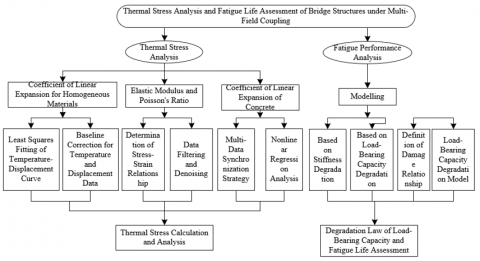
The multi-field coupling experienced by bridges during their service life is multi-dimensional and quite complicated. These interactions include not only the common mechanical loads such as traffic load, wind, and seismic actions, also the coupled effects of environmental factors like temperature, humidity, and chemical corrosion. Firstly, from a thermodynamic perspective, bridge structures must be able to withstand the physical effects caused by temperature changes. Sun exposure, temperature fluctuations, and seasonal variations can all lead to material thermal expansion or contraction, inducing thermal stress, and such stress is closely related to the properties of the materials of the bridges, such as the coefficient of linear expansion and elastic modulus, as they can induce or exacerbate the formation of cracks, affecting the overall structural response. Secondly, the impact of dynamics on bridges is significant as well, as the dynamic loads generated by traffic flow, the vibrations caused by wind forces, and even the shock waves from seismic activities are all kinds of dynamic effects that bridges must endure. These dynamic loads interact with the natural frequency of the structure, and may potentially cause the resonance phenomena, thereby amplifying stress response and accelerating fatigue process. Furthermore, bridges also face challenges from fluid dynamics, the direct impact and long-term erosion of river currents, floods, and wind can threaten bridge stability. Both the foundation scouring caused by water flow and the unsteady aerodynamics caused by wind load should be considered in structural design and assessment. Besides, during their service life, bridges are also subjected to chemical and biological erosion, chemical agents like deicing salts, acid rain, and pollutants can all corrode bridge materials; the growths of microorganisms and plants can damage the structure, and hurt the bridge's durability and structural integrity as well. The interactions between multiple fields are not isolated but interact, together, these factors can affect very part of the structure. For example, the thermal stress caused by temperature changes may superimpose with the stress induced by vehicles, resulting in concentrated stress and increased fatigue damage; another example is that temperature variations can alter the rate of chemical reactions, thereby accelerating the corrosion process. The nonlinear features and interactions of these coupled effects need to be precisely calculated and modeled, so as to make accurate predictions and to ensure the safety, reliability, and cost-effectiveness of the bridge design. Overall speaking, the multi-field coupling in bridges is a complex issue involving mechanics, thermodynamics, fluid dynamics, and chemistry, and a good understanding about these couplings are important for bridge design, assessment, maintenance, and lifespan prediction. Figure 1 gives the research route of this paper.
Figure 1. Research route of this study
To analyze thermal stress of bridge under multi-field coupling, this study focuses on four key aspects for detailed calculation and analysis: coefficient of linear expansion of homogeneous materials, elastic modulus & Poisson's ratio, coefficient of linear expansion of concrete, and thermal stress.
The linear expansion coefficient is defined as the ratio of the change in unit length of a material to its original length and the change in temperature. The fundamental principle of this coefficient is based on thermodynamics and solid-state physics, and it reflects the material's thermal expansion property. Under the influence of multi-field coupling, temperature variations will cause thermal expansion or contraction to construction materials of the bridge, thereby generating thermal stress. Hence, an accurate coefficient value of linear expansion is helpful in predicting the dimensional changes that a structure may experience under specific temperature conditions.
Calculations of this linear expansion coefficient of homogeneous materials of bridges under multi-field coupling contain several steps, including precise measurement and data processing. Before experiment, researchers must make sure that all sensors are correctly installed and configured. Dilatometer is usually used to measure linear expansion coefficient, this meter is equipped with high-precision temperature and displacement sensors. The sensors should be installed on samples of homogeneous materials that can represent main parts of a bridge to make sure that they can accurately record temperature changes and corresponding dimensional variations. Under multi-field conditions, researchers should also consider protecting sensors from interference of other fields, such as humidity, chemical corrosion, or mechanical load. During measurement, an appropriate temperature range should be set to cover the lowest and highest environmental temperatures that the bridge might encounter, and multiple sensors should be used for simultaneous measurements at different locations, so as to overcome potential measurement errors and the effects of local heterogeneity. In addition, experimental conditions should be controlled, such as conducting measurements in a constant temperature environment to minimize external disturbances. During the measurement, continuous data collection should be carried out to capture the material’s immediate response to temperature changes. After data collection, linear expansion coefficient should be extracted using data processing methods. At first, the data of temperature and displacement should subject to baseline correction to eliminate possible equipment bias or systematic error. Second, applying the definition of linear expansion coefficient, which is the change in unit length divided by the temperature change, the value of this coefficient should be calculated. During data processing, statistical methods may also be needed to handle data dispersion, such as using the least squares method to fit the temperature-displacement curve, and determining the optimal estimated value of the said coefficient. Assuming: β1Su represents the linear expansion coefficient of the test specimen, β2Su represents the linear expansion coefficient of quartz, iγ1Su represents the thermal output of the test specimen, γ2Su represents the thermal output of quartz, ∆Su represents the temperature difference, then the formula for calculating the specimen's linear expansion coefficient is:
$\beta_{1 S_u}=\beta_{2 S_u}+\left(\gamma_{1 S_u}-\gamma_{2 S_u}\right) / \Delta S_u$ (1)
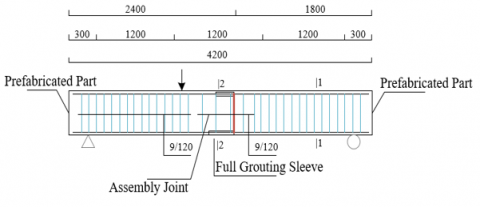
Figure 2. Dimension and reinforcement layout of bridge specimen
The elastic modulus is an indicator of a material's resistance to deformation under stress, its value can be calculated based on the Hooke's Law, that is, within the elastic limit, stress is directly proportional to strain. The Poisson's ratio describes the relative dimensional change of a material in the perpendicular direction when it is compressed or stretched in a direction. Under the influence of coupled fields, different physical impacts may alter these two indicators of a material, thereby affecting the stress-strain relationship of the structure.
Under the multi-field coupling condition, the calculation of elastic modulus and Poisson's ratio of bridges involves precise measurement of the material's mechanical response and very carefully processing of the experimental data. Elastic modulus and Poisson's ratio are usually determined by measuring the stress-strain relationship of the material under load, and this requires the use of sensors capable of accurately measuring stress and strain. On bridge structures, these sensors should be scientifically placed to capture the strain responses in different directions, so as to get data from multiple directions and to calculate the Poisson's ratio. Figure 2 gives the dimension and reinforcement layout of a bridge specimen. To simulate the influence of multi-fields, sensors are exposed to specific environmental conditions and are used to monitor the influence on the mechanical properties of the material. During experimental measurement, the loading rate and method should be controlled to that the strain is uniform and controllable, thus reducing the errors caused by local non-uniformity. At the same time, loading-unloading cycles should be employed to help differentiate between elastic and plastic deformation, so as to more accurately determine the elastic modulus. In order to further overcome the system errors, the method of averaging multiple measurements can be adopted, high-precision instruments and well-calibrated equipment should be used, mechanical principles should be applied, and stress-strain curves could be used to calculate the elastic modulus, that is, to compute the slope of the ratio of stress to strain in the elastic region. On the other hand, the Poisson's ratio can be determined based on the ratio of lateral strain to longitudinal strain, and the experimental data should be subject to digital signal processing techniques to filter and denoise and to improve data quality. After that, data regression analysis, such as the least squares method, should be adopted to fit the curve and to extract accurate values for elastic modulus and Poisson's ratio. Assuming: γLSu represents the strain caused by force at temperature Su, γ1Su represents the strain without load at temperature Su, then the formula for calculating the difference in strain between loaded and unloaded conditions at a certain temperature Su is given below:
$\Delta \gamma_{S_u}=\gamma_{2 S_u}-\gamma_{1 S_u}=\gamma_{L S_u}$ (2)
Assuming: X represents the cross-sectional area of the test specimen under force, then the formula for calculating the elastic modulus RSu of the bridge specimen under temperature Su and dead load D is:
$R_{S_u}=\frac{D}{X \Delta \gamma_{S_u}}$ (3)
Assuming: nSu represents the Poisson's ratio of the material at temperature nSu, ∆γgSu represents the lateral strain at temperature ∆γgSu, ∆γcSu represents the longitudinal strain at temperature Su, then the Poisson's ratio of the bridge specimen material can be calculated using this formula:
$n_{S_u}=\frac{\Delta \gamma_{g S_u}}{\Delta \gamma_{c S_u}}$ (4)
The calculation of the linear expansion coefficient of bridge concrete needs to consider the multi-phase nature of concrete, as it consists of aggregates, cement paste, and possibly other additives. The different components respond differently to temperature changes, so their different expansion coefficients and volumetric proportions must be considered. Besides, the micro-structure of concrete and its hydration process can also influence its thermal expansion behavior, thus, calculating the linear expansion coefficient of bridge concrete is a complex process, which needs to combine principles of materials science, thermodynamics, and solid-state physics.
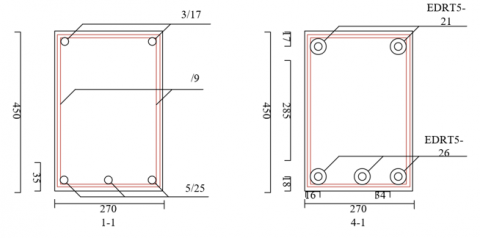
Figure 3. Cross-sectional view of the bridge specimen
As stated above, calculating the linear expansion coefficient of bridge concrete under multi-field coupling conditions is a complex process, since it involves not only the changes in temperature field but also the potential influences from mechanical loads, humidity variations, and other factors. Initially, a suitable sensor type should be selected according to the composition and structural characteristics of the concrete. The temperature sensors should be able to accurately measure the temperature changes of the samples. In the meantime, the displacement sensors or deformation meters should be installed on the samples to record their dimensional changes under the influence of temperature. Figure 3 gives the cross-sectional view of a bridge specimen. In a multi-field environment, it’s important to ensure that these sensors can simultaneously overcome interference caused by humidity, chemical corrosion, or other environmental factors. When measuring the linear expansion coefficient, the repeatability and accuracy of the experiment must be ensured, and this often means conducting multiple tests in a controlled environment to ensure data reliability. Moreover, using multiple sensors for synchronized measurement can reduce errors caused by equipment or the non-uniformity of samples. During experiment, temperature changes should be controlled smooth and uniform to avoid errors caused by temperature gradient. The processing of experimental data needs to consider heterogeneity of the concrete. In data analysis, suitable mathematical models should be used to process the experimental data, so as to obtain an accurate value of linear expansion coefficient, including using suitable statistical methods to analyze data scatter and using nonlinear regression analysis to determine the most appropriate value of linear expansion coefficient. Furthermore, the thermal hysteresis effect that may occur during the experiment and any possible nonlinear response caused by multi-field coupling should be considered. Let: εj=(1+n0)/3(1-n0), assuming: n0 represents the Poisson's ratio of the mortar; j0 and j1 represent the bulk modulus of the mortar and the aggregates, respectively; ψ1 represents the volumetric fraction of the aggregates, then the formula for calculating the effective bulk modulus j-of the bridge concrete is:
$\bar{j}=j_0+\frac{\psi_1\left(j_1-j_0\right)}{1+\varepsilon_j\left(1-\psi_1\right)\left(\frac{j_1}{j_0}-1\right)}$ (5)
In this paper, it’s assumed that the linear expansion coefficient tensor of the materials of bridge concrete is isotropic, and the tensor average of stone and mortar in the concrete composite material is represented by “< >”, β denotes the coefficient of linear expansion, j denotes the bulk modulus, then the formula for calculating the linear expansion coefficient of the bridge concrete is:
$\bar{x}=\langle\beta\rangle+\frac{\left(\frac{1}{\bar{j}}-\left\langle\frac{1}{j}\right\rangle\right)\left(\beta_1-\beta_0\right)}{\frac{1}{j_1}-\frac{1}{j_0}}$ (6)
The calculation of thermal stress is conducted based on thermoelastic theory, namely, when a material is subjected to a non-uniform temperature field, the expansion or contraction of different parts of it is constrained, then an internal stress is generated. The calculation of thermal stress needs to combine geometric deformation caused by thermal expansion with mechanical behavior of materials. Under multi-field coupling, interactions between temperature changes and other physical fields should be considered, as they may affect mechanical properties and thermal expansion behavior of materials.
Moreover, thermal stress calculation under multi-field coupling involves accurate assessments of stress responses of bridge structures under combined effects of temperature, load and other environmental factors. First, high-precision temperature sensors were used to monitor temperature changes in various bridge components, they may include thermocouples, infrared sensors or fiber optic sensors, and they should be placed at key positions of the bridge to capture distribution and variation of temperature field. As for strain gauges or other types of stress monitoring sensors deployed to record material strains caused by temperature changes, they should be precisely placed in areas where thermal stress concentration is anticipated. The measurement of temperature and stress/strain should be synchronized to ensure accurate correlation between temperature changes and stress/strain responses. In terms of data processing, the measurement of temperature and stress/strain should also be synchronized to ensure effective comparison and analysis. Using suitable thermoelastic theories and finite element analysis tools to convert temperature change data into thermal stress may involve complex numerical methods. The calculation results should be subjected to statistical analysis to determine distribution range, maximum values, and other important features of thermal stress. If necessary, the actual structural response should be considered, and parameter sensitivity analysis may be required to assess the impact of uncertainties on thermal stress prediction. Assuming: δSu represents the axial thermal stress at a measurement point at temperature Su; γySu represents the temperature strain of the reinforcing steel bars in the beam at temperature Su; γtSu represents the free expansion strain of the reinforcing steel bars at temperature Su; then the formula for calculating the thermal stress is:
$\delta_{S_u}=\left(\gamma_{y S_u}-\gamma_{t S_u}\right) \times R_{t S_u}$ (7)
In the field of bridge engineering, fatigue performance analysis is crucial for predicting structural life, formulating maintenance strategies, and ensuring public safety. The fatigue performance analysis of bridge based on stiffness degradation under multi-field coupling is particularly important. First, through their service life, bridges are subjected to the combined effects of multiple physical fields, such as traffic loads, temperature fluctuations, wind loads, and rainwater erosion. These factors, both individually and in combination, will affect the structural stiffness of the bridge. Therefore, traditional analysis methods considering only one single factor cannot fully simulate the structural response of bridges in actual situations, so conducting simulations on the bridges’ real responses in complex environments is necessary. Next, during the long-term service, bridges experience gradual stiffness degradation due to material aging, damage accumulation, and environmental erosion, and this stiffness degradation can directly affect the load-bearing capacity and dynamic characteristics of the bridge, thereby impacting its fatigue performance. Thus, effectively assessing the impact of stiffness degradation on fatigue performance is essential for predicting and extending the lifespan of bridges.
Over time, bridge structures will experience stiffness degradation due to environmental erosion, material aging, and continuous loading, such degradation manifests as a decline in material properties, such as reduced modulus, and initiation and propagation of cracks. Additionally, fatigue damage is a cumulative process influenced by stress levels, number of loading cycles, and material properties. In bridge fatigue analysis, fatigue damage accumulation models are usually used to predict the cumulative effect of damage under repetitive loading. This model must be able to describe the dynamic process of stiffness degradation, including the rate and extent of degradation. Assuming: FY represents the structural damage variable defined by stiffness, then the bridge structure fatigue damage model established based on stiffness degradation under multi-field coupling condition can be expressed as:
$F_Y=\frac{Y_0-Y_{v e}}{Y_0-Y_{V e}}$ (8)
Next step, this study constructs a bridge fatigue damage model based on load-bearing capacity degradation under multi-field coupling, and the modelling is based on three assumptions:
(1) Assumption of load characteristics
The amplitude and frequency of load cycles are known, they remain constant or change according to a predictable pattern throughout the analysis period. The position, distribution, and direction of load application are constant, or their changes can be described in a determinate manner.
(2) Assumption of material behavior
The fatigue characteristics of the material are known, they are consistent for all considered environmental conditions and load cycles. The relationship between the material's mechanical properties and the number of cycles is predictable and is represented in the model by an appropriate fatigue damage accumulation law.
(3) Assumption of structural response
The response of bridge structure is mainly caused by external loads; other factors, such as temperature and humidity changes, are considered in the model as correction factors or separate effects. The deformation of the structure under load conforms to linear elastic behavior until approaching the fatigue limit, implying that no significant plastic deformation occurs during the fatigue process.
Assuming: FT represents the damage variable defined by load-bearing capacity and FT∈[0,1]; T0 represents the initial load-bearing capacity of a component; Tve represents the residual load-bearing capacity of the degraded component after going through v loading cycles; TVe represents the fatigue failure of the component, then, based on the aforementioned assumptions, the bridge damage model based on load-bearing capacity degradation under multi-field coupling is defined as follows:
$F_T=\frac{T_0-T_{v e}}{T_0-T_{V e}}$ (9)
To establish a direct relationship between fatigue damage and load-bearing capacity of bridges under the multi-field coupling, this study attempts to quantify the progression of fatigue damage as a time-dependent variable, that is, define the load-bearing capacity degradation in the bridge fatigue damage model as a function of the ratio of fatigue life, this equivalent method offers an intuitive way to assess the performance decline caused by fatigue damage, and this relationship can help engineers predict the possible remaining life of a bridge under specific cyclic loads. Moreover, by taking the ratio of fatigue life as a measurable indicator, the calculation process can be simplified to make the model be implemented more easily. Assuming the function is ψ(v/V), then there is:
$F_T=\frac{T_0-T_{v e}}{T_0-T_{V e}}=\psi\left(\frac{v}{V}\right)$ (10)
Assuming: FT represents the load-bearing capacity degradation function, then, upon normalizing the aforementioned equation, it yields:
$\frac{T_{v e}}{T_0}=1-\left(1-\frac{T_{V e}}{T_0}\right) \psi\left(\frac{v}{V}\right)$ (11)
Based on the bridge structural fatigue damage model constructed based on stiffness degradation, and the bridge damage model constructed based on load-bearing capacity degradation, it’s known that although these two models start from different characteristics, they share many common features when applied to the problem of bridge fatigue damage. Both models, whether based on stiffness degradation or load-bearing capacity degradation, employ the concept of cumulative damage, and this implies that damage increases with the the passing of time and the accumulated action of cyclic loads, and this impact of damage is accumulative. Both models reflect that fatigue damage does not occur instantaneously but gradually develops over time. This time dependency means that the performance of the structure decreases with increased use and over time, and both stiffness degradation and load-bearing capacity degradation pay close attention to the mode of load application, including the size, frequency, and type of the load. The load cycles play a decisive role in the accumulation of fatigue damage. Therefore, under the effects of multi-field coupling, there is an intrinsic connection between the fatigue damage based on stiffness degradation and the fatigue damage based on load-bearing capacity degradation in bridges.
Since there is this intrinsic connection between the fatigue damage of bridges based on stiffness degradation and fatigue damage based on load-bearing capacity degradation under multi-field coupling, this paper defines the relationship between stiffness degradation and load-bearing capacity degradation as a mathematical function or model, which can convert stiffness degradation into a quantifiable indicator of load-bearing capacity degradation. This relationship is nonlinear and depends on multiple factors, and it can be defined as follows:
$F_T=\left(F_Y\right)^O$ (12)
By combining the expression of FY and FT with Formula 12, we have:
$\frac{T_0-T_{v e}}{T_0-T_{V e}}=\left(\frac{Y_0-Y_{v e}}{Y_0-Y_{V e}}\right)^O$ (13)
After further transforming above formula, it results in:
$T_{v e}=T_0-\left(T_0-T_{V e}\right)\left(\frac{Y_0-Y_{v e}}{Y_0-Y_{V e}}\right)^o$ (14)
By dividing both sides of the beam stiffness equation by Y0 after several cycles of loading, we can get σ(v/V):
$\frac{Y_0-Y_{v e}}{Y_0-Y_{V e}}=1-\frac{1-\left(\frac{v}{V}\right)^i}{1-\left(\frac{v}{V}\right)^n}$ (15)
By combining the above two formulas, there is:
$T_{v e}=T_0-\left(T_0-T_{V e}\right)\left[1-\frac{1-\left(\frac{v}{V}\right)^i}{1-\left(\frac{v}{V}\right)^n}\right]^o$ (16)
By dividing both sides of the above formulas by T0, the bridge load-bearing capacity degradation model based on stiffness degradation can be written as:
$\frac{T_{v e}}{T_0}=1-\left(1-\frac{T_{V e}}{T_0}\right)\left[1-\frac{1-\left(\frac{v}{V}\right)^i}{1-\left(\frac{v}{V}\right)^n}\right]^o$ (17)
This is because, under multi-field coupling, bridge structures are subjected to various complex influences, including temperature changes, humidity, mechanical loads, wind forces, and chemical corrosion. These factors not only lead to stiffness degradation of the structure but also affect its load-bearing capacity. When constructing the bridge load-bearing capacity degradation model based on stiffness degradation, the role of correlation parameters is extremely important, as they can represent the mathematical link between stiffness degradation and load-bearing capacity degradation and describe the proportional relationship between load-bearing capacity and initial stiffness, or the extent to which the load-bearing capacity is affected by stiffness degradation.
The values of these correlation parameters are obtained through a series of steps including experimentation, theoretical analysis, and data processing. At first, the stress-strain data is collected through loading tests to obtain the mechanical behavior of the material. Strain gauges or other sensors are used to monitor the response of materials or components under cyclic loads. The stiffness of specimens under loads at each loading stage can be calculated by measuring the displacement response, and its value can be attained from the slope of the stress-strain relationship. By gradually increasing the load until the specimen fails, the structure's maximum load-bearing capacity can be determined, and the variations in load-bearing capacity at different load levels can be attained as well.
Further, based on the constructed damage evolution model, numerical tools such as finite element analysis can be used to simulate the experimental process, thereby predicting the structural response under multi-field coupling. Numerical simulation can help identify key factors affecting stiffness and load-bearing capacity. Based on theoretical and numerical models, the correlation parameters can be estimated.
At last, perform statistical analysis on the collected experimental data to determine stiffness degradation and load-bearing capacity degradation under different test conditions, and compare the experimental data with model values, adjust the correlation parameters in the models until the model output aligns with the experimental data.
The experiment conducted in this study involves two materials commonly used in bridge construction: cement mortar and limestone. Their mechanical properties and thermal behavior have a significant impact on the overall performance of bridges. For each material, a control group specimen and six test group specimens were prepared for the comparison under loaded and unloaded conditions, and the repeatability test, and to ensure the reliability of the data.
In terms of the arrangement of strain gauges and their usage, both the control group specimens of cement mortar and limestone were equipped with strain gauges in bilateral longitudinal and transversal arrangement, but no pressure was applied, for the purpose of evaluating the impact of environmental factors such as temperature on the materials under unloaded state. In the tests of linear expansion coefficient, three specimens in single side middle arrangement were adopted, such arrangement is conductive to capturing the strain of the materials under one-dimensional thermal expansion state. In the tests of elastic modulus and Poisson's ratio, three specimens in bilateral longitudinal and transversal arrangement were adopted, and this arrangement allows the simultaneous measurement of axial and lateral strain, so as to analyze the stress-strain relationship of the material and calculate the elastic modulus and Poisson's ratio. In the tests of beam components, six measuring points arranged in the middle of the rebar were adopted, indicating that the focus of this test is the distribution of thermal stress within the beam component, especially the interaction between steel rebar and concrete. In the tests of rebar, a control was designed for measuring the coefficient of linear expansion, with strain gauges arranged in middle on one side, aiming at comparing the thermal behavior of concrete, this is because the differences in the linear expansion coefficients between steel rebar and concrete can affect the thermal stress state of the entire structure (Table 1).
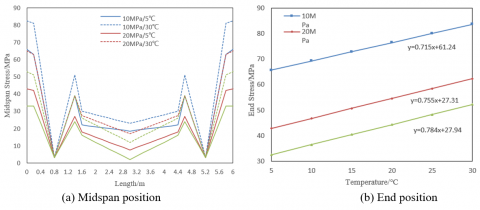
Figure 4(a) shows the data of stress variations at midspan positions of bridge specimens withe the change of length under different pressure and temperature conditions. As can be seen from the figure, it seems that the increase of temperature and pressure seem have a significant impact on the stress distribution of the specimens. Under a same pressure, the stress values at higher temperatures (the 30°C column) are generally higher than those at lower temperatures (the 5°C column). As the length increases, the stress values show a trend of decreasing first and increasing later, indicating the occurrence of stress concentration or stress relief at specific positions, and this fluctuation is related to the specimen's geometric shape, loading method, or internal defects. At the 0.8 and 5.2 length positions, under all conditions, the stress values drop sharply to 3 MPa, indicating a weak point in the specimen or an intentionally designed stress relief area. The data shows that, the specimen's stress is sensitive to temperature changes, and this means that the specimen's performance under thermal stress is significantly influenced by temperature, which is an important consideration in the context of multi-field coupling. Under a same temperature, with the increase of pressure, the stress values increase as well, but the increment amplitude is not linear, and this is related to the material's nonlinear elastic behavior or plastic deformation. In summary, the stress distribution of specimens exhibits significant dependence on temperature and pressure, showing characteristics of stress concentration or relief at specific positions. These findings are crucial for understanding the fatigue behavior and failure mechanisms of bridge materials under the influence of multi-field coupling, and they should be considered in the design, evaluation, and maintenance of bridges.
Table 1. Layout and usage details of bridge specimen sensors
|
Material type |
Specimen Quantity |
Arrangement of Strain Gauge |
Usage |
|
Cement mortar |
1 |
Bilateral Longitudinal and Transversal arrangement |
No Pressure Applied, Control Group |
|
Cement mortar |
3 |
Single side middle arrangement |
Coefficient of Linear Expansion |
|
Cement mortar |
3 |
Bilateral Longitudinal and Transversal arrangement |
Elastic Modulus and Poisson's Ratio |
|
Limestone |
1 |
Bilateral Longitudinal and Transversal arrangement |
No Pressure Applied, Control Group |
|
Limestone |
3 |
Single side middle arrangement |
Used to Calculate the Coefficient of Linear Expansion |
|
Limestone |
3 |
Bilateral Longitudinal and Transversal arrangement |
Used to Calculate the Elastic Modulus and Poisson's Ratio |
|
Beam Component |
3 |
6 Measuring Points Arranged in the Middle of the Rebar |
Used to Calculate the Thermal Stress |
|
Rebar |
3 |
Single side middle arrangement |
Coefficient of Linear Expansion, Control Group |
Figure 4. Stress and temperature relationship at different positions of bridge specimens
Table 2. Calculation results of thermal stress at beam midspan for different element sizes and different layer numbers
|
Layer Number |
2 |
10 |
20 |
40 |
50 |
Reference Solution |
|
Grid Size |
||||||
|
1 |
2.62315 |
2.12486 |
- |
- |
- |
2.12458 |
|
0.5 |
2.56238 |
2.13598 |
2.12368 |
- |
- |
|
|
0.25 |
2.63214 |
2.13584 |
2.13252 |
2.13698 |
- |
|
|
0.1 |
2.56985 |
2.13574 |
2.12582 |
2.13452 |
2.12523 |
Figure 4(b) shows the stress data at the end positions of bridge specimens under various temperature and pressure conditions. As can be seen from the figure, the stress values increase with rising temperature, and this trend is consistent for different pressure levels. At each pressure level, the stress values show an increasing trend with the rising temperature, which is due to the increase in internal stress caused by material thermal expansion. It seems that there is a linear relationship between stress and temperature. For each pressure level, the stress increment with temperature change is approximately the same, suggesting that the impact of temperature on stress is linear, and this implies that the thermal expansion behavior of bridge materials is uniform and can be predicted within this temperature range. Although stress increases with temperature at all pressure levels, higher pressure levels are associated with lower stress values. For instance, at 5°C, the stress values at 10 MPa, 20 MPa, and 30 MPa are respectively 65.65, 42.85, and 32.49, this trend indicates that the increase in stress due to temperature is less obvious at higher pressures, this is because the material exhibits different thermodynamic properties under higher stress conditions.
Table 2 lists the calculation results of thermal stress at the midspan of beams under different mesh sizes and numbers of layering, along with the reference solution. The table indicates that under a same grid size, increasing the number of layers usually brings the calculation results closer to the reference solution, meaning that more layers in the model allows more accurate capture of the thermal stress distribution at the midspan of the beam. However, after a certain number of layers, the impact of adding more layers on the results gradually diminishes, indicating the existence of an "adequate" number of layers, beyond which, there will be no significant improvement in the calculation results. The grid size has a considerable impact on the calculation results. As the grid size reduces (from 1 to 0.1), the calculation results progressively approach the reference solution, implying that refining the grids would improve the accuracy of calculations. Notably, when the number of layers is 50, and the grid size is 0.1, and the calculation result is very close to the reference solution, indicating that grid refinement is very important for obtaining accurate solutions at higher layering numbers. Regardless of increasing layer number or reducing grid size, the convergence of thermal stress calculations will be improved, and this is evident from the calculation results gradually stabilizing and approaching the reference solution.
Figure 5(a) shows the data of the variation of bending moment along the length of bridge specimens under different fire exposure times and with the provision of one support. The curves reveal that under conditions of fire exposure for 120 minutes and 60 minutes, the largest negative values of bending moment occur in the middle region, indicating significant tensile stress or downward bending in this position. Then, as the fire exposure time decreases, the negative bending moment values decrease due to changes in material properties and temperature distribution over time and with varying fire intensity. After adding one support, the bending moment in the middle region shifts from negative to positive values, suggesting that the addition of the support can effectively improve the stress state in this region by providing additional resistance to bending. In case of no fire and with support, the bending moment values at both ends of the specimens show good symmetry, while those of the middle part are close to zero or positive, indicating that the stress distribution is uniform under these conditions.
(a) Increment of bending moment
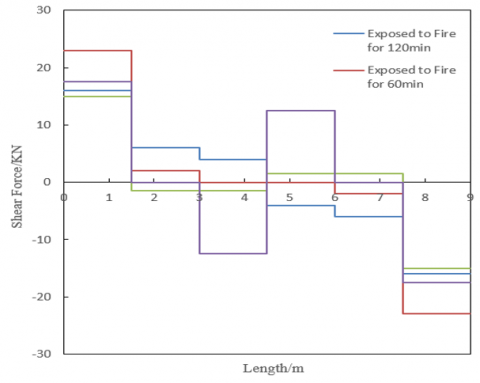
(b) Increment of shear force
(c) Increment of horizontal displacement
Figure 5. Comparison curves of internal forces and deformations in bridge specimens under different fire conditions
Figure 5(b) shows the variation of shear force along the length of bridge specimens under different fire conditions. The graph shows that, normally, the shear force would exhibit a linear change along the length, as it is resulted from the unbalanced force on the cross-section, however, due to the action of fire exposure, material properties would change, especially at high temperatures, so the mechanical properties will degrade, thereby affecting the distribution of shear force. In case of a fire exposure of 120 minutes and 60 minutes, significant negative values of shear force appear at positions of 7.5 meters and 9 meters, indicating changes in material properties in these parts due to fire, and the shear force distribution would become uneven. The case with one support shows that, the support was placed at the position of 4.5 meters, as the shear force value significantly shifts from negative to positive at this point, and then returns to zero at the position of 6 meters, indicating effective alteration in shear force distribution by the applied support.
Figure 5(c) shows the variation of horizontal displacement along the length of bridge specimens under different fire conditions. After 120 minutes of fire exposure, the specimen exhibits maximum positive displacement at positions of 3 meters and 4.5 meters, while the displacements at end positions are negative (inward contraction). This distribution suggests that, the central area of fire exposure experienced material expansion caused by high temperature, while the exposure of ends was less, so the displacements are smaller. As for the cases of fire exposure of 60 minutes and no fire exposure at all, the overall displacements are small, showing slight expansion in the middle and slight contraction at the ends. In case of no fire, the displacement distribution is relatively uniform, and the values are the smallest, reflecting the material's natural contraction at normal temperatures or residual stress from the manufacturing process. In case of with one support, the displacements become more negative at all positions, especially at the position of 4.5 meters, this means that the support had introduced additional compressive forces, resulting in the overall contraction of the specimen.
According to the three graphs in Figure 5, it can be concluded that, fire exposure significantly impacts the fatigue life of bridge specimens. Prolonged fire exposure leads to larger variations in the bending moment in the central area, which will accelerate the accumulation of material fatigue damage in that region, thereby shortening the fatigue life. Fire exposure can also cause changes in the distribution of shear force in bridge specimens, affecting their fatigue life. After long-time fire exposure, there will be significant changes in shear force distribution, indicating material degradation, resulting in shortened fatigue life. Changes in horizontal displacement can reflect the material's behavior under thermal effect, such as thermal expansion and contraction, and this will impact the fatigue life of the material. Long fire exposure will cause uneven degradation of material properties, especially in areas with maximum expansion, and thereby shortening the fatigue life.
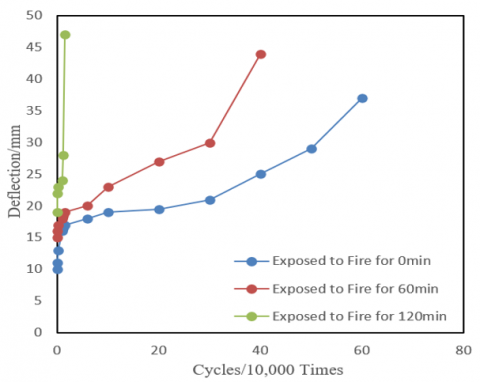
Figure 6 shows the data of the relationship between cycles and midspan deflection of bridge specimens under different fire exposure durations, based on which, the following analysis can be made: with the increase in fire exposure time, the initial midspan deflection increases with it. For example, at 0 cycles, from no fire condition to fire exposure of 120 minutes, the deflection increases obviously. Then, as the number of cycles increases, the midspan deflection continues to increase under all fire conditions, but the increase is most significant in case of 120 minutes of fire exposure, and this suggests that, specimens exposed to fire for longer durations have a greater capacity for deformation under cyclic loading, and this is because the long time high temperature has affected the mechanical properties of the material. As for cases of no fire and 60-minutes fire exposure, with the increase of the number of cycles, the rate of increase in deflection is relatively stable. In the case of 120-minutes fire exposure, the rate of increase in deflection accelerates significantly after 15000 cycles, especially as the cycle number is between 15000 and 60000 cycles, the deflection increases from 47 to over 60, and this is due to the severe damage or degradation of material properties under the influence of cyclic loading and high temperatures.
Figure 6. Relationship between cycles and midspan deflection of bridge specimens
It can be concluded that, under cyclic loading, specimens exposed to fire for 120 minutes show a greater increase in deflection, indicating that the rate of fatigue damage accumulation would increase with longer fire exposure time, resulting in more severe damage. Specimens with no fire exposure and with 60-minutes fire exposure exhibit longer fatigue life, with the increase of cycle number, the increase of deflection in the midspan position is gentle. For specimens exposed to fire for 120 minutes, their fatigue life shortens significantly due to material degradation.
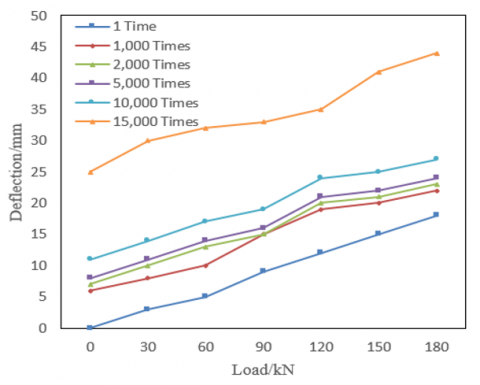
Figure 7. Load-deflection relationship at the midspan of bridge specimens after different numbers of cycles
Figure 7 shows the load-deflection relationship at the midspan of bridge specimens under different loads and cycle numbers. The graph indicates that, after each cycle of loading, deflection increases with the increase of load, this trend is expected, because as the structure undergoes bending under the load, its deflection increases with the load. As the number of cycles increases, the deflection under a same load gradually increases, this suggests that the material has experienced fatigue or other types of damage, leading to an increased capacity for deformation under the same load. After the initial 1,000 cycles, the increase in deflection is relatively small, but after 15,000 cycles, the increase in deflection becomes significant, especially under higher loads, and this indicates that the material has entered a later stage of its fatigue life. It can be concluded that, with the increase in cycle numbers, the deflection under the same load increases, indicating that the specimen has undergone cumulative fatigue damage, and the accumulation of damage has reduced the specimen's stiffness, making it more prone to bending. After 10,000 cycles, deflection accelerates, particularly after 15,000 cycles, suggesting that the specimen is approaching or has reached its fatigue life limit. In engineering practice, maintenance or replacement of the specimen should be considered at this time.
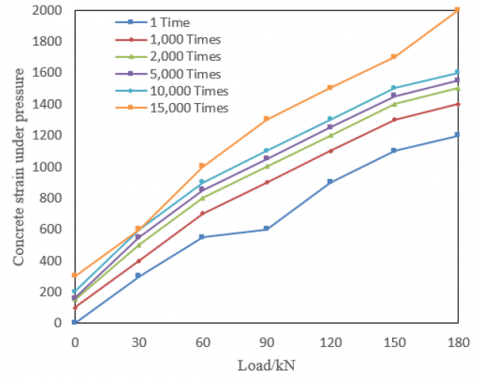
Figure 8. Load-strain relationship for compressed concrete in bridge specimens after different numbers of cycles
Figure 8 presents the load-strain relationship data for compressed concrete in bridge specimens at various load levels and after different numbers of cycles. The graph shows that, at each cycle number, the strain increases with increasing load, and this behavior aligns with the mechanical behavior of materials, this is because the concrete experiences increased strain under compressive loads. As the number of cycles increases, the strain values at a same load level gradually increase as well, this indicates the presence of microcracks or other forms of damage in the concrete, leading to a reduction in material stiffness and a greater strain under the same load. From 1 to 15,000 cycles, the strain shows a gradually increasing trend, which is even more obvious at higher load levels. These data reflect the fatigue characteristics of concrete under repeated loading. With the increase of cycle number, the reduction in material stiffness leads to higher strain values, and this is a manifestation of the accumulation of fatigue damage. The significant increase in strain, particularly at higher load levels, suggests that the material is approaching or has reached its fatigue life limit, which should be taken into consideration during the design and lifespan assessment of structures.
Figure 9 depicts the load-strain relationship of tensioned steel rebar in bridge specimens at various load levels and after different numbers of cycles. The graph shows a positive correlation between load and strain, which is as expected, the strain increases with increasing load, reflecting the deformation characteristics of the material under stress. Under a given load, the strain value shows an increasing trend with the number of cycles, indicating that the material has undergone fatigue damage due to repeated loading, leading to increased strain under the same load. In particular, at high load levels, strain increase is quite obvious when the number of cycles increases from 1 to 15,000, and this suggests that, under higher load levels, steel rebars are more sensitive to fatigue damage. It can be concluded that, the increasing trend of strain means an accumulation of fatigue damage in steel rebar under cyclic loading. The significant strain increase at high cycle numbers is due to the development of micro-cracks or the decline in material stiffness. The obvious strain increase, especially after 10,000 and 15,000 cycles, indicates that rebars have approached or exceeded its fatigue life limit, and this implies that rebars can no longer bear the load as expectation, and they must be repaired or replaced.
Figure 9. Load-strain relationship curves for tensioned steel rebar in bridge specimens after different numbers of cycles
Focus of this study is the analysis of thermal stress and the assessment of fatigue life of bridge structures under multi-field coupling. Through experiments and theoretical analysis, the study systematically investigated the behavior of bridge materials and structures under various environmental and load conditions. The paper considered the impact of coupled physical fields such as temperature and load on bridge structural performance, researched the calculation methods for the coefficient of linear expansion, the elastic modulus, and the Poisson's ratio of different materials under homogeneous conditions, and discussed the impact of temperature changes on thermal stress in bridge structures. Models for fatigue damage in bridges based on stiffness degradation and based on load-bearing capacity degradation were developed, and the residual load-bearing capacity was calculated.
Experimental results demonstrated that material properties such as the coefficient of linear expansion, elastic modulus, and Poisson's ratio would vary under the influence of multi-field coupling, and these variations are crucial for thermal stress analysis. Under different fire exposure times and cyclic load conditions, the thermal stress and load-bearing capacity of bridge specimens show significant changes, affecting the structure's fatigue life. Analysis of midspan load-deflection and load-strain relationships indicates that, fatigue damage can accumulate under cyclic loading, leading to the degradation of structural performance.
The conclusion can be drawn that, under the influence of multi-field coupling, bridge structural performance shows signs of degradation, primarily showing as increased thermal stress, decreased stiffness, and reduced load-bearing capacity. The fatigue life of bridge specimens can be reduced due to environmental temperature and cyclic loading, particularly under conditions of high temperature and high cyclic loads, the accumulation of fatigue damage will accelerate, significantly shortening lifespan. Given these impacts, maintenance and reinforcement of bridges become particularly important. Regular structural assessment, timely maintenance, and necessary reinforcement measures can help extend the service life of bridges, and ensure their safe operation. Future research could further explore other influencing factors under multi-field coupling, such as corrosion and humidity changes, more advanced prediction models can be developed, and maintenance strategies can be improved.
[1] Niu, Q., Guo, X. (2023). Application of a thermodynamic model in durability analysis of bridge structures under climatic variability. International Journal of Heat & Technology, 41(4): 901-909.
[2] Lin, P., Ma, J. (2023). Durability analysis and life prediction of concrete box girder bridge in service based on CA. Tumu Gongcheng Xuebao/China Civil Engineering Journal, 56(8): 75-84.
[3] Huang, H.Y., Zhang, J.P., Lü, J.H. (2022). Reliability evaluation of an urban bridge based on durability theory and load limit policy. Gongcheng Lixue/Engineering Mechanics, 39: 58-63.
[4] Li, Z.N., Zhu, H.B., Zhao, Y., Luo, X., Xu, R.Q. (2021). Thermal stress analysis and crack control of assembled bridge pier. Zhejiang Daxue Xuebao (Gongxue Ban)/Journal of Zhejiang University (Engineering Science), 55(1): 46-54.
[5] Wang, D., Deng, Y., Liu, Y. M., Liu, Y. (2018). Numerical investigation of temperature gradient-induced thermal stress for steel–concrete composite bridge deck in suspension bridges. Journal of Central South University, 25(1): 185-195. https://doi.org/10.1007/s11771-018-3728-5
[6] Huang, W., Guo, W., Wei, Y. (2019). Thermal effect on rheological properties of epoxy asphalt mixture and stress prediction for bridge deck paving. Journal of Materials in Civil Engineering, 31(10): 04019222. https://doi.org/10.1061/(ASCE)MT.1943-5533.0002861
[7] Zhao, F., Liao, Q. (2021). Fatigue evaluation of hot spot stress in fatigue vulnerable area of bridge deck structure based on thermal energy modelling. Thermal Science, 25(4 Part B): 3093-3101. https://doi.org/10.2298/TSCI2104093Z
[8] Zerin, A. I., Hosoda, A., Komatsu, S., Ishii, H. (2020). Full scale thermal stress simulation of multiple span steel box girder bridge evaluating early age transverse cracking risk of durable RC deck slab. Journal of Advanced Concrete Technology, 18(7): 420-436. https://doi.org/10.3151/jact.18.420
[9] Zhang, Q., Ma, Y., Wang, B. (2020). Analysis of temperature field and thermal stress characteristics for a novel composite bridge tower catering for plateau environment. Bridge Constr, 50: 30-36.
[10] Wang, G., Xing, Y., Ding, J. (2017). Test study on fracture performance and fatigue lifespan of fiber concrete for bridge deck in cold regions. In Proceedings of the 6th International Specialty Conference on Fibre Reinforced Materials, pp. 323-328.
[11] Abdelmaksoud, A.M., Patel, M.K., Becker, T.C., Balomenos, G.P. (2022). Simplified framework for preliminary estimates of bridge bearing demands and fatigue loading. In Canadian Society of Civil Engineering Annual Conference, 2: 1105-1121. https://doi.org/10.1007/978-3-031-34159-5
[12] Chen, S., Yang, Y., Shen, Z., Javanmardi, A. (2022). Reconstruction of Min-Zhe wooden arch bridges and its legitimation as tangible and intangible heritage. International Journal of Architectural Heritage, 16(12): 1779-1796. https://doi.org/10.1080/15583058.2021.1908444
[13] Yu, X., Iannuzzo, F., Zhou, D. (2023). Thermal stress emulation of power devices subject to DFIG wind power converter. In 2023 IEEE 14th International Symposium on Power Electronics for Distributed Generation Systems (PEDG), Shanghai, China, pp. 141-147. https://doi.org/10.1109/PEDG56097.2023.10215162
[14] Eriksson, A., Ullrich, A., Wang, C., Gonzalez-Libreros, J., Johansson, J., Enoksson, O., Quist, J., Sas, G. (2023). Numerical and analytical evaluation of load distribution patterns on ballasted concrete railway bridges. In International Symposium of the International Federation for Structural Concrete, 350: 109-118. https://doi.org/10.1007/978-3-031-32511-3_12
[15] Aghaeidoost, V., Billah, A.H.M.M. (2023). Multi-hazard resilience assessment of base-isolated bridges. In Structures Congress 2023, pp. 95-105.
[16] Liu, X., Han, W., Guo, X., Yuan, Y., Chen, S. (2022). Fatigue lifespan assessment of stay cables by a refined joint probability density model of wind speed and direction. Engineering Structures, 252: 113608. https://doi.org/10.1016/j.engstruct.2021.11360
[17] Yoon, Y.H., Ataya, S., Mahan, M., Malek, A., Abrahamson, N., Zokaie, T., Asce, M., Ong, R., Ahmed, A. (2022). Total risk model and loss analysis of probabilistic damage control application in seismic design of highway bridges. Journal of Bridge Engineering, 27(5): 04022020. https://doi.org/10.1061/(ASCE)BE.1943-5592.0001843
[18] Alpízar, M., Castillo, R., Chinè, B. (2020). Thermal stress analysis by finite elements of a metal-ceramic dental bridge during the cooling phase of a glaze treatment. Journal of the Mechanical Behavior of Biomedical Materials, 104: 103661. https://doi.org/10.1016/j.jmbbm.2020.103661
[19] Sun, J., Xie, J., Zhang, Z. (2020). Simulation analysis of thermal stress of CFST arch bridge during exothermic hydration process. In Computational and Experimental Simulations in Engineering: Proceedings of ICCES2019 24, Tokyo, Japan, pp. 1015-1021. https://doi.org/10.1007/978-3-030-27053-7
[20] Zhang, Q., Ma, Y., Wang, B. (2020). Analysis of temperature field and thermal stress characteristics for a novel composite bridge tower catering for plateau environment. Bridge Construction, 50(5): 30-36.
[21] Feng, B., Wang, X., Wu, Z. (2019). Fatigue life assessment of FRP cable for long-span cable-stayed bridge. Composite Structures, 210: 159-166. https://doi.org/10.1016/j.compstruct.2018.11.039
[22] Chanda, M., Misra, K.C., Bhattacharjya, S. (2020). Fatigue life assessment of an existing railway bridge in India incorporating uncertainty. In Recent Advances in Theoretical, Applied, Computational and Experimental Mechanics: Proceedings of ICTACEM 2017, 145-154. https://doi.org/10.1007/978-981-15-1189-9
[23] Iordachescu, M., Valiente, A., De Abreu, M. (2019). Fatigue life assessment of a tack welded high-strength wire mesh for reinforcement of precast concrete bridge girders. Construction and Building Materials, 197: 421-427. https://doi.org/10.1016/j.conbuildmat.2018.11.176
[24] Song, Y.S., Ding, Y.L., Zhong, W., Zhao, H. (2018). Reliable fatigue-life assessment of short steel hanger in a rigid tied arch bridge integrating multiple factors. Journal of Performance of Constructed Facilities, 32(4): 04018038. https://doi.org/10.1061/(ASCE)CF.1943-5509.0001183