Mohammad Hassan Shojaeefard![]() | Hassan A. Hameed Al-Hamzawi
| Hassan A. Hameed Al-Hamzawi![]() | Mohammad Mazidi Sharfabadi*
| Mohammad Mazidi Sharfabadi*![]()
© 2023 IIETA. This article is published by IIETA and is licensed under the CC BY 4.0 license (http://creativecommons.org/licenses/by/4.0/).
OPEN ACCESS
This study delves into the performance assessment of Photovoltaic Thermal (PV/T) systems under the specific climate conditions prevalent in Tehran, Iran, utilizing a methodical approach that encompasses both experimental and numerical analyses. Central to this investigation is the application of energy and exergy analyses, which are instrumental in elucidating the intricacies of renewable energy integration. This is imperative for advancing towards a sustainable and clean energy paradigm. The focus of this research lies in the theoretical examination of the PV/T system, scrutinizing the influence of pivotal factors such as global radiation, cooling fluid flow rate, ambient temperature, wind speed, and fluid inlet temperature. A bespoke code was developed to meticulously evaluate the system's performance, paying special attention to four distinct fluid inlet temperatures: 25, 37.3, 49.45, and 62℃. Findings from this study reveal a notable trend: an increase in the reduced temperature difference correlates with a decline in thermal efficiency. Optimal thermal efficiency, recorded at 23.3%, was achieved under solar radiation intensity of 996 W/m². The research further highlights the significant role of ambient temperature in influencing heat loss rates from PV/T systems, underscoring the necessity for effective insulation and thermal management strategies. Conversely, it was observed that higher wind speeds contribute to diminished energy efficiency while simultaneously enhancing electrical exergy efficiency. This comprehensive analysis not only augments the existing body of knowledge in the field but also serves as a vital reference for future advancements in the integration of renewable energy systems.
photovoltaic thermal PV/T system, experimental setup, thermal and electrical performance, energy, exergy
Global warming, predominantly attributed to the utilization of fossil fuels, presents a significant risk to the future. It is widely acknowledged that the transition to renewable energy sources is the most viable solution to this challenge. Solar energy, with its abundant and clean properties, has emerged as a crucial energy source worldwide, offering a sustainable alternative to the fossil fuel-dominated energy supply system, which has adversely impacted the environment and sustainability.
In scenarios of energy crises, solar energy, along with other renewable sources, is increasingly recognized as a viable and readily available solution for long-term energy security. Solar energy, in comparison to other renewable sources, excels in terms of accessibility, capacity, affordability, and efficiency. Consequently, the solar energy sector is poised to play a pivotal role in meeting future energy demands [1]. A notable innovation in this sector is the integration of thermal collectors with photovoltaic (PV) modules to form PV/T systems. These systems enable the concurrent collection of thermal and electrical energy from solar radiation using a single module. PV/T systems are commonly designed as either flat plate or concentrated collectors, depending on the fluid flow configuration [2]. The two primary working fluids in these systems are air and water. Water-based PV/T collectors are deemed more efficient due to water's higher heat capacity compared to air [2]. Moreover, the cooling effect of water can enhance the electrical efficiency of PV cells. Since the 1970s, PV/T technologies, including design modifications, working fluid configurations, and other factors influencing performance, have been extensively studied [3]. A notable challenge in PV/T system design is achieving optimal electrical and thermal efficiencies, as these efficiencies are inversely related to cell temperature, which is significantly influenced by ambient temperature, wind velocity, and the working fluid's mass flow rate and inlet temperature. These factors are critical in optimizing the overall performance of a PV/T module [4].
To ascertain the efficacy of PV/T systems, their physical characteristics are meticulously analyzed in both theoretical and experimental domains. Studies have investigated diverse water flow rates, ranging from 0.011 kg/s to 0.041 kg/s, corresponding to each level of solar radiation (500-800 W/m2). This variation in flow rates is instrumental in enhancing the heat transfer coefficient for water-based PV/T systems [3]. According to research examining PV/T systems under a spectrum of operational conditions and variable components, the overall efficiency of these systems fluctuates between 47.4% and 80% [3]. A detailed study by Brahim and Jemni [5] reported the average electrical, thermal, and total efficiencies of a PV/T module as approximately 12.52%, 43.75%, and 56.27%, respectively, particularly at lower inlet temperatures. The performance of PV/T systems is subject to geographical and temporal variations across different locales, influenced by fluctuating weather conditions where factors like irradiance and ambient temperature are beyond control. The pivotal elements affecting the thermal and electrical efficiency of PV/T systems are thoroughly explored using a mathematical model, which includes the analysis of the inner heat pipe [5]. In the realm of energy systems, energy represents the capacity to do work or produce heat within a system. Contrastingly, exergy signifies the quality or potential of energy in a system, defined as the maximal work achievable when the system attains equilibrium with its surroundings. Exergy analysis has become a fundamental tool in assessing the efficiency and sustainability of energy conversion processes. It elucidates the potential for useful work and identifies the losses or irreversibilities within a system. This analytical approach has been applied by several researchers in evaluating the energy and exergy efficiency of PV/T systems [6, 7]. An insightful study [8] delves into the analysis of experimental data from a water-based PV/T system, acquired through indoor experiments, utilizing MATLAB code for comprehensive analysis. Correspondingly, another research utilizing MATLAB modeling and simulation elucidated that the efficiency of photovoltaic panels diminishes as cell temperature escalates due to increased solar radiation, highlighting the intricate relationship between solar exposure and photovoltaic efficiency. Furthermore, the efficiency of a PV/T water collector has been rigorously evaluated through both experimental and numerical approaches [9]. This research juxtaposes the performance of the PV/T system with findings derived from both experimental data and numerical analyses, conducted through energy and exergy analysis of the system. In parallel, Gül and Akyüz [10] embarked on a study focusing on the electrical and thermal performance of a liquid flat-plate PV/T system, culminating in the model's validation against experimental results. Simulation outcomes indicated that thermal efficiency was adversely affected by elevated fluid inlet and ambient temperatures, achieving its zenith at a solar radiation intensity of 800 W/m².
This paper presents an in-depth analysis aimed at evaluating the performance of a PV/T household hot water system, utilizing both energy and exergy analysis under the climatic conditions of Tehran. The primary objective of this investigation is to pinpoint potential areas for enhancing the efficiency of the PV/T system. Through meticulous energy and exergy analysis, areas prone to inefficiency or energy loss within the PV/T system are identified. Such insights are pivotal for refining the design, operational tactics, and control strategies of the system, thereby augmenting overall performance and maximizing energy yield. A critical aspect of this study is its emphasis on the potential of specialized thermal absorber manufacturers to integrate their products into singular PV devices, transforming them into more efficient PV/T systems, particularly in terms of maximizing efficiency over a given roof area.
The research introduces an innovative experimental setup and employs a novel methodology integrating both energy and exergy analysis for a comprehensive evaluation of the PV/T system's efficacy. Furthermore, by juxtaposing numerical results with experimental data, the study validates the accuracy and reliability of the numerical model employed. This validation process significantly enhances the credibility of the numerical model, ensuring that the findings are both reliable and applicable to real-world scenarios.
In this study, a thermal performance test of a PV/T system is conducted using an outdoor test bench. The temperatures of the coolant fluid at the inlet and outlet, along with its mass flow rate, are measured. Additionally, measurements of the ambient temperature, solar radiation, and wind speed are taken. The PV/T system being investigated is depicted in Figure 1.
The characteristics of the PV/T system are given in Table 1.
The experiments were carried out in Tehran, Iran (35˚ 41ˈ N and 51˚ 25ˈ E). These experiments took place on October 17, 2021, from 10:50 AM to 01:25 PM. Figure 2 displays a photo of the solar test bench used in the experiments. Additionally, Figure 3 provides a schematic view of the hydraulic circuit of the test bench.
Figure 1. The PV/T system under study [11]
Table 1. The characteristics of the PV/T system [11]
|
Electrical Characteristics |
Value |
|
Solar cells |
60 polycristalline-156×156 mm |
|
Pmpp (W) |
250 |
|
Umpp (V) |
30.03 |
|
Impp (A) |
8.33 |
|
Uoc (V) |
37.68 |
|
Isc (A) |
8.81 |
|
Temperature Range |
Pmpp = -0.37%/K |
|
Uoc = -90.7 mV/K |
|
|
Isc = +2.85 mA/K |
|
|
Thermal Characteristics |
Value |
|
Gross surface (m2) |
1.63 |
|
Net surface (m2) |
1.48 |
|
Liquid content (l) |
1.15 |
|
Absorber |
Aluminum plate |
|
Collector pipes (mm) |
22×0.8 |
|
Internal pipes (mm) |
8×0.5 |
|
Max operating temperature (℃) |
80 |
|
Working pressure (bar) |
4 |
|
Technical Data |
Value |
|
Dimensions |
1666×992×40 (±2 mm) |
|
Weight (kg) |
22 |
|
Solar glass thickness |
3.2 mm |
The PV/T system testing and evaluation of its performance are conducted using the BS EN 12975 standard [12, 13]. BS EN 12975 is a method for testing the performance of solar thermal systems, specifically for the determination of the thermal performance of glazed and unglazed PV/T collectors. The standard outlines the procedures and requirements for testing and evaluating the thermal efficiency, and electrical performance of PV/T systems. The testing method described in BS EN 12975 involves subjecting the PV/T system to different operating conditions and measuring various parameters to assess its performance. These parameters include the solar radiation intensity, ambient temperature, inlet and outlet water temperatures, electrical power output, and heat transfer fluid flow rate. The method involves calculating the difference between the mean temperature of the fluid and the ambient temperature under steady-state conditions. Eq. (1) employs a second-order curve to determine the thermal efficiency [13]:
$\eta_{t h}=\eta_o-a_1 T_m^*-a_2 I T_m^{* 2}$ (1)
where, $a_1$ and $a_2$ are constants, and
$T_m^*=\frac{T_m-T_a}{I}$ (2)
$T_m=T_{f i}+\frac{\Delta T_f}{2}$ (3)
Figure 2. The photo of the test bench
Figure 3. The schematic view for the hydraulic circuit of the test bench
The energy and exergy analyses are conducted to determine how the PV/T system works.
3.1 Energy analysis
The following assumptions are made to model the PV/T system:
The energy balance equations for each component of the PV/T system are as follows [14]:
For solar cells of PV module:
$\begin{gathered}\alpha_c \tau_c \beta_c I W d x=\left[U_{t c, a}\left(T_c-T_a\right)+h_{c, p}\left(T_c-\right.\right. \left.\left.T_p\right)\right] W d x+\eta_c \tau_c \beta_c I W d x\end{gathered}$ (4)
For blackened absorber plate temperature under the PV module:
$\alpha_p \tau_g^2\left(1-\beta_c\right) I+h_{c, p}\left(T_c-T_p\right)=h_{p, f}\left(T_p-T_f\right)$ (5)
The energy balance of flowing water through the absorber pipe under the PV module is given by:
$\grave{m}_f C_f \frac{d T_f}{d x} d x=F^{\prime} h_{p, f}\left(T_p-T_f\right) W d x$ (6)
where,
$F^{\prime}=\left(\frac{W \times U_L}{\pi D h}+\frac{W}{D+(W-D) F}\right)^{-1}$ (7)
$F=\frac{\tanh [m(W-D) / 2]}{m(W-D) / 2}$ (8)
$m=\left(\frac{U_L}{k \delta}\right)^{\frac{1}{2}}$ (9)
The initial conditions are given as follows:
$\begin{aligned}\left.T_f\right|_{x=0} & =T_{f i} \\ \left.T_f\right|_{x=L} & =T_{f o}\end{aligned}$
The solution of Eq. (7) can be found with the help of Eq. (6) and Eq. (5):
$\begin{gathered}T_{f o}=\left[\frac{P F_2(\alpha \tau)_{e f f} I}{U_L}+T_a\right]\left[1-\exp \left(-\frac{F^{\prime} \mathrm{A} U_L}{\grave{m}_f C_f}\right)\right]+ T_{f i} \exp \left(-\frac{F^{\prime} \mathrm{A} U_L}{\grave{m}_f C_f}\right)\end{gathered}$ (10)
The rate of thermal energy available at the end of a PV module absorber is evaluated as:
$\dot{Q}_u=\grave{m}_f C_f\left(T_{f o}-T_{f i}\right)$ (11)
After substituting the expression for $T_{f o}$ from Eq. (11), we get:
$\dot{Q}_u=\mathrm{A} F_R\left(P F_2\right)(\alpha \tau)_{e f f} I-U_L\left(T_{f i}-T_a\right)$ (12)
where, the flow rate factor, $F_R$ is given by:
$F_{R m}=\frac{\grave{m}_f C_f}{A U_L F^{\prime}}\left[1-\exp \left(-\frac{\mathrm{A} U_L F^{\prime}}{\grave{m}_f C_f}\right)\right]$ (13)
An instantaneous thermal efficiency of the system can be obtained as:
$\eta_{t h}=\frac{\dot{Q}_u}{\mathrm{~A} I}$ (14)
The absorber is fully covered by a photovoltaic module. In this case, an instantaneous thermal efficiency can be obtained by using Eq. (13), and Eq. (14):
$\eta_{t h}=F_R\left(P F_2(\alpha \tau)_{e f f}-\frac{U_L\left(T_{f i}-T_a\right)}{I}\right)$ (15)
In modelling equations, we use the following relations for defining the design parameters:
$(\alpha \tau)_{e f f}=P F_1(\alpha \tau)_{1, \text { eff }}+(\alpha \tau)_{2, \text { eff }}$ (16)
where,
$(\alpha \tau)_{1, \text { eff }}=\left(\alpha_c-\eta_c\right) \tau_c \beta_c$ (17)
$(\alpha \tau)_{2, \text { eff }}=\alpha_p\left(1-\beta_c\right) \tau_g^2$ (18)
The penalty factors due to the glass cover of the PV module, $P F_1$ and absorber below $\mathrm{PV}$ module $P F_2$ are defined as:
$P F_1=\frac{h_{c, p}}{U_{t c, a}+h_{c, p}}$ (19)
$P F_2=\frac{h_{p, f}}{U_{L 1}+h_{p, f}}$ (20)
Also, the heat transfer coefficients are as:
$U_{t c, a}=5.7+3.8 v_w$ (21)
$U_{L 1}=\frac{U_{t c, a} \cdot h_{c, p}}{U_{t c, a}+h_{c, p}}$ (22)
$U_L=\frac{U_{L 1} \cdot h_{p, f}}{U_{L 1}+h_{p, f}}$ (23)
$h_{c, p}=5.7+3.8 v_w \quad v_w=0 \frac{\mathrm{m}}{\mathrm{s}}$ (24)
The electrical efficiency according to the data published by the manufacturer can be calculated as [11]:
$\eta_{e l}=0.1507-0.00045\left(T_c-25\right)$ (25)
3.2 Exergy analysis
Exergy analysis takes into account exergy intake, exergy outflow, and exergy destroyed from the PV/T system, defined as follows [15]:
$\sum E x_i-\sum E x_o=\sum E x_d$ (26)
or it can be written as:
$\sum E x_i-\sum\left(E x_{\text {th }}+E x_{e l}\right)=\sum E x_d$ (27)
where,
$E x_i=\mathrm{A} I\left[1-\frac{4}{3}\left(\frac{T_a}{T_S}+\frac{1}{3}\left(\frac{T_a}{T_S}\right)^4\right)\right]$ (28)
$E x_{t h}=\dot{Q}_u\left(1-\frac{T_a}{T_{f o}}\right)$ (29)
$E x_{e l}=\eta_{e l} \mathrm{AI}$ (30)
The computed PV/T exergy is given as:
$E x_o=E x_{t h}+E x_{e l}$ (31)
Finally, the exergy efficiency is calculated as:
$\eta_{e x}=\frac{E x_o}{E x_i}=1-\frac{E x_d}{E x_i}$ (32)
In this section, the energy and exergy efficiency of a PV/T system is evaluated based on global radiation, cooling fluid flow rate, ambient temperature, wind speed and fluid inlet temperature.
4.1 Experimental results
The incident solar radiation, wind speed, and ambient temperature are illustrated in Figure 4.
Figure 4. Solar irradiation, wind speed, and ambient temperature
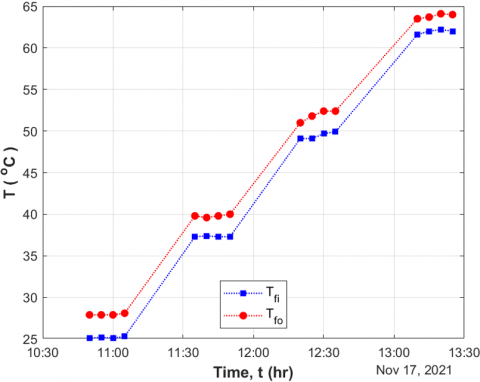
Figure 5. Inlet and outlet temperatures of the PV/T system
Figure 6. Thermal image of the PV/T system
Furthermore, Figure 5 illustrates the temperature entering and leaving the system. In the initial stage of the test, the inlet temperature is recorded as 25.1℃, while the corresponding outlet temperature is 27.9℃. In the final stage of the test, the inlet and exit temperatures are measured as 62℃ and 64℃, respectively.
A thermal image of the PV/T system surface is shown in Figure 6. The average and maximum temperatures of the glass surface are 44 and 53.8℃, respectively.
4.2 Numerical results
In this study, a numerical analysis is conducted to examine the impact of various parameters on the performance of the PV/T system. Theoretical analysis is performed on a PV/T system that is similar to the one used in the experiments. The aim is to gain insights into how different factors affect the overall performance of the system.
4.2.1 Global radiation
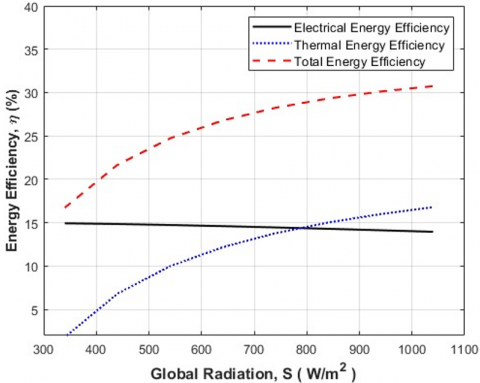
Indeed, the intensity of solar radiation plays a crucial role in the performance of PV/T systems. It not only meets the energy requirements of the system but also has significant effects, such as raising the temperature of the solar cell and absorber plate. As the temperature increases, the thermal efficiency of the system improves, while the electrical efficiency decreases. Moreover, an increase in solar radiation intensity consistently leads to higher input energy to the PV/T system, resulting in increased output power, energy outputs, and system losses.
The impact of increased input radiation on energy efficiency, exergy efficiency, solar cell temperatures, absorber plate temperatures, and outlet fluid temperatures can be observed in Figures 7 to 9, respectively. These figures demonstrate the changes in these parameters as the solar radiation intensity increases, providing valuable insights into the performance of the PV/T system under different radiation conditions.
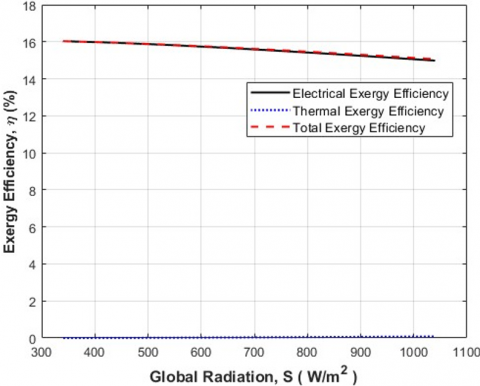
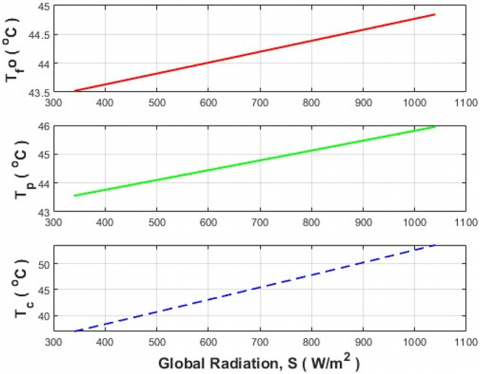
According to the studies conducted on the impact of changes in solar radiation intensity on the performance of photovoltaic-thermal systems, it has been observed that as the radiation intensity increases from 150 to 1050 W/m2, the electrical energy efficiency, thermal efficiency, and overall efficiency decreases by 3%, increases by 1%, and decreases by 2% respectively. Similarly, the exergy efficiency shows a decrease of 2.5%, an increase of 0.3%, and a decrease of 2% with changes in these parameters. The reason for these efficiency changes can be attributed to the effect of radiation on the temperature of the solar panel. There exists a roughly linear relationship between the intensity of solar radiation and the temperature of the cell, plate and outlet fluid.
Figure 7. The energy efficiency variation with changes in radiation intensity
Figure 8. The exergy efficiency variation with changes in radiation intensity
Figure 9. Changes in cell temperature, absorber plate temperature and fluid outlet temperature with radiation intensity
The output power of the PV/T system depends on the input energy of the system. As can be seen, even though the efficiency is lower for the higher radiation, both electrical and thermal output power have increased. This process is similarly true for the input and output exergy of the system.
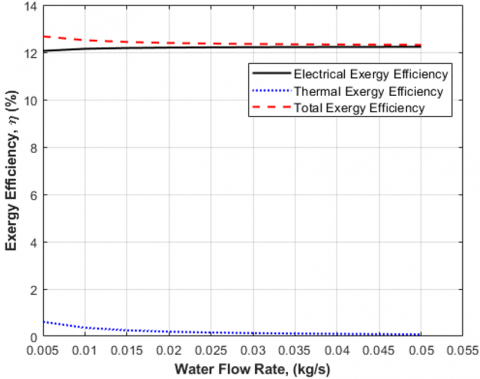
4.2.2 Cooling fluid mass flow rate
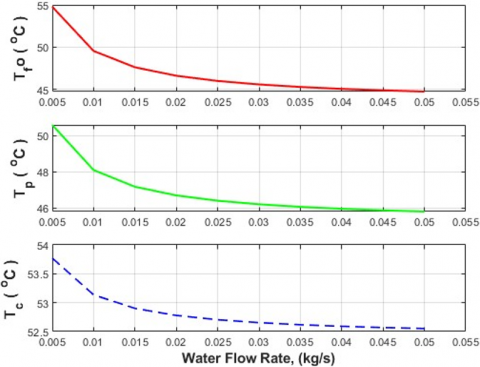
Another parameter that affects PV/T outputs is the fluid mass flow rate, which directly influences the temperatures of the cell and plate, as shown in Figure 10. Increasing the mass flow rate raises the thermal efficiency by enhancing the heat transfer from the absorber plate to the water. Additionally, it is observed that with the increase in mass flow rate, the temperature of the cell decreases to some extent. According to Figure 11, increasing the mass flow rate from 0.005 to 0.05 kg/s results in approximately a 2% increase in both thermal and overall efficiency. However, there is no significant change in electrical efficiency. Additionally, with the increase in mass flow rate, the temperatures of the fluid outlet, plate, and cell decrease. This decrease is more pronounced in the temperatures of the fluid outlet and plate, as shown in Figure 12. The results indicate that increasing the mass flow rate leads to a decrease in the outlet water temperature for all solar radiation values.
Figure 10. The energy efficiency variation with flow rate changes
Figure 11. The exergy efficiency variation with flow rate changes
Figure 12. Changes in cell temperature, absorber plate temperature and fluid outlet temperature with flow rate
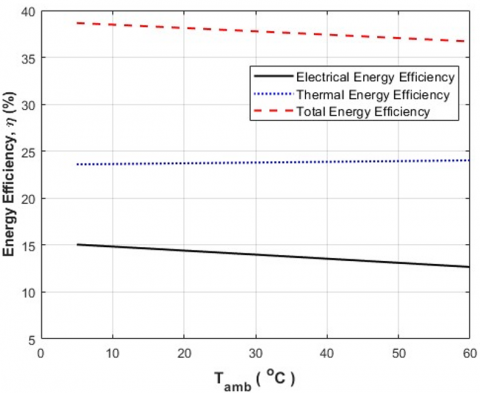
4.2.3 Ambient temperature
The ambient temperature, another environmental parameter, has an inverse effect on the system performance when wind blowing is considered. The effects of this variable on the system performance are illustrated in Figure 13 and Figure 14.
Figure 13. The energy efficiency variation with ambient temperature changes
Figure 14. The exergy efficiency variation with ambient temperature changes
However, it is important to note that changes in the ambient temperature also affect other parameters. Without accounting for other factors influenced by changes in ambient temperature, it is observed that as the ambient temperature increases, the energy efficiency and thermal exergy of the system increase, while the electrical exergy and energy efficiency of the system decrease. Assuming an increase in ambient temperature from 5 to 60℃, the electrical energy efficiency experiences a decrease of approximately 2.5%, the thermal efficiency increases by around 0.5%, and the overall efficiency of the system decreases by about 2%.
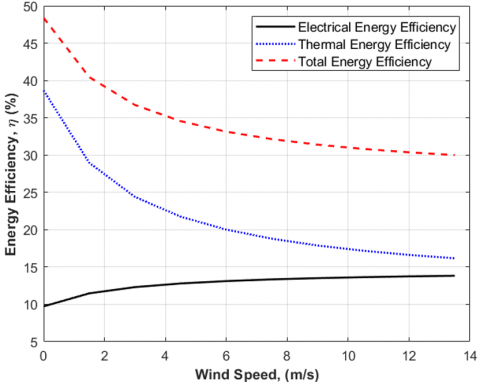
4.2.4 Wind speed
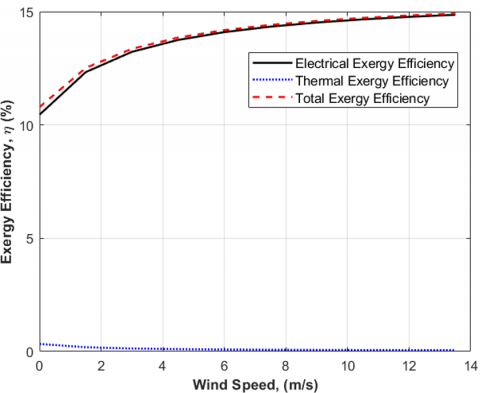
In a PV/T system, an increase in wind speed leads to an increase in the convective heat transfer coefficient. As a result, the cell temperature decreases and approaches the ambient temperature. The impact of this temperature decrease can be observed in the energy efficiency, exergy efficiency, as well as the temperatures of the solar cell, absorber plate, and the fluid exiting the collector, as depicted in Figures 15 to 17, respectively.
The results of this study indicate that as the wind speed increases from 0 to 10 m/s, the electrical efficiency of the PV/T system increases by approximately 2%, while the thermal efficiency decreases by around 20%. Consequently, the overall efficiency of the system decreases by 18%. Additionally, with the increase in wind speed from 0 to 10 m/s, both the electrical and overall exergy efficiency increase by about 2%, whereas the thermal exergy efficiency experiences a decrease of less than 0.5%. Furthermore, as the wind speed increases, the temperature of the cell surface, absorber plate, and water outlet decreases. The magnitude of this temperature decrease is measured at 34℃, 2.5℃, and 1.5℃, respectively. This phenomenon can be attributed to the rise in the convection heat transfer coefficient.
Figure 15. The energy efficiency variation with changes in wind speed
4.2.5 Fluid inlet temperature
In the experiment, the PV/T system performance was tested by varying the solar radiation, ambient temperature, wind speed and fluid inlet temperature. The fluid inlet temperature varied from 25 to 62℃, while the solar radiation ranged from 956 to 1016 W/m2. To obtain more realistic results, the performance of the PV/T system was simulated using four different fluid inlet temperatures: 25, 37.3, 49.45, and 62℃, which correspond to the temperatures recorded in the experiments. The simulation results are presented in Table 2.
On October 17, 2021, experiments were conducted to compute and plot the thermal efficiency against the reduced temperature difference. A constant mass flow rate of 0.033 kg/s (1.95 l/min) was maintained for these experiments. The thermal efficiency changes were determined both experimentally and numerically. The simulation was conducted under identical conditions as the test to determine the thermal efficiency. The results of these calculations are presented in Figure 18.
Figure 16. The exergy efficiency variation with changes in wind speed
Figure 17. Changes in cell temperature, absorber plate temperature and fluid outlet temperature with wind speed
The results indicate that higher fluid inlet and ambient temperatures have a detrimental impact on thermal efficiency. The slope of the curve can provide insights into the collector's effectiveness in capturing and utilizing heat. A steeper slope implies that the collector is losing heat faster as the reduced temperature difference increases. In other words, it suggests that the collector is less efficient at retaining the captured heat energy. This could be due to inadequate insulation, poor sealing, or inefficient heat transfer mechanisms within the collector. While a smaller slope suggests that the collector is better at minimizing heat loss.
The highest thermal efficiency was observed at an irradiance value of 996 W/m2 and a wind speed ranging from 2.5 to 3.4 m/s. The optical efficiency, η0, was determined experimentally to be 23%, while the simulation yielded a value of 25.6%. Overall, there is good agreement between the experimental and numerical results for thermal efficiency.
Table 2. The results of the numerical study
|
Variables |
Tfi=25℃ |
Tfi=37.3℃ |
Tfi=49.45℃ |
Tfi=62℃ |
|
Plate Temperature (℃) |
29.2 |
40.6 |
51.9 |
63.7 |
|
Outlet Fluid Temperature (℃) |
28.2 |
39.7 |
51.3 |
63.3 |
|
Solar Inlet Energy (W) |
1644.4 |
1644.4 |
1644.4 |
1644.4 |
|
Thermal Energy (W) |
404.3 |
326.9 |
249.7 |
169.8 |
|
Electrical Energy (W) |
195.8 |
190.0 |
184.3 |
178.3 |
|
Solar Inlet Exergy (W) |
1531.5 |
1531.5 |
1531.5 |
1531.5 |
|
Thermal Exergy (W) |
4.0 |
2.5 |
1.4 |
0.6 |
|
Electrical Exergy (W) |
195.8 |
190.0 |
184.3 |
178.3 |
|
Electrical Efficiency (%) |
11.9 |
11.6 |
11.2 |
10.8 |
|
Thermal Efficiency (%) |
24.6 |
19.9 |
15.2 |
10.3 |
|
Overall Efficiency (%) |
36.5 |
31.4 |
26.4 |
21.2 |
|
Electric Exergy Efficiency (%) |
12.8 |
12.4 |
12.0 |
11.6 |
|
Thermal Exergy Efficiency (%) |
0.3 |
0.2 |
0.1 |
0.0 |
|
Overall Exergy Efficiency (%) |
13.0 |
12.6 |
12.1 |
11.7 |
Figure 18. Comparison of experimental and numerical thermal efficiency versus reduced temperature difference
This investigation aims to provide valuable insights into the factors that affect the performance of PV/T systems. Key factors include the design of the heat transfer fluid, the configuration of the flow path, the arrangement of the thermal absorbers, and the incorporation of phase change materials (PCMs) behind the panel. The properties of the heat transfer fluid, such as thermal conductivity, heat capacity, and viscosity, play a crucial role in determining the thermal efficiency. Optimizing the design of the heat transfer fluid, for example, by adding nanofluid particles, can significantly enhance the overall system performance. Furthermore, optimizing the configuration of the flow path, including the length, width, and shape of the channels, can improve overall system performance. Efficient arrangement of the thermal absorbers is also vital. Factors such as spacing, orientation, and positioning relative to the PV cells can maximize solar energy absorption. The incorporation of phase change materials behind the panel allows the system to absorb excess heat and store it as latent heat, thus regulating the temperature and improving thermal management.
The PV/T system examined in this study is a renewable energy device that integrates solar photovoltaic (PV) and solar thermal components. This combination enables the simultaneous generation of electricity and thermal energy. The study involved a test conducted in Tehran, Iran on October 17, 2021. The parametric study was conducted using operational data values for four parameters: Global radiation, mass flow rate, ambient temperature, wind speed, and fluid inlet temperature. Energy and exergy analyses were performed to evaluate the system's performance. Validation of the numerical data was conducted to ensure the accuracy and reliability of the simulation. This validation process helped verify the experimental setup and procedures, ensuring the credibility of the results. The findings of the study can be summarized as follows:
The findings of the study have significant implications for the design and optimization of PV/T systems. It is crucial to have effective cooling systems in place to maintain lower cell temperatures and enhance electrical efficiency. The research emphasizes the importance of designing efficient cooling mechanisms to prevent overheating and maximize system performance. Furthermore, monitoring and controlling the fluid inlet temperature can play a key role in optimizing the overall performance of PV/T systems. By continuously monitoring this parameter, appropriate adjustments can be made to ensure optimal energy and exergy efficiency.
Further research recommendations for evaluating PV/T system designs can involve conducting comparative studies to analyze the performance of different configurations. This includes comparing various types of PV cells, such as monocrystalline, polycrystalline, or thin-film cells, to assess their electrical output, efficiency, durability, and compatibility with the thermal absorber. Comparative analysis can also evaluate different thermal absorber materials, such as metals, alloys, or selective coatings, considering factors like thermal conductivity, heat absorption capacity, durability, and cost-effectiveness. Additionally, studying different system designs, including variations in the arrangement and configuration of PV cells, thermal absorbers, and other components, can be done. This includes comparing series and parallel configurations, different spacing and orientation of components, and variations in the flow path design. By conducting these comparative studies, valuable insights can be gained to determine the most efficient and effective setup for PV/T systems.
|
A |
area, m2 |
|
|
C |
specific heat, J.kg-1. K-1 |
|
|
D |
tube diameter, m |
|
|
Ex |
exergy, W |
|
|
F |
standard fin efficiency for straight fins with a rectangular profile |
|
|
F' |
flat plate collector efficiency factor |
|
|
h |
convective heat transfer coefficient, W.m-2.K |
|
|
I |
incident solar radiation, W.m-2 |
|
|
k |
thermal conductivity, W.m-1.K-1 |
|
|
$\dot{m}$ |
mass flow rate, kg.s-1 |
|
|
PF1 |
penalty factor due to the glass cover of the PV/T module |
|
|
PF2 |
penalty factor due to the absorber below the PV/T module |
|
|
Qu |
rate of useful energy transfer, W |
|
|
T |
temperature, K |
|
|
T*m |
reduced temperature difference, m2.K.W-1 |
|
|
UL1 |
an overall heat transfer coefficient from blackened surface to ambient, W.m-2.K-1 |
|
|
Ut |
an overall heat transfer coefficient from the PV/T to ambient through the glass cover, W.m-2.K-1 |
|
|
W |
PV/T width, m |
|
|
v |
velocity, m.s-1 |
|
|
Greek symbols |
||
|
α |
absorptivity |
|
|
$(\alpha \tau)_{\text {eff }}$ |
product of effective absorptivity and transmissivity |
|
|
β |
packing factor |
|
|
δ |
absorber plate thickness, m |
|
|
η |
efficiency |
|
|
$\tau$ |
transmissivity |
|
|
Subscripts |
||
|
a |
ambient |
|
|
c |
cell |
|
|
d |
destruction |
|
|
el |
electrical |
|
|
f |
fluid |
|
|
i |
inlet |
|
|
m |
mean |
|
|
o |
outlet |
|
|
p |
absorber plate |
|
|
s |
Sun |
|
|
th |
thermal |
|
|
w |
wind |
|
[1] Kannan, N., Vakeesan, D. (2016). Solar energy for future world: A review. Renewable and Sustainable Energy Reviews, 62: 1092-1105. https://doi.org/10.1016/j.rser.2016.05.022
[2] Shojaeefard, M.H., Sakran, N.B., Mazidi Sharfabadi, M., Davoudi, N. (2021). A novel review on nano-fluid and phase change material based photovoltaic thermal (PV/T) systems. In IOP Conference Series: Materials Science and Engineering, 1067(1): 012099. https://doi.org/10.1088/1757-899X/1067/1/012099
[3] Chow, T.T. (2010). A review on photovoltaic/thermal hybrid solar technology. Applied Energy, 87(2): 365-379. http://dx.doi.org/10.1016/j.apenergy.2009.06.037
[4] Radziemska, E. (2009). Performance analysis of a photovoltaic-thermal integrated system. International Journal of Photoenergy, 2009: 732093. https://doi.org/10.1155/2009/732093
[5] Brahim, T., Jemni, A. (2021). Parametric study of photovoltaic/thermal wickless heat pipe solar collector. Energy Conversion and Management, 239: 114236. https://doi.org/10.1016/j.enconman.2021.114236
[6] Rajoria, C.S., Agrawal, S., Tiwari, G.N. (2012). Overall thermal energy and exergy analysis of hybrid photovoltaic thermal array. Solar Energy, 86(5): 1531-1538. https://doi.org/10.1016/j.solener.2012.02.014
[7] Li, M., Zhong, D., Ma, T., Kazemian, A., Gu, W. (2020). Photovoltaic thermal module and solar thermal collector connected in series: Energy and exergy analysis. Energy Conversion and Management, 206: 112479. https://doi.org/10.1016/j.enconman.2020.112479
[8] Nasir, F.H., Husaini, Y. (2018). MATLAB simulation of photovoltaic and photovoltaic/thermal systems performance. In IOP Conference Series: Materials Science and Engineering, 341(1): 012019. https://doi.org/10.1088/1757-899X/341/1/012019
[9] Abdullah, A.L., Misha, S., Tamaldin, N., Rosli, M.A.M., Sachit, F.A. (2020). Theoretical study and indoor experimental validation of performance of the new photovoltaic thermal solar collector (PVT) based water system. Case Studies in Thermal Engineering, 18: 100595. https://doi.org/10.1016/j.csite.2020.100595
[10] Gül, M., Akyüz, E. (2021). Energy and exergy analysis of solar photovoltaic thermal system: Experimental and numerical verification. International Journal of Exergy, 34(1): 16-28. https://doi.org/10.1504/IJEX.2021.112033
[11] FDE Solar. http://www.fdesolr.com/en, accessed on Nov. 5, 2023.
[12] Allan, J., Dehouche, Z., Stankovic, S., Mauricette, L. (2015). Performance testing of thermal and photovoltaic thermal solar collectors. Energy Science & Engineering, 3(4): 310-326. https://doi.org/10.1002/ese3.75
[13] EN, B. (2006). 12975-2 Thermal Solar Systems and Components—Solar Collectors—Part 2: Test Methods.
[14] Dubey, S., Tiwari, G.N. (2008). Thermal modeling of a combined system of photovoltaic thermal (PV/T) solar water heater. Solar Energy, 82(7): 602-612. https://doi.org/10.1016/j.solener.2008.02.005
[15] Al-Waeli, A.H., Kazem, H.A., Chaichan, M.T., Sopian, K. (2019). Photovoltaic/Thermal (PV/T) Systems: Principles, Design, and Applications. Springer Nature. https://doi.org/10.1007/978-3-030-27824-3