Hayder H. Khaleel![]()
© 2023 IIETA. This article is published by IIETA and is licensed under the CC BY 4.0 license (http://creativecommons.org/licenses/by/4.0/).
OPEN ACCESS
The laser cutting process is considered one of the most widely cutting processes that used in modern industries such as automotive manufacturing. This paper investigated numerically the influence of the laser cutting process on the three types of steel used widely in the industry which are structural steel, stainless steel and grey cast iron. These steel grades were subjected to three different laser powers (200, 400, 600) watt to obtain the maximum temperature during cutting, overall deformation, the peak stress, maximum shear stress and maximum strain. The simulation process was carried out using SOLIDWORKS 2016 and numerical analysis via ANSYS 2020. The outcomes showed the maximum strain and maximum stress happened in stainless steel due to the contents of the high element in its content which can cause microstructural changes and may cause failure under sudden loads. The results also revealed that the finite element method can predict accurately the stress and temperature distribution for the work piece during laser cutting.
laser cutting process, structural steel, stainless steel, finite element analysis, materials modeling
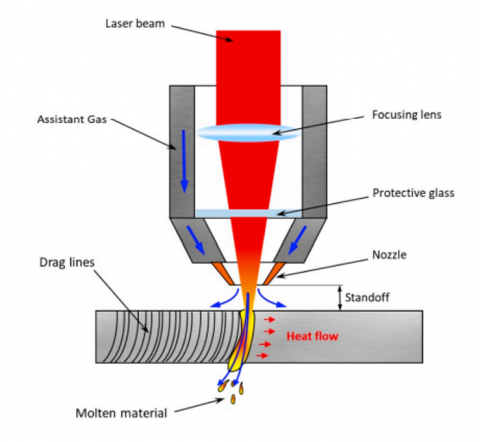
In 1960, the first laser was invented. The gain medium for the laser, an optically pumped ruby crystal, was used. Since that time, technology has continued to advance. In the first laser cutting demonstration took place in 1967. A concentrated CO2 laser and an assist gas jet were utilized for this cutting. Fusion laser cutting is a thermo-mechanical method that employs a laser beam as the heat source. Compared to a traditional cut, it is more exact, precise, time-and money-saving [1]. Conventional cutting methods may not be able to produce a complex and precise cut, so laser cutting is employed to accomplish these objectives [2]. The energy of the laser beam immediately impacts the cutting area, where the material is melted, during the cutting process. The related gas flow blows the remaining molten material out of the gap as it is partially evaporating [3]. The success of the laser-cutting process depends on a variety of variables, including the specimen's material properties, the laser's characteristics, and manufacturing considerations [4]. The laser acts as a heat source when cutting with laser fusion. The material heats up as a result of the heat flow as the laser beam passes over the workpiece at a predetermined feed rate while following a predetermined form. When it gets close to melting point, the solid phase turns into a liquid. The melt is ejected using a gas jet propelled by a laser beam to create the cut kerf. When this energy goes through the focusing lens of the cutting device, absorption causes local heating. The key element causing the shift in focus is a change in temperature. Cutting a thin metal sheet at multiple focal points and measuring the cut widths is a common method for figuring out the cutting focal point [5]. When using a laser for cutting, it is crucial to focus the beam spot on a little region in order to generate heat. Otherwise, the laser's power, the material of the sample, and its thickness will determine how many holes the beam energy creates. When a laser beam interacts with a sample surface due to the transmission of a material photon's kinetic energy, melting some of the material while evaporating the remaining portion [6]. Figure 1 presents the schematic of the laser-cutting operation.
Figure 1. Schematic of laser cutting process [7]
Many researchers studied the laser cutting process numerically and experimentally for different materials. It is becoming more common to do numerical research. It is required to create an adequate numerical model for the numerical analysis [8]. Sifullah et al. [9] developed a thermomechanical finite element model after extensive research to forecast the temporal variation, thermal stress, and the width of the heat-affected zone (HAZ). From a 3 mm thick stainless steel-304 sheet, a 10 mm by 10 mm blank is cut using a CO2 laser. At the cutting edge, the parametric impact on surface quality is investigated using both an optical microscope and a scanning electron microscope (SEM). The results demonstrate that, regardless of laser power, the melting point of the cutting edge is about the maximum temperature, and, more importantly, that cutting speed has a considerable impact on the rate of temperature variation [9]. Grepl et al. [10] discussed the use of laser technology and optimizing the cutting parameters for nickel alloy. The theoretical section of the study explains the concepts and applications of several laser types. The experimental portion focuses on employing a CO2 gas laser to optimize the section parameters of the Haynes 718 alloy. In order to create parts for the aviation sector, this alloy is used. The Wibro Delta laser system, which is intended for large parts, was used for the experiment. The quality of the actual segment and any associated adverse effects that develop along the process are evaluated. In this instance, the factors that had the biggest impact on the final cut were the laser output and cutting speed. The executive summary details the outcomes of a metallographic laboratory [10]. Sifullah et al. [11] ANSYS was utilized to construct a coupled thermo-mechanical finite element model that predicts the temporal variation, thermal stress, and breadth of the (HAZ). To assess how laser speed and power effect (HAZ) and thermal stress, a stainless steel-304 sheet that is 1mm thick is employed as the workpiece. Testing has confirmed that the simulation model's predictions were accurate, and a total of seven combinations of four distinct laser strengths and speeds are used. Optical and scanning electron microscopes (SEMs) are used to analyze the metallurgical changes along the cut surfaces. According to the results of the current study, maximum temperatures are found close to the heat source, and the diameter of the heat-affected zone (HAZ) grows as laser power rises while reducing when cutting speed rises. Cracks and dross are seen along the route [11]. The method of laser cutting a stainless steel plate with a 5 mm thickness was studied and explained. The temperature field in the cutting area was examined using ANSYS to determine how the energy source's form and the beam's penetration affected it [12]. Senthilkumar and. Jayaprakash examined the effects of CO2 laser cutting parameters, including laser power, assist gas pressure, cutting speed, and stand-off distance, on surface roughness, hardness, and kerf dimensions, including kerf width, kerf ratio, and kerf taper [13]. Due to the complexity of the fusion laser cutting process which included interaction between thermal, mechanical and metallurgical effects on the base material, a few papers studied numerically the laser cutting process in detail. It can be observed from the previous studies that there is a gap in numerical simulation for materials subjected to different laser powers. This work offers a comprehensive numerical analysis of the laser cutting operation using finite elements method via ANSYS 2020 software. Three materials which are structural steel, stainless steel and grey cast iron were used under different laser cutting power (200, 400, 600) watt to get the maximum temperature during this process and total deformation occurred in the plate and stress (Von Mises) distribution to investigate the attitude of these materials through the laser cutting process. The numerical analysis included both the static structure model and the transient thermal model. The main objectives of this work are to 1) systematically investigate the effects of laser power on temperature, stress and strain distributions across different materials, and 2) gain insights into the thermo-mechanical behavior of the materials during laser cutting through numerical modeling.
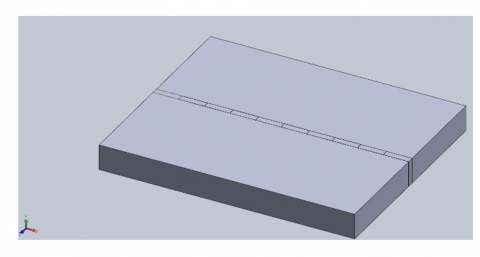
The simulation of the laser cutting process was achieved using SOLIDWORKS 2016 and ANSYS workbench 2020. The selection of this software is because of its properties such as high accuracy in the results and can handle complex shapes easily. First of all, the simulation of the three-dimensional workpiece was carried out with dimensions of (20×16) mm with a thickness of 2 mm as shown in Figure 2. The laser beam was simulated as a heat flow load moving along the workpiece and stress-temperature fields were analyzed.
Figure 2. The simulation of the workpiece using SOLIDWORKS software
Three materials were used in this study that are widely used in modern industry due to significant characteristics. The mechanical characteristics of these materials are listed in Table 1 below.
Table 1. Mechanical characteristics of materials
|
Materials |
Density Kg/m3 |
Young Modulus (Gpa) |
Poisson Ratio |
Ultimate Tensile Strength |
|
Structural Steel |
7850 |
200 |
0.3 |
460 |
|
Stainless Steel |
7750 |
193 |
0.31 |
586 |
|
Grey Cast Iron |
7200 |
110 |
0.28 |
240 |
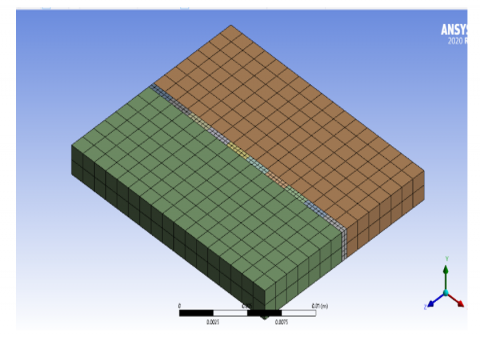
Figure 3. Mesh of workpiece by using ANSYS
The numerical simulation was carried out after the simulation operation using the finite elements software ANSYS 2020. The workpiece was meshed and subjected to three laser powers which were (200, 400, 600) watts which be on specific area of the plate with a pulse duration of 20 ms and pulse frequency of 30 Hz to get the extreme temperature, overall deformation, strain, stress and shear stress as shown in Figure 3. Mesh is used to divide the computational domain into finite elements to facilitate and improve analysis.
Figure 4. Convergence test
Figure 5. Block diagram of the analysis procedure
In order to increase the accuracy of the outcomes for the simulation operation, a convergence test was achieved as shown in Figure 4 and the mesh was fine with the number of elements 35,984 while the node number was 95,621. Different numbers of elements were used to get the maximum temperature until the temperature will be no affected by changing the number of elements and this can improve the accuracy of results with fine mesh.
For the purposes of thermal and mechanical analysis, two separate types of elements are taken into account. SOLID70, an 8-node brick type of thermal element, is used for transient thermal analysis, and SOLID45, a structural element counterpart, is utilized for structural analysis in accordance with previous studies [11].
Figure 5 shows the block diagram of this investigation using numerical analysis to understand the attitude of the materials subjected to various power of the laser beam.
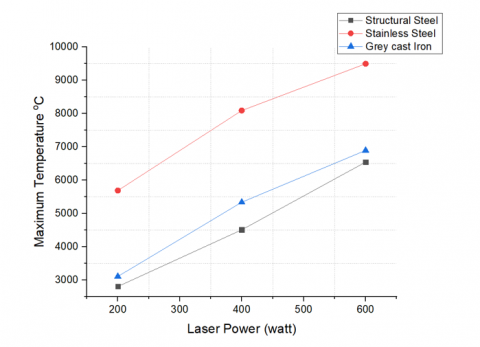
The results for three materials under three various laser power listed in Tables 2, 3 and 4 respectively. Figure 6 presents the comparison of the maximum temperature that occurred during the laser cutting process for three materials for various power of the laser. It could be noticed that the maximum temperature occurred for stainless steel material because of the high alloy elements content in its microstructure which can make metallurgical interaction in the cutting zone.
Figure 6. Maximum temperature for the three materials
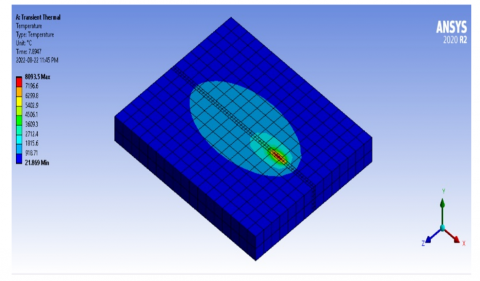
Figure 7. Temperature distribution contour for stainless steel under 400 watts
Figure 7 illustrates the temperature distribution contour for stainless steel during laser cutting with a power of 400 watt. The maximum temperature value can be observed at the center of the laser-focused spot on the workpiece, as can be seen from the aforementioned figures. Due to the laser's maximal intensity being concentrated in the beam's center, the temperature at the laser's center spot approaches the ideal "melting temperature" for the material. This will cause a notable temperature difference between the frontal neighborhood points and the point temperature located in the beam's center. Clearly, a uniform distribution of temperature can be seen in the figures. However, as power increases, the ideal temperature in the laser heating spot rises.
Table 2. The results of numerical analysis under 200-watt of the laser power
|
Material |
Max. Temperature ℃ |
Total Deformation (mm) |
Max. Strain |
Max. Stress (Gpa) |
Max. Shear Stress (Mpa) |
|
Structural steel |
2803 |
0.2534 |
0.015 |
2.9 |
112.86 |
|
Stainless Steel |
5688 |
0.3 |
0.09 |
17.4 |
467.08 |
|
Grey Cast Iron |
3107 |
0.265 |
0.0178 |
3.45 |
130.6 |
Table 3. The results of numerical analysis under 400-watt of the laser power
|
Material |
Max. Temp. ℃ |
Total Deformation (mm) |
Max. Strain |
Max. Stress (Gpa) |
Max. Shear Stress (Mpa) |
|
Structural Steel |
4508 |
0.36 |
0.027 |
5.317 |
150 |
|
Stainless Steel |
8093 |
0.44 |
0.13 |
25.7 |
665 |
|
Grey Cast Iron |
5338 |
0.397 |
0.032 |
3.43 |
117.3 |
Table 4. The results of numerical analysis under 600-watt of the laser power
|
Material |
Max. Temperature ℃ |
Total Deformation (mm) |
Max. Strain |
Max. Stress (Gpa) |
Max. Shear Stress (Mpa) |
|
Structural Steel |
6543 |
0.41 |
0.044 |
8.62 |
273 |
|
Stainless Steel |
9498 |
0.55 |
0.16 |
31.6 |
793.8 |
|
Grey Cast Iron |
6895 |
0.47 |
0.046 |
4.86 |
154.5 |
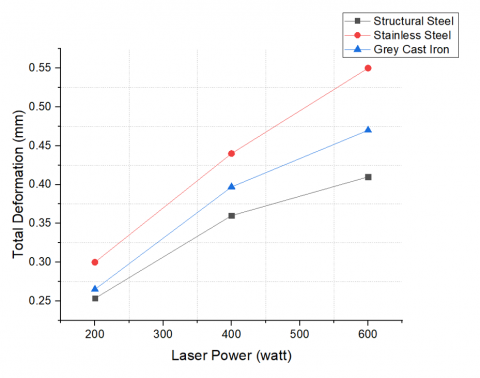
Figure 8 presents the total deformation for the three materials subjected to the various laser powers. The peak overall deformation happened in stainless steel and the minimum value for structural steel and by increasing the laser power, the total deformation increased.
Figure 8. Total deformation
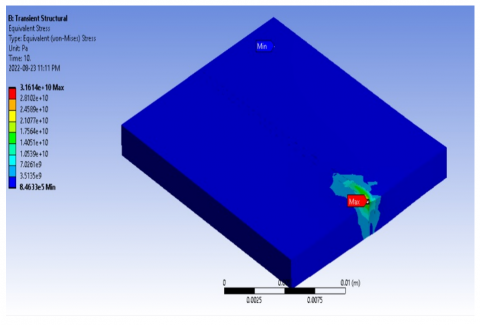
Figure 9. Stress contour for stainless steel under 600-watt
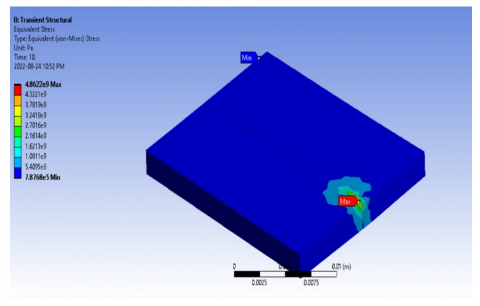
Figures 9 and 10 show the stress distribution contour according to the Von Mises criteria for stainless steel and Grey Cast Iron under laser power of 600 watts. Figures depict that the workpiece surface regions along the scanning line that were impacted by the focused laser beam had high levels of von Mises stress.
Figure 10. Stress contour for Grey Cast Iron under 600-watt
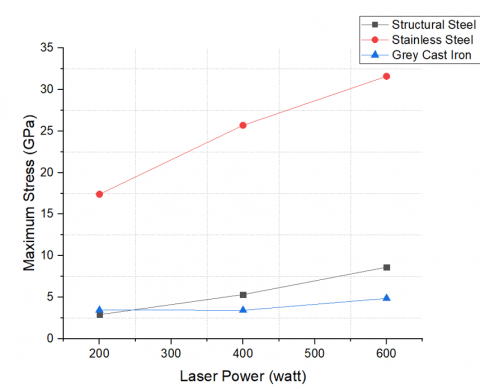
Figure 11. Maximum stress for the three materials
Figure 11 exhibits a comparison of the extreme stress according to Von Mises theory and the maximum value that happened for stainless steel which caused the maximum temperature and subsequently maximum deformation higher than the other two materials. Due to the impact of thermal stress, the Von Mises stress value increases in regions at the laser irradiation site.
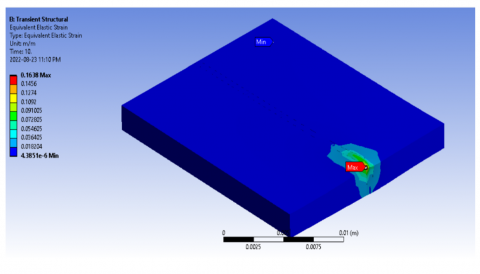
Figures 12 and 13 display the equivalence elastic strain distribution contour for stainless steel and structural steel subjected to laser with a power of 600 watt. Due to their restriction, the scanning zones experience substantial thermal stress (not free to expand).
Figure 12. Strain contour for stainless steel
Figure 13. Strain contour for structural steel
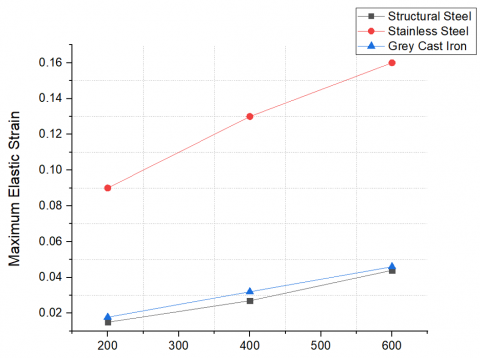
Figure 14. Maximum elastic strain for the three materials
Figure 14 depicts a comparison of the maximum elastic strain for three materials. It could be observed that the maximum value of elastic strain happened in stainless steel and this is due to maximum stress in this material which increased the deformation and subsequently increased the elastic strain.
It could be noticed Figure 15 presents the maximum shear stress that also occurred in stainless steel as a result of high temperature and maximum stress which cause the maximum deformation and maximum shear stress more than the other materials.
Figure 15. Maximum shear stress
Although the finite element method can used to reduce cost, save time and can provide accurate results, however there will be differences with experimental results because the finite elements can provide ideal environment that cannot be existed in experimental tests because the plate can contain some defects during the manufacturing process and this should be taken in consideration during the comparison between the numerical and experimental results.
It can be observed that the by increasing the laser power led to melting the material and increased the deformation of the plate.
The main conclusions of this work are the maximum value of laser power located in the laser beam which raised the temperature the material above the melting point. By increasing the laser power, the temperature increased which led to increased stress and strain and this happened for stainless steel higher than the other two materials. Stainless steel exhibited the highest maximum temperature, total deformation, stress and strain during laser cutting. This is because stainless steel has a higher alloy content and metallurgical interactions that generate more heat during cutting. It is recommended for future works to use various materials such as high-strength steel with various thicknesses to study the influence of the material thickness on the deformation and stresses that are generated during the laser cutting operation. It is also recommended to apply these tests experimentally and compare the results to see the effect of defects on the results and their accuracy.
[1] Yusoff, N., Ismail, S. R., Mamat, A., Ahmad-Yazid, A. (2008). Selected Malaysian wood CO2-laser cutting parameters and cut quality. American Journal of Applied Sciences, 5(8): 990-996. https://doi.org/10.3844/ajassp.2008.990.996
[2] Kim, M.J. (2005). 3D finite element analysis of evaporative laser cutting. Applied Mathematical Modeling, 29(10): 938-954. https://doi.org/10.1016/j.apm.2005.02.015
[3] Pilarczyk, J., Banasik, M., Dworak, J., Stano, S. (2006). Technological applications of laser beam welding and cutting at the Instytut Spawalnictwa. Przeglad Spawalnictwa, 5(6): 6-10.
[4] Muhsin, N.M.B., Dhaher, N.H. (2020). Finite elements analysis of laser cutting process. NeuroQuantology, 18(5): 50-55. https://doi.org/10.14704/nq.2020.18.5.NQ20167
[5] Thombansen, U., Hermanns, T., Stoyanov, S. (2014). Setup and maintenance of manufacturing quality in CO2 laser cutting. Procedia CIRP, 20: 98-102. https://doi.org/10.1016/j.procir.2014.05.037
[6] Bachy, B., Franke, J. (2014). Simulation of laser structuring by three dimensional heat transfer model. In 2014 9th International Microsystems, Packaging, Assembly and Circuits Technology Conference (IMPACT), Taipei, Taiwan, pp. 437-444. https://doi.org/10.1109/IMPACT.2014.7048377
[7] Genna, S., Menna, E., Rubino, G., Tagliaferri, V. (2020). Experimental investigation of industrial laser cutting the effect of the material selection and the process parameters on the kerf quality. Applied Sciences, 10(14): 4956. https://doi.org/10.3390/app10144956
[8] Kristiansen, M., Villumsen, S., Olsen, F.O. (2015). Modelling of the remote fusion cutting process based on experiments. Physics Procedia, 78: 110-119. https://doi.org/10.1016/j.phpro.2015.11.023
[9] Sifullah, A.M., Ahmed, K.I., Nukman, Y., Hassan, M.A., Hossain, A. (2017). Laser cutting of square blanks in stainless steel-304 sheets: HAZ and thermal stress analysis. Sains Malaysiana, 46(5): 755-762. http://dx.doi.org/10.17576/jsm-2017-4605-10
[10] Grepl, M., Pagáč, M., Petrů, J. (2012). Laser cutting of materials of various thicknesses. Acta Polytechnica, 52(4). https://doi.org/10.14311/1592
[11] Sifullah, A.M., Nukman, Y., Hassan, M.A., Hossain, A. (2016). Finite element analysis of fusion laser cutting on stainless steel-304. ARPN Journal of Engineering and Applied Sciences, 11(1): 181-189.
[12] Babalová, E., Taraba, B., Duehring, S. (2012). Computer modeling methodology for laser cutting process supported with experiment ostainless steel plate. In 8th International DAAAM Baltic Conference Industrial Engineering Tallinn, Estonia.
[13] Senthilkumar, V., Jayaprakash, G. (2017). Parametric investigation and modelling of hardness and surface quality in CO2 laser cutting process of AISI 314 stainless steel. Journal of New Materials for Electrochemical Systems, 20(3): 101-107. https://doi.org/10.14447/jnmes.v20i3.402