Jia Zhou*![]() | Dongling Liang
| Dongling Liang![]()
© 2023 IIETA. This article is published by IIETA and is licensed under the CC BY 4.0 license (http://creativecommons.org/licenses/by/4.0/).
OPEN ACCESS
As the urgency of global climate change mitigation accelerates, green integrated-energy systems have emerged as essential components of sustainable energy solutions. The thermal subsystem, responsible for heating and cooling functions, serves as a pivotal element, with its steady-state characteristics exerting a significant influence on the overall system's performance and efficiency. Current methodologies for steady-state analysis, however, are often characterized by inaccuracies and oversights, primarily due to model simplification and the disregard of critical parameters. Moreover, these techniques demonstrate deficiencies when handling intricate interactions or non-linear relationships. This research introduces an innovative approach for examining the steady-state characteristics of the thermal subsystem, addressing the limitations inherent in existing methods. Initially, comprehensive mathematical models were constructed for each unit within the thermal subsystem—heat pumps, boilers, and chillers—incorporating numerous physical processes and parameters to enhance model fidelity. Following this, the steady-state power of the thermal subsystem was assessed to ascertain performance and efficiency under various operational conditions. Subsequent to this evaluation, an analysis of the interaction between the thermal subsystem and the primary system was conducted, estimating the thermal subsystem's impact on the overarching system. Through this multifaceted examination, a more precise and holistic understanding of the thermal subsystem's steady-state characteristics was gleaned, offering valuable insights for the optimization of integrated-energy system design and operation. These findings not only have the potential to augment energy efficiency and environmental sustainability, fostering the advancement and application of green technologies, but also offer a significant resource for engineers, scientists, policy makers, and other stakeholders for the informed design, optimization, and policy formulation of thermal subsystems.
green integrated-energy system, thermal subsystem, steady-state characteristics, mathematical model, power analysis
With escalating global climate change challenges, green integrated-energy systems have garnered considerable attention as potential mitigatory solutions [1, 2]. Green integrated-energy systems, by virtue of their capacity to synergize multiple renewable energy sources, can bolster energy utilization efficiency while curbing environmental degradation, thus offering substantial ecological and economic benefits [3-5]. Integral to such systems, the thermal subsystem—tasked with heating and cooling processes—directly influences overall operational efficacy and system performance [6, 7]. An investigation into the operational characteristics of the thermal subsystem is, therefore, of paramount importance, considering its significant correlation with the energy utilization and environmental advantages of the primary system [8-10].
Typically, the thermal subsystem within an integrated-energy system comprises multiple types of equipment, including but not limited to micro gas turbines, waste heat boilers, heat exchangers, and thermal energy storage devices [11-13]. However, the complexity of the operational conditions and parameters necessitates an accurate analysis of the thermal subsystem's steady-state characteristics. Such an analysis can inform system optimization strategies, minimize energy consumption, and provide scientific underpinnings for system design and operation, thereby enabling governments and enterprises to formulate effective energy policies and strategies [14-17].
Despite the urgency of these tasks, current methods for analyzing the steady-state characteristics of thermal subsystems exhibit several limitations. For instance, oversimplified modeling processes often disregard key physical processes and parameters, leading to inaccuracies in analytical outcomes [18-22]. Additionally, these methods frequently lack the flexibility and precision to handle complex interactions and non-linear relationships inherent to the subsystem. A further oversight is the insufficient consideration given to the interaction between the thermal subsystem and the main system, resulting in a lack of comprehensive evaluation of the thermal subsystem's role and impact within the integrated-energy system.
In light of these deficiencies, this research advances a novel approach for analyzing the steady-state characteristics of the thermal subsystem in a green integrated-energy system. Initially, a suite of models for each unit within the thermal subsystem was developed, considering a broader array of physical processes and parameters to enhance accuracy. Subsequently, an in-depth analysis of the subsystem's steady-state power was conducted to ascertain performance and efficiency under varying operating conditions. Finally, an examination of the interaction between the thermal subsystem and the main system was carried out, estimating the impact of the subsystem on the overall system performance under diverse conditions.
It is noteworthy that these models were developed with a focus on accuracy and comprehensiveness, considering all key units within the thermal subsystem and incorporating a broader range of physical processes and parameters. An advanced analytical methodology was employed to address the subsystem's non-linearity, thereby improving the flexibility and precision of the analysis.
In conclusion, this study offers a fresh perspective and approach to investigating the steady-state characteristics of the thermal subsystem within a green integrated-energy system. These findings hold potential to not only improve the system's energy utilization efficiency and environmental benefits but also foster the development and application of green technologies. It is anticipated that these insights will serve as valuable references for engineers, scientists, policy makers, and other stakeholders, thereby facilitating the optimization of thermal subsystem design and operation, and the formulation of relevant policies and strategies.
In this study, a “source-grid-load-storage” model was built for green integrated-energy systems which integrate renewable energy sources such as photovoltaic power and wind power and significantly promote the use of new energy sources (in Figure 1). With the help of such systems, renewable energy can be integrated into the energy supply chain more effectively, thereby reducing dependence on fossil fuels. Integrated-energy systems can realize cascade energy utilization, which means that the energy in the system can be used at multiple levels, in the meantime, such cascade utilization of multiple energy types enhances energy supply reliability, and through integrating multiple energy sources and utilizing storage devices, the system can maintain stable energy supply during peak hours or in case of insufficient energy supply.
Figure 1. Structure of green integrated-energy system
The thermal subsystem is the kernel component in an integrated-energy system that is responsible for processing and distributing heat energy, and the analysis of its steady-state characteristics enables researchers to more accurately understand and assess how each component works under different conditions, then the operating parameters of the system could be optimized to improve energy efficiency. In an integrated-energy system, cascade utilization of energy is a crucial measure of energy saving. Analyzing the steady-state characteristics of thermal subsystem is conductive to effectively managing and utilizing the waste heat, and figuring out the steady-state behaviour of thermal subsystem is helpful to predict and prevent failures and inefficient operation. Measures such as regular maintenance and system parameter adjustment can be adopted to improve system reliability and continuity, thereby reducing downtime and repair costs.
In an integrated-energy system, the thermal subsystem is a highly integrated module that is mainly responsible for processing and distributing thermal energy (in Figure 2). Micro gas turbine, waste heat boiler, heat exchanger, gas boiler (auxiliary boiler), and thermal energy storage devices are usually contained in the system, constituting an efficient, flexible and sustainable solution of thermal energy management.
Figure 2. A schematic diagram of the thermal subsystem
Micro gas turbine is an efficient power generation device that uses natural gas or other gaseous fuels to generate power, it is a kernel component in the system since it not only provides electrical power to the system, but also generates waste heat that can be utilized further. Assuming: OLY(y) represents the generated power of the micro gas turbine at time moment y, OGA(y) represents the power of natural gas consumed by the micro gas turbine for generating power at time moment y, λLY represents the generated power of the micro gas turbine, then the formula for calculating the output power of the micro gas turbine is:
$O_{L Y}(y)=O_{G A}(y) \times \lambda_{L Y}$ (1)
The waste heat boiler receives the waste heat generated by the micro gas turbine and uses it to produce steam or hot water. The recovery and reuse of waste heat can greatly improve the overall energy efficiency of the system while reducing impact on environment. Assuming: WLY(y) represents the power of exhaust waste heat generated by the waste heat boiler during time period y, λM represents the rate of heat loss, then the formula for calculating the power of exhaust waste heat generated by the waste heat boiler is:
$W_{L Y}(y)=\frac{O_{L Y}(y)\left(1-\lambda_{L Y}-\lambda_M\right)}{\lambda_{L Y}}$ (2)
The role of heat exchanger in the system is to transfer heat between different media, so as to meet different heat demands. Assuming: WRLub(y) represents the heat flow at the heating side of heat exchanger, WRL(y) represents the heat flow at the heated side, λRL represents the thermal efficiency of the heat exchanger, since the operating efficiency does not vary significantly with load, the heat exchange model can be characterized by a constant efficiency model shown as the following formula:
$W_{R L}(y)=\lambda_{R L} W_{R L u b}(y)$ (3)
The gas boiler acts as an auxiliary device that kicks in to provide additional heat when the waste heat produced by the micro gas turbine is not sufficient to meet the heat load of the system. This ensures the system to maintain stable operation in case of high heat demand. In this study, a gas boiler was introduced to the thermal subsystem as an auxiliary boiler to cope with situations of insufficient heat load supply. Assuming: OZHL(y) represents the power of gas consumption of the gas boiler during time period y, WZHL(y) represents the power of heat generation, λZHL represents the heat conversion efficiency of the gas boiler, then the following formula gives the expression of the output model of the gas boiler:
$W_{Z H L}(y)=O_{Z H L}(y) \lambda_{\text {ZHL }}$ (4)
The thermal energy storage devices are components used to store excess heat for later use. The excess heat can be stored when the thermal energy produced by the system exceeds the demand. In demand peak hours or in cases that the micro gas turbine is unable to provide enough heat, these stored thermal energy can be released to meet heat demand. For thermal energy storage devices such as large heat storage tanks, heat storage sinks, or heat storage-style electric boilers, the relationship between heat storage capacity and input/output heat power and efficiency can be used to describe the heat storage features. Assuming: GCR(y) represents the heat storage capacity during time period y, Wg,ST(y) and Wg,RE(y) respectively represent the input and output heat power during time period y, then there is:
$G_{\ Y R A}(y)=\left[\lambda_{g, S T} O_{g, S T}(y)-\frac{O_{g, S T}}{\lambda_{g, S T}}\right] \Delta y+G_{\ Y R A}(y-1)$ (5)
Calculating and analyzing the steady-state power of the thermal subsystem in the integrated-energy system is an important work. The generation of wind power and other clean energy is usually intermittent, so the steady-state power analysis of the thermal subsystem is conductive to effectively planning and utilization of clean energy, thereby ensuring that the energy can be fully used when produced, and reducing reliance on non-renewable energy sources.
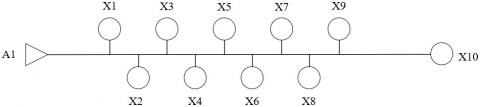
Figure 3. A directed map of water heating pipeline network
It’s important to ensure that the model can correctly reflect the behaviour of the thermal subsystem, as it provides a reliable basis for subsequent optimization and decision-making. Via mathematical modelling, introducing actual examples, and calculation and analysis, the validity of the model could be verified, and accurate calculation of the steady-state power allows us to better understand the energy flow and distribution in the system. In this way, potential energy wastage and inefficiency could be discovered so that proper measures could be taken to optimize the configuration and thus improving the energy utilization efficiency of the entire system.
In most cases, water heating is more efficient than electric heating because it involves transferring heat generated by boiler or heat pump through water to radiators or floor heating systems, and this method has a higher heat transfer efficiency so it’s reasonable to be adopted with priority under normal conditions (in Figure 3). But sometimes, due to external conditions (such as a sudden drop in temperature) or special demands (such as a higher requirement of indoor temperature), the water heating systems may not be able to meet all heating needs, and in such cases, being able to switch to electric heating or adding additional amount of heat produced by electric heating can provide extra flexibility and emergency response ability. In this study, the water heating was taken as the basic heating method in the green integrated-energy system and the electric heating was adopted as an assisted heating method. Such control method can optimize the utilization of different energy sources, helping the system to meet heat demands while reducing energy waste and environmental impact to the greatest extent.
Assuming: yu represents the indoor temperature, Or represents the power of electric heating, then there is Or=d(yu); ∆Wq represents the heat loss of the building, ∆WSS represents the basic heating demand, then there is ∆Wq=∆WSS, these assumptions can be simplified to a constant differential equation:
$\frac{d y_u}{d \pi}=s y_u+n$ (6)
The general solution of indoor temperature yu in above equation is yu=V1esy-n/s. The comprehensive dynamic heating feature equation of the green integrated-energy system can be transformed as follows:
$V_s \frac{d y_u}{d \pi}=v_q H_q\left(y_h-y_g\right)+j_{r g} O_r-I_s\left(t_u-t_p\right)$ (7)
Namely:
$\frac{d y_u}{d \pi}=\frac{v_q H_q\left(y_h-y_g\right)+j_{r g} O_r-I_s\left(y_u-y_p\right)}{V_s}$ (8)
That is:
$\frac{d y_u}{d \pi}=-\frac{-I_s}{V_s} y_u+\frac{v_q H_q\left(y_h-y_g\right)+j_{r g} O_r+I_s y_p}{V_s}$ (9)
According to above equations, there are s=-Is/Vs and n=vqHq(yh-yg)+jrgOr+Isyp/Vs. To keep the indoor temperature constant at a specified value, namely yu is constant, then there is fyu/fπ=0, and equation could be attained after conversion, that is vqHq(yh-yg)+jrgOr+Isyp=0, namely vqHq(yh-yg)+jrgOr=Is(yu-yp).
The above analysis shows that:
(1) About the heat supply control strategy in case of constant indoor temperature. If indoor temperature yu is to be maintained constant (it is proportional to hot water flow rate Hq and electric power Or), then there is:
$y_u=\frac{v_q H_q\left(y_h-y_g\right)+j_{r g} O_r}{I_s}$ (10)
Assuming: vq represents the specific heat capacity of water, then the formula below calculates the scaling factor of hot water flow rate:
$\frac{v_q\left(y_h-y_g\right)}{I_s}$ (11)
According to above formula, the greater the electric heating conversion coefficient jrg, the greater the scaling factor of electric power jrg/Is, and the greater the coefficient of the ratio of indoor temperature to electric power.
(2) Next, the minimum flow of water heating under the condition of minimal acceptable indoor temperature was calculated, in case that only the water heating was considered, the above formula can be simplified:
$v_q H_q\left(y_h-y_g\right)=I_s\left(y_u-y_p\right)$ (12)
$H_q=\frac{I_s\left(y_u-y_p\right)}{v_q\left(y_h-y_g\right)}$ (13)
(3) Adjustment of heating strategy in case of outdoor temperature changes:
People usually have a certain comfort range for indoor temperature. When outdoor temperature changes, the indoor temperature may exceed this comfort range if the heating strategy is not adjusted. Thus, by adjusting the heating power according to outdoor temperature changes, the indoor comfort level could be maintained. If the heating continues at a same power when the outdoor temperature increases, it will cause unnecessary energy waste. Adapting to the rise of outdoor temperature via reducing heating power can increase energy efficiency and reduce energy consumption. Therefore, adjusting heating strategy according to outdoor temperature changes is reasonable since it conduces to maintaining a comfortable indoor environment, increasing energy efficiency, saving costs, and fulfilling the environmental responsibility. Moreover, this adaptive strategy can also enhance the response performance and flexibility of the system, enabling it to cope with different environmental conditions more effectively.
Under the condition that the heating power and the heat transfer coefficient are fixed, the indoor temperature will change with outdoor temperature, and the following formula gives the relationship between indoor temperature yu and outdoor temperature yp:
$y_u=\frac{v_q H_q\left(y_h-y_g\right)+j_{r g} O_r}{I_s}+y_p$ (14)
(4) Control logic of electric heating:
In this study, the classic PID control was adopted as the control logic of electric heating to respond to changes or demands of indoor temperature via power regulation. The PID control can regulate electric heating power in a more accurate and responsive manner as it adjusts the output according to the difference between indoor temperature and the target temperature (the proportion term), the accumulated difference (the integral term), and the change rate of the difference (the differential term), and this method enables the system to rapidly respond to temperature changes and accurately regulate the electric heating. As the system is able to timely and accurately respond to changes in indoor temperature, the indoor temperature can be maintained within a desirable range in cases of outdoor temperature changes or a user may need an extra degree of comfort.
One more thing, the PID control can provide just enough electric heating power as needed to avoid overheating, which not only reduces energy wastage, but also increases overall energy efficiency. Its control process is dynamic, which means that it can well adapt to the ever-changing conditions of both indoor temperature and user demand and make corresponding adjustments.
(5) Time required for indoor temperature changes:
Analyzing the law of indoor temperature changes, especially the time required for indoor temperature changes, is particularly important for the analysis of the steady-state characteristics of thermal subsystem. By studying the effect of hot water flow and water supply temperature on indoor temperature changes, the response time of the system could be figured out. The system response time refers to the speed of the system to respond to changes and reach a new steady state. A short response time means that the system can quickly adapt to changes, and a long response time can cause delay. In addition, the level of comfort is important for an indoor environment, and understanding the time variation law of indoor temperature changes is conductive to formulating more effective control strategy to keep the indoor temperature within a comfortable range, even in cases that there are changes in the external environmental conditions.
Assuming: yu=30 (indoor temperature) and Or=0 (electric heating power), the supply and return temperatures of the heating hot water were fixed, then the hot water flow rate could be calculated. By substituting the parameter values of actual cases, it’s attained that Hq=1.36. Then, the reduced flow of heating hot water was Hq=0.947, fyu/fπ=ayu+n,s=-Is/Vs=-0.000145, n=vqHq(yh-yg)+jegOr+Isys/Vs=0.00024, yu(0)=30, yu=V1esπ-n/s, 30=V1-0.00024/-0.000015, so V1=-0.000214.
Thus, after the flow of heating hot water was changed to 0.947, the law of indoor temperature changes can be expressed as:
$y_u=\frac{-0.0002 e^{-0.0000145 \pi}-0.00024}{-0.000015}$ (15)
If the supply temperature of heating hot water is adjusted to 70℃, then the expression of the law of indoor temperature changes can be converted to:
$\left\{\begin{array}{l}\frac{d y_u}{d \pi}=s y_u+n \\ s=\frac{-I_s}{V_s} \\ n=\frac{v_q H_q\left(y_h-y_g\right)+j_{r g} O_r+I_s t_p}{V_s}\end{array}\right.$ (16)
Under given operating conditions Hq=0.811 and yh=70, it can be calculated that s=-0.0000145, n=0.000117, the indoor temperature at the initial moment was 30℃, yu(0)=30, yu=V1esπ-n/s, 30=V1-0.00026/-0.0000145.
It can be calculated that V=-0.000344, then there is:
$y_u=\frac{-0.000344 e^{-0.0000145 \pi}-0.000117}{-0.0000145}$ (17)
Figuring out how indoor temperature varies with the flow and temperature of heating hot water is helpful to utilizing the energy more effectively. By adjusting these parameters, the level of comfort could be maintained while reducing energy waste. As mentioned above, when there are sudden changes in the flow and temperature of hot water, indoor temperature won’t respond immediately but will change slowly within a certain period of time, and this slow changing process gives an opportunity of temporary adjustment of heating power, which can increase system flexibility and provide more control options.
Table 1 lists the heat loss of first-level pipeline network (main pipeline network) under different supply and return water temperatures. By observing the data of several key parameters given in the table, such as the impact of pipe diameter, supply water temperature and return water temperature on heat loss, it can be known that when the supply water temperature was relatively high, the heat loss of supply pipe was high as well, this is because the temperature difference with surrounding environment is greater in case of higher supply water temperature, and more heat will be dissipated to the environment through the insulation pipe. When the return water temperature was relatively high, the heat loss of return water pipe was higher as well, and this is similar to the impact of supply water temperature, that a higher return water temperature can increase the temperature difference between pipeline and ambient temperature, thereby increasing heat loss. According to the data given in the table, when the pipe diameter increased from 180mm to 230mm, the heat loss increased as well, and this is because a larger pipe diameter means a greater surface area, which can increase heat exchange with the environment, thereby leading to a greater heat loss. In summary, to reduce heat loss, a suitable pipe diameter should be adopted and the temperatures of the supply and return water should be decreased as much as possible, however, the decrease of supply water temperature should be adjusted without affecting the comfort level of indoor temperature. Besides, the selection of insulation materials and techniques is also an important factor for reducing heat loss. During actual operations, a balance between heat loss, system efficiency, and comfort level of indoor environment should be found, and advanced control strategies and real-time monitoring systems should be adopted to effectively manage these factors, thereby optimizing the performance of the heating system and reducing heat loss.
Table 2 shows the degree of thermal imbalance of first-level pipeline network heat users under the condition of different outdoor temperatures. The degree of thermal imbalance is usually used to measure the efficiency and performance of a heating system, and the closer its value is to 1, the better the efficiency and performance of the heating system. According to data given in the table, with the rise of outdoor temperature, the degree of thermal imbalance of heat users exhibited a slight decline trend, this is because at higher outdoor temperatures, the heating system doesn’t have to work too hard to maintain a comfortable indoor temperature, leading to a decrease in the degree of thermal imbalance. For different heat users under a same outdoor temperature, the values of thermal imbalance degree might be different, which is caused by factors such as the insulation performance of the building, the size of the building, and the use habit of different heat users. For instance, as can be seen from the table, the thermal imbalance degree of Heat user 8 showed a sudden increase when the outdoor temperature was -15°C, and this was caused by some specific use situations or the changes in equipment performance. The values of the thermal imbalance degree of all users were very close to 1, indicating that the efficiency and performance of the heating system were good. However, there is still room for improvement, especially for some specific outdoor temperatures or heat users, in which case, the heating system may give a high efficiency and performance but there’s still room for improvement, and special attention should be paid to the changes in the degree of thermal imbalance to give in-depth analysis and find out the root reasons. Via optimizing heating strategy, improving the insulation performance of the building, or adjusting the configuration of the heating system, the thermal imbalance degree of heat users can be further improved and the overall efficiency and performance of the heating system can be increased.
Table 1. Statistics of heat loss and length of first-level pipeline network
|
Pipe Diameter (mm) |
Insulation Pipe diameter (mm) |
Pipe Centre Distance (mm) |
Supply Water Temperature (℃) |
Return Water Temperature (℃) |
Heat Loss of Supply Pipe (W/m) |
Heat Loss of Return Pipe (W/m) |
|
180 |
300 |
450 |
132 |
71 |
70.9 |
42.1 |
|
111.5 |
63.2 |
67.3 |
39.4 |
|||
|
94.6 |
56.7 |
58.3 |
39.2 |
|||
|
83.9 |
54.3 |
56.2 |
38.2 |
|||
|
75.9 |
48.6 |
49.9 |
37.5 |
|||
|
65.2 |
45.3 |
47.8 |
27.8 |
|||
|
55.3 |
38.2 |
37.5 |
24.9 |
|||
|
230 |
350 |
530 |
121 |
71 |
88.7 |
51.2 |
|
112.3 |
65.3 |
87.3 |
43.2 |
|||
|
76.4 |
59.4 |
76.3 |
49.7 |
|||
|
89.4 |
55.3 |
68.3 |
45.4 |
|||
|
73.5 |
48.9 |
58.3 |
38.2 |
|||
|
68.1 |
47.2 |
54.2 |
35.2 |
|||
|
54.3 |
37.7 |
44.9 |
31.0 |
Table 2. Degree of thermal imbalance of first-level pipeline network heat users
|
Outdoor Temperature ℃ |
-26 |
-20 |
-15 |
-10 |
-5 |
0 |
5 |
|
Heat user 1 |
0.996 |
0.996 |
0.995 |
0.995 |
0.994 |
0.993 |
0.993 |
|
Heat user 2 |
0.995 |
0.995 |
0.994 |
0.994 |
0.993 |
0.992 |
0.992 |
|
Heat user 3 |
0.995 |
0.995 |
0.993 |
0.993 |
0.993 |
0.991 |
0.991 |
|
Heat user 4 |
0.994 |
0.994 |
0.992 |
0.992 |
0.992 |
0.990 |
0.990 |
|
Heat user 5 |
0.994 |
0.993 |
0.993 |
0.992 |
0.992 |
0.991 |
0.991 |
|
Heat user 6 |
0.993 |
0.993 |
0.990 |
0.990 |
0.990 |
0.988 |
0.988 |
|
Heat user 7 |
0.992 |
0.992 |
0.991 |
0.991 |
0.987 |
0.987 |
0.987 |
|
Heat user 8 |
0.991 |
0.990 |
0.997 |
0.987 |
0.986 |
0.984 |
0.983 |
|
Heat user 9 |
0.991 |
0.991 |
0.987 |
0.987 |
0.986 |
0.984 |
0.983 |
|
Heat user 10 |
0.986 |
0.986 |
0.981 |
0.981 |
0.980 |
0.979 |
0.978 |
Table 3. Indoor temperatures of first-level pipeline network heat users after heating strategy adjustment
|
Outdoor Temperature/℃ |
-26 |
-20 |
-15 |
-10 |
-5 |
0 |
5 |
|
Heat user 1 |
17.85 |
17.86 |
17.84 |
17.87 |
17.88 |
17.89 |
17.93 |
|
Heat user 2 |
17.83 |
17.84 |
17.85 |
17.86 |
17.87 |
17.88 |
17.91 |
|
Heat user 3 |
17.82 |
17.83 |
17.81 |
17.84 |
17.86 |
17.85 |
17.87 |
|
Heat user 4 |
17.78 |
17.82 |
17.78 |
17.84 |
17.86 |
17.84 |
17.82 |
|
Heat user 5 |
17.75 |
17.72 |
17.75 |
17.77 |
17.83 |
17.86 |
17.82 |
|
Heat user 6 |
17.72 |
17.75 |
17.72 |
17.73 |
17.76 |
17.87 |
17.83 |
|
Heat user 7 |
17.69 |
17.75 |
17.66 |
17.78 |
17.74 |
17.73 |
17.88 |
|
Heat user 8 |
17.64 |
17.65 |
17.63 |
17.66 |
17.78 |
17.75 |
17.75 |
|
Heat user 9 |
17.53 |
17.66 |
17.56 |
17.55 |
17.64 |
17.63 |
17.77 |
|
Heat user 10 |
17.43 |
17.46 |
17.33 |
17.47 |
17.54 |
17.67 |
17.62 |
Table 3 lists the indoor temperatures of several first-level pipeline network heat users after the heating strategy adjustment under different outdoor temperature conditions. Data in the table show that, in most cases, with the rise of outdoor temperature, the indoor temperature increased slightly, this is because when the outdoor temperature is higher, the heat loss of the building reduces, so the indoor temperature is relatively high, and this is in line with the relationship between outdoor and indoor temperatures discussed in previous sections. Under a same outdoor temperature, different heat users may have different indoor temperatures, and this is due to the differences in insulation performance of the building, the configuration of heating system, and the use habit. The indoor temperature of some heat users may be stable, while for some other users, the indoor temperature may change greatly at different outdoor temperatures. Although in most cases the indoor temperature would increase slightly with the rise of outdoor temperature, under some specific conditions, the change of indoor temperature may not be always proportional to the outdoor temperature, and this is caused by the adjustment of heating strategy or other factors. It can be known from the table, the adjustment of heating strategy is very important for maintaining a comfortable indoor temperature, especially when the outdoor temperature varies greatly. Different heat users need different heating strategies to adapt to specific building characteristics and use requirements. As for heat users with large indoor temperature fluctuations, further analysis is needed to optimize heating strategy and improve the stability of indoor temperature and the comfort level of indoor environment. Overall speaking, through appropriate adjustment of heating strategies, a stable and comfortable indoor environment could be provided for heat users under different outdoor temperature conditions.
Table 4. Simulation data of different models
|
Amount of Heat Supply (kW) |
Design data |
0 |
0 |
0 |
119474 |
186627 |
163829 |
163839 |
|
Simulation data of the proposed model |
0 |
0 |
0 |
108463 |
178374 |
167838 |
163893 |
|
|
Simulation data of the reference model |
0 |
0 |
0 |
108376 |
160874 |
152634 |
157373 |
|
|
Relative error of the proposed model % |
/ |
/ |
/ |
-0.02 |
0.03 |
-0.14 |
0.15 |
|
|
Relative error of the reference model % |
/ |
/ |
/ |
5.79 |
5.48 |
5.58 |
5.69 |
|
|
Total Energy Supply (kW) |
Design data |
143639 |
118363 |
84736 |
218374 |
253738 |
243673 |
253737 |
|
Simulation data of the proposed model |
136338 |
103874 |
85949 |
219843 |
257373 |
258497 |
251803 |
|
|
Simulation data of the reference model |
136368 |
108363 |
85849 |
218746 |
246379 |
246373 |
232667 |
|
|
Relative error of the proposed model % |
-1.84 |
-1.64 |
-1.54 |
-0.31 |
-0.43 |
-0.56 |
-0.31 |
|
|
Relative error of the reference model % |
-0.28 |
-0.31 |
-2.71 |
1.34 |
2.77 |
2.13 |
3.21 |
Table 4 shows the design data and compares the simulation data of two different models (the model proposed in this study and a reference model used for comparison). The reference model is a model simplified based on the energy balance principle. According to the table, in case of the amount of heat supply, when the power was relatively large (greater than 0), the proposed model performed better in terms of relative error. The range of the relative error of the proposed model was very small, varying from -0.14% to 0.15%; while the range of the relative error of the reference model was larger, between 5.48% and 5.79%, indicating that in terms of the prediction of heat supply amount, the proposed model was closer to the design data. In case of the total energy supply, the proposed model also had a lower relative error, ranging from -1.84% to -0.31%; in contrast, the relative error of the reference model was larger, ranging from -2.71% to 3.21%, again, it indicates that in terms of the prediction of the total energy supply, the proposed model was closer to the design data.
Figure 4. The heat-electricity relationship under varying heating gas flow after heating strategy adjustment
In summary, these conclusions could be drawn based on the data given in above tables: the proposed model had a better performance in the consistency between the predicted heat supply and total energy supply and the design data, and its relative error was lower, indicating that the proposed model was more accurate when simulating the steady-state characteristics of the thermal subsystem. As for the reference model, its prediction of the two aspects was quite different from the design data, which was caused by the inaccurate model simplification, assumption, or parameter selection. Therefore, if accuracy is taken as an indicator, then based on these data, it can be said that the proposed model is a better choice for the steady-state power analysis of thermal subsystem.
Figure 4 plots the relationship between heating gas flow and the amount of electricity generation, the corrected amount of electricity supply, and total energy supply. According to the figure, with the increase of heating gas flow, the amount of electricity generation decreased gradually. This is because as the heating gas flow grows, more gas is used for heating, not for generating electricity, and this is a typical feature of green integrated-energy systems, that is, the system sacrifices a portion of its electricity generation for meeting heating demand. In contrast to the amount of electricity generation, with the increase of heating gas flow, the corrected amount of electricity supply increased gradually. This is because in a green integrated-energy system, a portion of gas energy is converted into thermal energy to supply the heating system, and the rest gas is used for electricity generation. Thus, although the total amount of electricity generation was decreasing, the adjustment made for meeting heating demand had increased the electricity supply efficiency of the grid. The total energy supply remained constant under all conditions, indicating that in case of varying heating gas flow, the system can keep balance of the total energy supply by adjusting the amount of electricity generation and supply. Based on above descriptions, the following conclusions could be drawn: in a green integrated-energy system, when the heating demand increases, the system will sacrifice electricity generation for meeting heating demand. Despite a reduction in electricity generation, the system can efficiently allocate some energy to electricity supply by adjusting the strategy, thereby increasing efficiency of electricity supply. Through such adjustment, the system can maintain a stable total energy supply, which is especially important for ensuring the reliability of heat and electricity supply, and this balance is crucial in a green integrated-energy system, because it can meet different energy needs flexibly without sacrificing the overall energy efficiency.
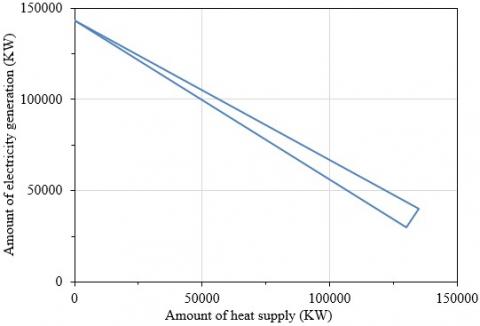
Figure 5. Heat-electricity coupling relationship under electric heating supply control logic at 100% load
Figure 5 plots the relationship between the amount of heat supply and the amount of electricity generation. When the amount of heat supply was 0, the amount of electricity generation reached a maximum of 143000, this is because at this point, all steam was used for electricity generation and not for heat supply. Then, when the amount of heat supply increased to 130000, the amount of electricity generation dropped significantly to 30000, indicating that a large portion of the steam was re-assigned to heating instead of electricity generation. After that, when the amount of heat supply continued to increase to 135000, the amount of electricity generation increased to 40000. This is because at this point, the control logic would optimize the use of steam and effectively assign it between generating electricity and heating. Based on above descriptions, the following conclusions could be drawn: there is an obvious heat-electricity coupling relationship under the electric heating control logic at 100% load. When heating demand increases, the system must sacrifice a portion of electricity generation to meet the heating demand. This relationship is not linear, the control logic optimizes the use of steam at different operating points to increase the amount of electricity generation while maintaining heat supply. For a heat-electricity co-production system, flexibility and adjustment capacity are both important since they enable the system to effectively balance heat supply and electricity generation under different loads and needs.
Figure 6 shows the amount of electricity generation under the condition of different amounts of heat supply. As can be known from the figure, when the amount of heat supply was 0, the amount of electricity generation reached a maximum of 55000, indicating that in case there’s no heat demand, the system will use its resources and energy for electricity generation. Then, as the amount of heat supply increased to 45000, the amount of electricity generation dropped significantly to 10000, indicating that when the system started to supply heat, most energy was used for heating, so the amount of electricity generation was reduced. However, when the amount of heat supply increased to 125000, the amount of electricity generation rose to 45000. This is a non-linear change that indicates there is a control strategy or system configuration that allows the system to produce a high amount of electricity despite of carrying a high heat load. Based on above descriptions, the following conclusions could be drawn: in a green integrated-energy system, there is a heat-electricity decoupling space, which means that the system can adjust its electricity generation under different heat loads. When the demand of heat supply increases, the system will assign more energy for heating, resulting in a decrease in the amount of electricity generation. When the load of heat supply increases further, the system can increase its amount of electricity generation via some methods based on its optimization configuration or control strategy. The flexibility and adjustment capacity are crucial for the green integrated-energy system to realize efficient and sustainable operation. The system should be able to dynamically allocate resources between heat and electricity based on demand, and this flexibility is essential to ensure efficient and low-carbon operation under varying environmental conditions and ever-changing demand. In addition, this also highlights the importance of control strategy optimization in managing heat-electricity coupling and realizing green and low carbon goals.
Figure 6. Heat-electricity decoupling space of load-carrying operation of a green integrated-energy system
This study analyzed the steady-state characteristics of the thermal sub-system in green integrated-energy systems, discussed the heat-electricity coupling relationship of the system, and the relationship between heating strategy adjustment and the amount of heat supply and electricity generation. Based on experimental results, the following conclusions were drawn:
1. Analyzing the law of indoor temperature is crucial for optimizing the control strategy of the thermal subsystem, especially when responding to external temperature changes and user demand. Understanding the time-varying features of temperature changes is necessary to achieve more accurate control and improve system efficiency. In integrated heating systems such as water heating and electric heating, flexibly adjusting the electric heating power can realize faster and more accurate temperature control.
2. In integrated-energy systems, there is a coupling relationship between heat and electricity, thus careful management and optimization are required for realizing efficient operation. The heating strategy adjustment can affect the amount of electricity generation. In some cases, increasing the amount of heat supply would reduce electricity generation, but through optimization configuration and control strategy, the system can still maintain a high output of electricity under high heat load.
3. Through comparison of the simulation data of different models, the accuracy and reliability of the models could be evaluated. An accurate model is particularly important for predicting system performance, formulating effective control strategy, and optimizing system operation.
4. Flexibility and adjustment capacity are crucial for green integrated-energy systems. Through dynamic resource allocation between heat and electricity, the system can maintain efficient and low carbon operation under different environmental conditions and heat demand.
This paper was supported by Technical Service Project of Northeast Agricultural University (Grant No.: 2023HX13017).
[1] Zhang, X., Manogaran, G., Muthu, B. (2021). IoT enabled integrated system for green energy into smart cities. Sustainable Energy Technologies and Assessments, 46: 101208. https://doi.org/10.1016/j.seta.2021.101208
[2] Al Bartamani, B.K., El-Saleh, A.A. (2021). Development of a Smart Solar Tracking (SST) system as a green renewable energy solution. Journal of Physics: Conference Series, 1812(1): 012009. https://doi.org/10.1088/1742-6596/1812/1/012009
[3] Cao, Y., Huang, Y., Liu, R., Zhuo, Y., Liu, P., Nie, J. (2021, April). Capacity Optimization of Multi-energy complementary Microgrid Considering Green Hydrogen System. In 2021 4th International Conference on Energy, Electrical and Power Engineering (CEEPE), Chongqing, China, pp. 765-769. https://doi.org/10.1109/CEEPE51765.2021.9475641
[4] Kumar, K.A., Vardhan, A.S.S., Vardhan, A.S.S., Kumar, S., Saket, R.K., Rajendran, R., Eslamian, S. (2021). Microbial fuel cells for a soil-based green energy conversion system. International Journal of Hydrology Science and Technology, 11(4): 439-460. https://doi.org/10.1504/IJHST.2021.115491
[5] Jonban, M.S., Romeral, L., Akbarimajd, A., Ali, Z., Ghazimirsaeid, S.S., Marzband, M., Putrus, G. (2021). Autonomous energy management system with self-healing capabilities for green buildings (microgrids). Journal of Building Engineering, 34: 101604. https://doi.org/10.1016/j.jobe.2020.101604
[6] Wang, J., You, S., Zong, Y., Træholt, C. (2017). Energylab Nordhavn: An integrated community energy system towards green heating and e-mobility. In 2017 IEEE Transportation Electrification Conference and Expo, Asia-Pacific (ITEC Asia-Pacific), Harbin, China, pp. 1-6. https://doi.org/10.1109/ITEC-AP.2017.8080846
[7] Soltani, M., Nabat, M.H., Razmi, A.R., Dusseault, M.B., Nathwani, J. (2020). A comparative study between ORC and Kalina based waste heat recovery cycles applied to a green compressed air energy storage (CAES) system. Energy Conversion and Management, 222: 113203. https://doi.org/10.1016/j.enconman.2020.113203
[8] Chiou, R.Y., Husanu, I.N.C., Tseng, T.L.B. (2016). A senior design project in automated solar heating system for learning green energy manufacturing. In 2016 ASEE Annual Conference & Exposition. New Orleans, Louisiana, pp. 27276. https://doi.org/10.18260/p.27276
[9] Convertino, F., Vox, G., Schettini, E. (2019). Heat transfer mechanisms in vertical green systems and energy balance equations. International Journal of Design & Nature and Ecodynamics, 14(1): 7-18. https://doi.org/10.2495/DNE-V14-N1-7-18
[10] Feng, X. (2013, January). All green residential solar energy to heat absorption cooling/heating systems. In 2013 Third International Conference on Intelligent System Design and Engineering Applications, Kong, China, pp. 260-265. https://doi.org/10.1109/ISDEA.2012.65
[11] Fowler, N., Wiand, J., Eddy, B., Lowery, A.D., Smith, J.E. (2014). Green heat: Hot water energy offset system. In ASME Power Conference, Baltimore, Maryland, USA, p. V002T09A008. https://doi.org/10.1115/POWER2014-32058
[12] Hung, Y.H., Gu, H.J. (2014). Multiwalled carbon nanotube nanofluids used for heat dissipation in hybrid green energy systems. Journal of Nanomaterials, 2014: 64. https://doi.org/10.1155/2014/196074
[13] Li, H., Burer, M., Song, Z.P., Favrat, D., Marechal, F. (2004). Green heating system: characteristics and illustration with multi-criteria optimization of an integrated energy system. Energy, 29(2): 225-244. https://doi.org/10.1016/j.energy.2003.09.003
[14] Nyers, A., Nyers, J. (2023). Enhancing the energy efficiency-COP of the heat pump heating system by energy optimization and a case study. Energies, 16(7): 2981. https://doi.org/10.3390/en16072981
[15] Gliniorz, R., Petzoldt, C., Mandel, K., Gelbrich, S. (2022). Energy-efficient reinforced heating system implemented as a carbon concrete formwork. In International Scientific Conference Environmental Challenges in Civil Engineering, Opole, Poland, pp. 258-272. https://doi.org/10.1007/978-3-031-26879-3_21
[16] Wu, Q., Chen, M., Ren, H., Shi, S., Su, Y., Lu, J. (2023). Dynamic energy flow analysis of electricity-heating based integrated energy system. Energy Reports, 9: 193-205. https://doi.org/10.1016/j.egyr.2023.04.273
[17] Liu, L., Wang, R., Wang, Y., Li, W., Sun, J., Guo, Y., Qu, W., Li, W., Zhao, C. (2023). Comprehensive analysis and optimization of combined cooling heating and power system integrated with solar thermal energy and thermal energy storage. Energy Conversion and Management, 275: 116464. https://doi.org/10.1016/j.enconman.2022.116464
[18] Pasupuleti, K.T., Dsouza, S., Thejaraju, R., Venkataraman, S., Ramaswamy, P., Murty, S.N. (2018). Performance and steady state heat transfer analysis of functionally graded thermal barrier coatings systems. Materials Today: Proceedings, 5(14): 27936-27945. https://doi.org/10.1016/j.matpr.2018.10.033
[19] Qu, L., Ouyang, B., Yuan, Z., Zeng, R. (2019). Steady-state power flow analysis of cold-thermal-electric integrated energy system based on unified power flow model. Energies, 12(23): 4455. https://doi.org/10.3390/en12234455
[20] Hou, K., Xia, D., Liu, Y., Chen, L., Li, Q., Xu, X. (2016). Steady-state stability analysis of wind-thermal bundled sending system. Dianli Xitong Zidonghua/Automation of Electric Power Systems, 40(22): 154-159, 167. http://dx.doi.org/10.7500/AEPS20160427002
[21] Wang, Y., Liu, Z., Mu, X., Gao, S., Wu, J. (2015). Thermal steady-state analysis and validation with double slide electric contacts in pantograph-catenary system. Tiedao Xuebao/Journal of the China Railway Society, 37(5): 27-33. http://dx.doi.org/10.3969/j.issn.1001-8360.2015.05.005
[22] Hu, X., Liu, S., Peng, J. (2015). Steady state thermal analysis of transmission shaft system of main reducer of helicopter. Zhongnan Daxue Xuebao (Ziran Kexue Ban)/Journal of Central South University (Science and Technology), 46(12): 4469-4475. http://dx.doi.org/10.11817/j.issn.1672-7207.2015.12.012