Mohammad H. Yazdi* | Evgeny Solomin | Ahmad Fudholi | Ghasem Divandari | Kamaruzzaman Sopian | Perk Lin Chong
© 2021 IIETA. This article is published by IIETA and is licensed under the CC BY 4.0 license (http://creativecommons.org/licenses/by/4.0/).
OPEN ACCESS
Solar collectors are systems for absorbing the sun's radiant energy and converting it into heat. The working principle of solar collectors are relying on the solar radiation incident upon the transparent surface, and the collected radiation heat is stored within the operating fluid. However, the conventional operating fluid is less than satisfactory in term of promoting the thermal efficiency of solar collector. Consequently, the aim of this paper is to investigate the use of nanofluid as an operating fluid in a single end evacuated solar collector. The expectation is that the flow behavior of nanofluid can lead to the improvement of thermal efficiency of solar collector. The design of solar collector is carried out using Gambit software and the heat transfer characteristics are simulated by nanofluid flow with 1%, 3% and 5% volumes by ANSYS Fluent software. The results demonstrate good agreement with existing experimental results. The numerical analysis shows the improvement of collector performance compared to pure water fluid. The results show that by increasing the nanoparticles volume fraction the efficiency of the collector improves significantly.
nanofluid flow, evacuated tube solar collector, velocity and temperature distribution, collector efficiency
Throughout Energy production from fossil fuels such as oil, gas and coal cause negative effects on the environment, including greenhouse gas emissions and subsequently climate change as a result of global warming. Many research literatures have highlighted that an alternative source of sustainable energy is essential [1]. One of the most reliable and sustainable sources of energy is solar energy which is the most accessible and cleanest renewable energy source. Only 14.4% of the sun's radiation passes through the earth's atmosphere, yet this amount is about 2800 times more than required energy supply [2]. This absorbed energy can be converted and used in two ways: 1- Conversion of the test energy into electricity by photovoltaic cells 2- Conversion of radiant energy into heat by solar collectors. Nowadays, many researchers are trying to further develop these two existing technologies in order to provide a greater share of the human energy needed from this inexhaustible and clean source [3]. Since the advent of solar collectors, one of the major challenges for designers and builders has been to improve the efficiency and thermal performance of solar collectors. Parameters that influence the performance of the collector include the geographical location of the installation, the angle of the collector relative to the sun, and the type of material used in making the collector. One of the most important parameters is the use of operating fluid with higher heat transfer capability. The most common operating fluid used in solar collectors has been water which has a low heat transfer coefficient and is also more likely to freeze in the winter. Researchers have conducted many experiments on other fluids as coolant, such as nanofluids. The investigation is focused on heat transfer of various nanofluids in relation to geometry aspects of heat exchangers. Since early 2012, improved heat transfer rate by flat plate collectors has been studied by many researchers. Yousefi et al. [4-6] have conducted extensive experiments on this topic, including the impact of different types of nanofluids and the thermophysical properties of nanofluids on their work, and new knowledge has been established in this field. Yousefi et al. [4] investigated the effect of acidic nano-fluid changes on flat plate collector efficiency, whose findings show that more acidic nano-fluid increases collector efficiency. In 2014, Moghaddam et al. [7] investigated the thermal recovery of the collector and indicated an increase of 16% using copper-water nanofluid with a volume percentage of 0.4% and particle size of 40 nm. In 2015, Faizal et al. [8] observed an increase of the collector efficiency up to 23.5% using silicon oxide nanoparticles at a volumetric ratio of 0.2%. They also illustrated the capability of the reduction in power consumption up to 280 MJ. One of the prior researches on the use of nanofluids in heat pipes was published by Chien et al. [9] in 2003. Lu et al. [10] were probably the first to investigate the use of nanofluids in solar collectors with evacuated tubes. The following is an overview of the research on evacuated tube collectors, as illustrated in Table 1.
Table 1. Summary of previous researches on evacuated tube solar collectors used in water heaters
|
Author, Study (Working fluid) |
Type of evacuated tube (ETCS) |
Objective |
Results |
|
Morrison et al. [11]. Experimental and numerical simulation (Water) |
single-ended evacuated tubes |
simulation of flow rate in-glass evacuated tube solar water heater |
good agreement between the experimental observations and the numerical simulation. |
|
Hayek et al. [12]. Numerical simulation (Water) |
single-ended evacuated tubes |
Investigation of evacuate tube solar collector using CFD analysis |
The performance of the collector improves with the change of pipe connection to the tank. |
|
Ayala et al. [13]. Numerical simulation (Water) |
solar collector consists of 36 evacuated tubes |
Numerical study of a low temperature water-in-glass evacuated tube solar collector |
BA model estimate is a stronger model for simulating a low temperature evacuated tube filled with glass water. |
|
Ghaderian et al. [14]. Experimental (Copper Oxide-Water) |
single-ended evacuated tubes |
Performance of copper oxide/ distilled water nanofluid in ETSC water heater with internal coil under thermosyphon system circulations |
The solar collector with water nanofluid - copper oxide at concentrations of 3% and 6% increases nanofluid efficiency compared to water |
|
Mahendran et al. [15]. Experimental (water-based titanium oxide nanofluid) |
single-ended evacuated tubes |
Performance of evacuated tube solar collector using water-based titanium oxide nanofluid |
The collector efficiency increased by 16/75% compared to pure water. |
|
I.M. Mahbubul et al [16]. Experimental (Carbon nanotube) |
ETCS |
Carbon nanotube nanofluid in enhancing the efficiency of evacuated tube solar collector |
Up to 56.7% and 66% of efficiencies are observed when the collector is operated with water and 0.2 vol.% nanofluid. |
|
Gholamabbas Sadeghi et al. [17]. Experimental and numerical simulation (Cu2O/ distilled water nanofluid) |
ETCS |
performance of evacuated tube solar collectors with parabolic concentrator, applying synthesized Cu2O/distilled water nanofluid |
By 0.08 volume fraction of nanofluid, the energy and exergy efficiency were enhanced 10% and 12.7% |
There have been numerous numerical/experimental researches developed for heat transfer enhancement techniques in energy systems [18-21]. It seems that the available literature needs more support of authentic data in regards to the nanofluids application in thermal efficiency of energy systems including solar collectors [22-27]. In present study, nanofluid (Al2O3) as an operating fluid in a single end evacuated solar collector has been analyzed and evaluations are conducted as numerical simulation using ANSYS Fluent Software.
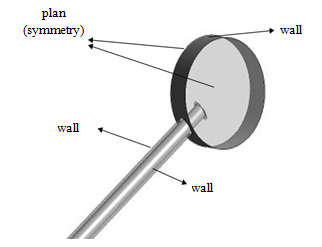
The geometry of the present solar collector has been shown in Figure 1. The collector consists of a cylindrical tank and a glass tube attached to it. The cylindrical tank is insulated. As the sun shines through the glass tube and the temperature changes, resulting in a change in the density of fluid, it causes free movement in the system and fluid rotation. The glass tube portion consists of two glass walls that are vacuumed in space between them to prevent the loss of heat transfer. For validation of our results, we consider the experimental research of solar collector using water as fluid evaluated by Tang et al. [28]. A water solar collector was considered in their study and we will extend their research considering nanofluid as working fluid in the solar collector to investigate the effects of nanofluid heat transfer enhancement. In our analysis, we assume that the nanoparticles are distributed homogeneously in the fluid whereby a single-phase approach model (homogeneous model) is used. Thus, the diameter of the cylindrical tank is considered 30 cm and the inner glass tube is 180 cm long and 43 mm in diameter. The outer diameter of the inner glass tube is 47 mm and the outer diameter of the outer glass tube is 58 mm. The thickness of both glass tubes is 2 mm and the space between them is vacuum.
Figure 1. The geometry and boundary conditions of the solar collector
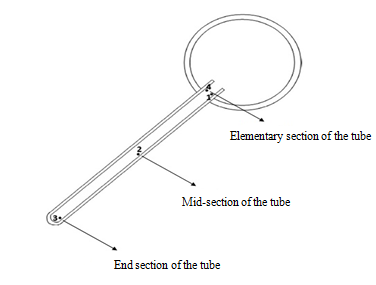
Reservoir walls do not receive any solar energy, and the sun's radiation energy is only transmitted through glass tubes. The walls of the tubes were evaluated in two equal parts, top, and bottom. Tank side is closed and adiabatic. Both glass tubes are identical and have a density of 2230 (kg/m3), a thermal conductivity of 1.14 (W/m.K) and a specific heat capacity of 1200 (J /kg.K). The coefficient of passage of the glass tubes is 0.91 but the inner glass is coated with an absorbent material with an absorption coefficient of 0.907. Our results will be calculated for the case of water in four sections (points) inside collector to compare with the experimental results done by Tang et al. [28]. These points are located 1.5 mm from the inner glass tube wall. Figure 2 shows schematically the location of these points in the solar collector. As seen, the cold water enters the solar collector at point 1, reaching to the end of the tube at point 3 and finally warms up until the point 4.
Figure 2. Position of dots and sections in solar collector
The fluid flow inside the collector is assumed to be single phase. The numerical analysis is performed solved by CFD method using Fluent software. As explained, the results will be investigated for two different working fluids. For validation of our results with pervious experimental works pure water will be considered. In the next step, the effect of nanofluid flow will be evaluated and water-aluminium oxide nanofluids with different concentrations will be analysed. The water properties considered in this study are illustrated in Table 2. The basis of water circulation in the solar collector is the buoyancy effect and natural convection heat transfer. Table1 gives the data on water properties from 10℃ to 90℃. These properties for water will be incorporated in the ANSYS Fluent software for numerical analysis.
Table 2. Water properties at different temperatures
|
T(oC) |
ρ (kg/m3) |
µ (kg/m s) |
Cp (J/kg K) |
k (W/m K) |
|
10 |
999.7 |
0.001307 |
4188 |
0.5674 |
|
20 |
998.2 |
0.001002 |
4183 |
0.5861 |
|
30 |
995.7 |
0.0007977 |
4183 |
0.603 |
|
40 |
992.2 |
0.0006533 |
4182 |
0.6178 |
|
50 |
988 |
0.0005471 |
4181 |
0.6305 |
|
60 |
983.2 |
0.0004666 |
4183 |
0.641 |
|
70 |
977.8 |
0.000404 |
4187 |
0.6495 |
|
80 |
971.8 |
0.0003545 |
4194 |
0.6562 |
|
90 |
965.3 |
0.0003145 |
4204 |
0.6613 |
Since the test area and geometry are closed and there is no inlet and outlet discharge, so we define the efficiency for this collector as follows.
$\eta_{t}=\frac{\mathrm{m}_{\mathrm{c}} \cdot \mathrm{C}_{\mathrm{p}} \cdot\left(\mathrm{T}_{\mathrm{tc}}-\mathrm{T}_{\text {initial }}\right)}{\mathrm{A}_{\mathrm{c}} \cdot \int_{0}^{\mathrm{t}} \mathrm{G}_{\mathrm{t}}}$ (1)
In the above relation, mc is the weight of water in the collector which is about 9.5 kg. Cp is the specific heat that is different for pure water with nanofluids. Ttc is the average collector temperature until t. Tinitial The initial test temperature is 23℃. Ac is the area of absorption of the glass tube. Gt is the total radiation at time t, which is the direct and indirect radiation distribution that was shown in the previous sections of their distribution chart throughout the day. Finally, ηt is the collector efficiency. The simulation of nanofluids is performed as a single-phase homogenous fluid. In this study, aluminum oxide nanoparticles (Al2O3) with 1%, 3% and 5% volumetric concentrations are used as working fluid. The numerical solution of this state is solved in single phase and the fluid properties including density, thermal conductivity, specific heat and viscosity are applied for nanofluid properties. First, we define the volume concentration (φ), which is the ratio of the volume of nanoparticles to the total volume of nanofluids obtained by the following equation.
$\varphi=\frac{v_{p}}{v_{p}+v_{f}}$ (2)
In the above relation, vp is the volume of nanoparticles and vf is the volume of fluid. The density value is obtained from the following equation [29].
$\rho_{n f}=\rho_{s} \varphi+\rho_{\mathrm{bf}} *(1-\varphi)$ (3)
The above relation is ρnf nanofluid density, ρs nanoparticle density and ρbf base fluid density. The value of nanofluid thermal conductivity is calculated from [30]:
$k_{\mathrm{nf}}=\mathrm{k}_{\mathrm{bf}}\left[\frac{\mathrm{k}_{\mathrm{s}}+2 \mathrm{k}_{\mathrm{bf}}+2 \varphi\left(\mathrm{k}_{\mathrm{s}}-\mathrm{k}_{\mathrm{bf}}\right)}{\mathrm{k}_{\mathrm{s}}+2 \mathrm{k}_{\mathrm{bf}}-\varphi\left(\mathrm{k}_{\mathrm{s}}-\mathrm{k}_{\mathrm{bf}}\right)}\right]$ (4)
In the above relation knf is the thermal conductivity coefficient of nanofluid, ks the thermal conductivity coefficient of nanoparticles and kbf is the base thermal conductivity coefficient. The specific heat capacity will also be calculated as follows [29]:
$C_{\mathrm{p}_{n f}}=C_{\mathrm{p}_{\mathrm{s}}} \varphi+C_{\mathrm{p}_{\mathrm{bf}}} *(1-\varphi)$ (5)
This is related to the specific heat of the nanofluid, the specific heat of the nanoparticles and the specific heat of the base fluid. The nanofluid viscosity is considered as follows:
$\mu_{n f}=\mu_{\mathrm{bf}}\left[\frac{1}{(1-\varphi)^{2.5}}\right]$ (6)
Following are the fundamental equations of the problem solved numerically. The equation of mass continuity is:
$\frac{\partial \rho}{\partial t}+\nabla \cdot(\rho \vec{v})=S_{m}$ (7)
where, ρ is the density of water, v is the velocity in three directions and Sm is the mass source, which is zero in this study. The momentum equation is considered as:
$\frac{\partial}{\partial x}(\rho \vec{v})+\nabla \cdot(\rho \vec{v} \vec{v})=-\nabla p+\nabla \cdot \vec{\tau}+\rho \vec{g}+\vec{F}$ (8)
where, p is static pressure, τ is the shear stress vector, ρg; the force of gravity and F is the external force as well. The heat transfer is solved by the following energy equation.
$\frac{\partial}{\partial x}(\rho H)+\nabla \cdot(\overrightarrow{\mathrm{v}}(\rho H+p))=-\nabla \cdot(\mathrm{k} \nabla \mathrm{T}+\vec{\tau} \cdot \overrightarrow{\mathrm{v}})+\mathrm{S}_{\mathrm{H}}$ (9)
where, H is energy including enthalpy, potential and kinetic energies, and SH is the source in the energy equation. It is important to note that in the collector pipe section the tetrahedral mesh is considered and the hexahedral mesh is applied in the tank section. The meshing at the pipe connection to the tank has been fine-grained due to the complexity of the geometry. All mesh sections are done by Gambit software. Figure 3 provides an overview of the meshing in the solution domain.
Figure 3. Exterior and inner section of solar collector stamping
The total number of cells used for meshing is about 465,000 cells, of which about 200,000 are hexahedral. ANSYS Fluent 15 software was used for numerical analysis. It is a pressure-based solver and the problem will be transient due to the changes in the angle of the sun during the day (8 am to 5 pm). Fluent software has a program called solar ray tracing that calculates the motion of the sun in terms of geography and local time, and the intensity of the radiation must also be entered by the user. The DO model was used to solve the radiation. The sun should also start at 8 o'clock in the morning. For boundary conditions (as shown in Figure 1), the inner and outer walls of the collector glass tube and the lateral cross-section of the reservoir are considered as wall. For the side walls of the tank, the boundary symmetry condition is used.
For the validation of our results compared with Tang et al. [28] for the case of water as working fluid, the geographical location of the study is considered Yunnan Normal University which is 25.03 degrees north and 102.6 degrees east. The average water temperature in the collector at the beginning is 23℃. The position of the evacuated tube is 46° and the azimuth angle is 9 degrees. The sun's rays emit to the outer tube, where a fraction of these emissions penetrate into the inner glass tube, passing through the vacuum, which is coated with an absorbent coating. The dominant fraction of the rays absorbs this layer and converts to heat flux. This heat flux is transferred to the water inside the collector and causes water to heat. As a result, the natural convection heat transfer will be occurred inside the solar collector to circulate the working fluid. In our simulation, each transient numerical solution, lasted from 8 am to 5 pm for about 6 hours. The diagrams of direct and indirect radiation are presented in Figure 4. It is clear that, the direct radiation means sunlight in clear, cloudless air, and indirect radiation is referred to as sunlight in cloudy weather. The sum of which is equal to the total radiation intensity.
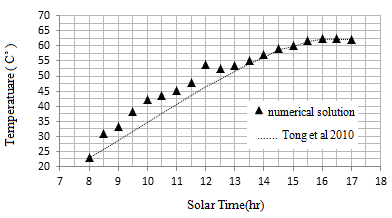
Figure 5 shows the temperature changes at point 1 (refer to Figure 2 for location) throughout the day whereby the numerical results are compared with the experimental results done by Tang et al. [28]. This point is where the water enters the evacuated tube. The 8 o'clock in the morning the temperature is about 23̊ degrees Celsius, which is also the beginning of the modelling process, with the approach of 12 o'clock the temperature gradient increases and the temperature reaches about 45° degrees. After 12 o'clock the slope of the temperature drops but the highest water temperature occurs at 17 o'clock in point 1. In this graph the simulated temperature is compared with the actual temperature from 8 am to 5 pm. The average numerical resolution error is about 3% relative to the experimental values.
Figure 4. Distribution of direct and indirect sunlight during the day [28]
Figure 5. Comparison of actual temperature with numerical simulation temperature at point 1
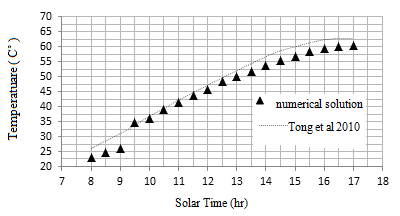
Figure 6 shows the temperature changes at point 2 (see Figure 2) during the day. This point is located in the middle of the vacuum tube downstream. The average CFD numerical solution error is about 4% compared with the experimental results done by Tang et al. [28]. A seen, the slope of temperature drops after 12 o’clock reaching to a constant value after 16.
Figure 6. Comparison of actual temperature with numerical simulation temperature in point 2
Figure 7 shows the temperature changes at point 3 during the day. This point is located at the bottom of the vacuum tube. In this graph the temperature is evaluated from 8 to 17 o'clock. The average numerical resolution error is about 7% relative to the previous experimental data. Increasing the percentage of error in numerical simulation over experimental measurements at point 3 can be explained for several reasons. This location is placed at the end of the tube and due to the decrease in the fluid velocity and reverse direction of the fluid, the pressure increases and the percentage of error could be increased.
Figure 7. Comparison of actual temperature with numerical simulation temperature at point 3
Figure 8 shows the temperature changes at point 4 throughout the day and the numerical solution results are compared with the experimental results done by Tang et al. [28]. In this graph the simulated temperature is compared with the experimental temperature from 8 to 17 o'clock. The average numerical resolution error is about 5.3% relative to the actual values. As seen, the temperature increases by the parameter of time reaching to its maximum value at 5pm.
Figure 8. Comparison of actual temperature with numerical simulation temperature at point 4
Figure 9 shows the average total water temperature in the vacuum tube and collector during the day. As it turns out, water starts to warm up to 23 degrees Celsius and rises steeply up to about 17:00 (5: 00p.m).
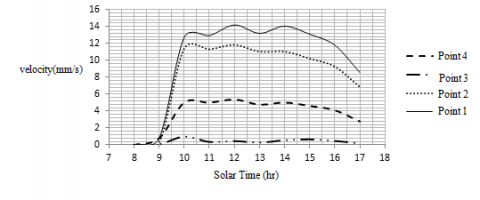
In addition, the velocity at these points is obtained by numerical solution for the case of water flow. The comparison of velocities at four points during the day is given in Figure 10. In each of the four sections (points), the velocity reaches its maximum value from zero at about 10 to 12 o’clock. This increment can be seen to be higher for the points 1 and 2. The reason for the increase of velocity for all points would be the warming of water and the heat exchange from hot and cold fluids by natural convection heat transfer. The buoyancy effect can move the working fluid inside the solar collector forward leading to the fluid flow circulation. The fluid velocity at point 1 and 2 is higher than at other points due to the slope of the pipe and the predominance of gravity. At point 3, as mentioned in the preceding section, the velocity decreases sharply due to the change in the direction of fluid flow. The point 3 can act as stagnation point reaching to the higher pressure at the end of the tube. Point 4 is the point where hot fluid enters the reservoir, which also slows down due to fluid entering a larger cross section.
Figure 9. Average water temperature during the day
Figure 10. Velocity variation at different points throughout the day
Velocity distribution in the middle section of vacuum tube at 11 am is illustrated in Figure 11. As shown in this figure, the velocity inside the tank is negligible but there are two zones at the top and bottom of the tube section with high velocity fields. The temperature difference between the cold and hot areas leads the fluid moves by natural convective heat transfer with an increased velocity profile. Consequently, around the upper and lower walls of the collector tube, there is a narrower layer of higher velocity fluid that moves along the tube and away from the storage tank.
Figure 11. Velocity distribution in the middle section of vacuum tube at 11 am
For further study, the vectors are shown in Figure 12. As shown, a circulation is placed at the junction of the vacuum tube and the storage tank, due to the shift between hot and cold fluid. The slow movement of the cold fluid from the bottom of the reservoir to the open mouth of the pipe and the lower half of the pipe while the hot fluid enters the upper half of the pipe and its movement in the upper part of the reservoir causes this rotational flow. The buoyancy phenomenon related to the convection heat transfer is caused by the difference in density between the cold and hot fluid, which results in the hot fluid with lower density at the top and the cold fluid with higher density at the bottom of the tube.
Figure 12. Show motion vectors in the mid-section of the collector and vacuum tube at 11 am
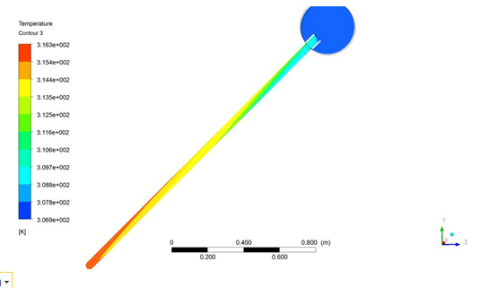
In Figure 13, the distribution of temperature is shown in the middle section of the tube. It is obvious that by moving the fluid toward the closed end of the vacuum tube, the temperature increases as it receives more solar energy reaching to the highest fluid temperature at the end of the tube. The reason is due to the lowest fluid velocity at the end of the tube leading to the highest pressure and temperature distribution. However, at the end of the pipe, due to the steep slope of the collector tube and the slow upward flow of fluid flow, a low velocity volume appears which has a negative effect on the collector performance. This negative effect can increase the thermal losses of the solar collector, which can be reduced by modifying the slope of the collector.
Figure 13. Temperature distribution in the middle section of collector and vacuum tube at 11 am
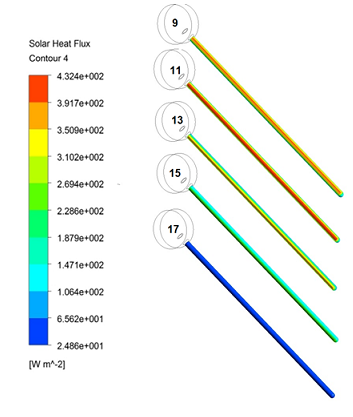
Figure 14 shows the distribution of solar heat flux absorbed by the inner glass tube at different times of the day. As seen, the intensity of radiation at 11 o’clock is considered highest among other hours. It is also shown that as time passes and the sun moves in the sky, the maximum absorbed heat flux is at the top of the tube at about 9 pm. As time passes and the sun rotates, the absorbed flux gradually moves down the tube, and as it approaches 17 o'clock, the absorbed heat flux decreases.
Figure 14. Distribution of heat flux absorbed by inner tube during the day
In Figure 15 the velocity distribution in the mid-section of the solar collector at 9, 11, 13, 15 and 17 is compared. As seen at 9 am, the fluid velocity in the solar collector is much slower than other hours due to the low solar radiation energy leading to minimum absorption of energy. As a result, the natural convection heat transfer is decreased and the velocity fields drops. As the sun rises and the angle of inclination of the sun shines at 13 o'clock, the velocity in the tube increases, and this increment continues until 15 o'clock. By observing the velocity distribution inside the tube, especially near the upper and lower wall of the tube, this figure indicates that with increasing daylight hours again, the fluid velocity slowly decreased about 17 o’clock. In general, the velocity in the tube depends on the intensity of the radiation during the day, which is maximum during the hours 11-14.
Figure 15. Distribution of velocity at mid-day collector
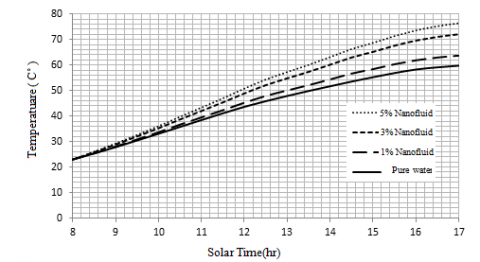
By calculating the properties of the nanofluids according to the previous section and inserting them into the fluent software, we perform the simulation for nanofluid flow and heat transfer case. Figure 16 shows the average daily water collector temperature for pure water and three aluminium oxide nanofluid models with different particle concentration. This figure indicates that an increase of nanofluid volume particle concentration tends to increase the temperature distribution. It is seen that the temperature of the pure water inside the collector starts to rise with a gentle slope, with the highest temperature in the range of 16 to 17 hr. The performance temperature of the nanofluid collector increased with the volumes mentioned above with a steeper slope and the higher the concentration of nanofluid, the faster the collector reached the higher temperature.
Figure 16. Comparison of mean water temperature distribution for pure water and nanofluid
Figure 17 illustrates the velocity contours in a tube collector for pure water and nanofluid at concentrations of 1%, 3% and 5%. Comparing the velocity distribution in the collector midrange at 11am, it indicates that the fluid velocity for the nanofluid increases with increasing particle concentration resulting in an increase in density.
Figure 17. Velocity distribution for pure water and nanofluids at 11am
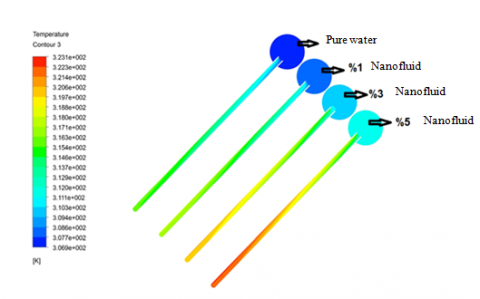
In Figure 18 the temperature distribution at 11 am in the middle of the collector for water and three nanofluids is shown. It is seen for all cases that the fluid flow in the lower half of the tube is higher and the higher temperature is occurred at the end of the tube which is closed. This is because of the lower rotational velocity of the fluid that results in absorbing more energy because of the stagnation point and highest pressure at the end of the tube. As seen, the nanofluids with higher particle concentration are able to increase temperature distribution inside the solar collector. As observed, the upper side of the collector has the highest temperature distribution in all cases since the velocity of the working fluid drops at the top side of the collector leading a high temperature distribution.
Figure 18. Temperature distribution for pure water and nanofluid at 11 am
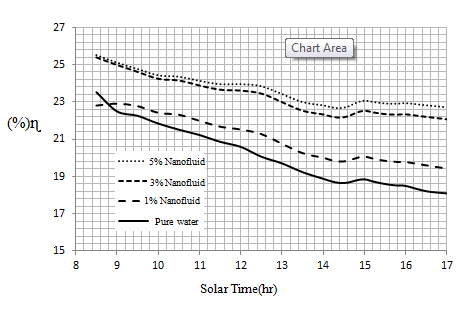
In Figure 19, the efficiency of evacuated tube solar collector is illustrated for different working fluids. It is seen that as the time increases the efficiency decreases. This reduction would be significant for the case of pure water. It is interesting to note that the nanofluids with higher particle concentration show higher stability of solar collector efficiency during the day. The graphs tend to be horizontal specifically for nanofluid flow with highest particle concentration. It also concluded that an increase in particle concentration of nanofluid shows an increase in collector efficiency.
Figure 19. Collector efficiency for pure water and nanofluids throughout the day
It is This paper investigates the velocity and temperature distribution in the evacuated solar collector numerically using ANSYS Fluent software considering pure water and nanofluids (Al2O3). The results were compared with the previous experimental researches and show good agreement. The results indicate that as the nanoparticle concentration increases, the fluid temperature in the collector increases. As the concentration of nanoparticles increases, collector efficiency also increases. It is concluded that solar collectors using Al2O3 with higher particle concentration tends the collector efficiency to be more stable during the day.
[1] Smil, V. (2005). Energy at the Crossroads: Global Perspectives and Uncertainties. MIT Press.
[2] Pasad, D. (2005). Solar Power. The Images Publishing Group Pty Ltd & Earthscan USA.
[3] Muhammad, M.J., Muhammad, I.A., Sidik, N.A., Yazid M.N. (2016). Thermal performance enhancement of flat-plate and evacuated tube solar collectors using nanofluid: a review. International Communications in Heat and Mass Transfer, 76: 6-15. https://doi.org/10.1016/j.icheatmasstransfer.2016.05.009
[4] Yousefi, T., Shojaeizadeh, E., Veysi, F., Zinadini, S. (2012). An experimental investigation on the effect of pH variation of MWCNT–H2O nanofluid on the efficiency of a flat-plate solar collector. Solar Energy, 86(2): 771-9. https://doi.org/10.1016/j.solener.2011.12.003
[5] Yousefi, T., Veisi, F., Shojaeizadeh, E., Zinadini, S. (2012). An experimental investigation on the effect of MWCNT-H2O nanofluid on the efficiency of flat-plate solar collectors. Experimental Thermal and Fluid Science, 39: 207-12. https://doi.org/10.1016/j.expthermflusci.2012.01.025
[6] Yousefi, T., Veysi, F., Shojaeizadeh, E., Zinadini, S. (2012). An experimental investigation on the effect of Al2O3–H2O nanofluid on the efficiency of flat-plate solar collectors. Renewable Energy, 39(1): 293-8. https://doi.org/10.1016/j.renene.2011.08.056
[7] Moghadam, A.J., Farzane-Gord, M., Sajadi, M., Hoseyn-Zadeh, M. (2014). Effects of CuO/water nanofluid on the efficiency of a flat-plate solar collector. Experimental Thermal and Fluid Science, 58: 9-14. https://doi.org/10.1016/j.expthermflusci.2014.06.014
[8] Faizal, M., Saidur, R., Mekhilef, S., Hepbasli, A., Mahbubul, I.M. (2015). Energy, economic, and environmental analysis of a flat-plate solar collector operated with SiO2 nanofluid. Clean Technologies and Environmental Policy, 17(6): 1457-73. http://dx.doi.org/10.1007/s10098-014-0870-0
[9] Chien, H.T., Tsai, C.I., Chen, P.H., Chen, P.Y. (2003). Improvement on thermal performance of a disk-shaped miniature heat pipe with nanofluid. In Fifth International Conference on Electronic Packaging Technology Proceedings. ICEPT2003. Oct 28 (pp. 389-391). IEEE, pp. 389-391. https://doi.org/10.1109/EPTC.2003.1298767
[10] Lu, L., Liu, Z.H., Xiao, H.S. (2011). Thermal performance of an open thermosyphon using nanofluids for high-temperature evacuated tubular solar collectors: Part 1: Indoor experiment. Solar Energy, 85(2): 379-87. https://doi.org/10.1016/j.solener.2010.11.008
[11] Morrison, G.L., Budihardjo, I., Behnia, M. (2005). Measurement and simulation of flow rate in a water-in-glass evacuated tube solar water heater. Solar Energy, 78(2): 257-67. https://doi.org/10.1016/j.solener.2004.09.005
[12] Hayek, M. (2009). Investigation of evacuated-tube solar collectors performance using computational fluid dynamics. IEEE International Conference on Advances in Computational Tools for Engineering Applications, pp. 240-244. https://doi.org/10.1109/ACTEA.2009.5227901
[13] Alfaro-Ayala, J.A., Martínez-Rodríguez, G., Picón-Núñez, M., Uribe-Ramírez, A.R., Gallegos-Muñoz, A. (2015). Numerical study of a low temperature water-in-glass evacuated tube solar collector. Energy Conversion and Management, 94: 472-81. https://doi.org/10.1016/j.enconman.2015.01.091
[14] Ghaderian, J., Sidik, N.A., Kasaeian, A., Ghaderian, S., Okhovat, A., Pakzadeh, A., Samion, S., Yahya, W.J. (2017). Performance of copper oxide/distilled water nanofluid in evacuated tube solar collector (ETSC) water heater with internal coil under thermosyphon system circulations. Applied Thermal Engineering, 121: 520-36. http://dx.doi.org/10.1016/j.applthermaleng.2017.04.117
[15] Mahendran, M., Lee, G.C., Sharma, K.V., Shahrani, A., Bakar, R.A. (2012). Performance of evacuated tube solar collector using water-based titanium oxide nanofluid. Journal of Mechanical Engineering and Sciences, 3: 301-10. http://dx.doi.org/10.15282/jmes.3.2012.6.0028
[16] Mahbubul, I.M., Khan, M.M., Ibrahim, N.I., Ali, H.M., Al-Sulaiman, F.A., Saidur, R.J. (2018). Carbon nanotube nanofluid in enhancing the efficiency of evacuated tube solar collector. Renewable Energy, 121: 36-44. https://doi.org/10.1016/j.renene.2018.01.006
[17] Sadeghi, G., Safarzadeh, H., Ameri, M. (2019). Experimental and numerical investigations on performance of evacuated tube solar collectors with parabolic concentrator, applying synthesized Cu2O/distilled water nanofluid. Energy for Sustainable Development, 48: 88-106. https://doi.org/10.1016/j.esd.2018.10.008
[18] Abed, A.M., Alghoul, M.A., Yazdi, M.H., Al-Shamani, A.N., Sopian, K. (2014). The role of enhancement techniques on heat and mass transfer characteristics of shell and tube spray evaporator: A detailed review. Applied Thermal Engineering, 75: 923-940. https://doi.org/10.1016/j.applthermaleng.2014.10.020
[19] Yazdi, M.H., Abdullah, S., Hashim, I., Sopian, K. (2011). Effects of viscous dissipation on the slip MHD flow and heat transfer past a permeable surface with convective boundary conditions. Energies, 4(12). https://doi.org/10.3390/en4122273
[20] Yazdi, M.H., Abdullah, S., Hashim, I., Sopian, K. (2013). Reducing entropy generation in MHD fluid flow over open parallel microchannels embedded in a micropatterned permeable surface. Entropy, 15(11). https://doi.org/10.3390/e15114822
[21] Yazdi, M.H., Abdullah, S., Hashim, I., Sopian, K. (2011). Slip MHD liquid flow and heat transfer over non-linear permeable stretching surface with chemical reaction. International Journal of Heat and Mass Transfer, 54(15-16): 3214-3225. https://doi.org/10.1016/j.ijheatmasstransfer.2011.04.009
[22] Al-Shamani, A.N., Yazdi, M.H., Alghoul, M.A., Abed, A.M., Ruslan, M.H., Mat, S., Sopian, K. (2014). Nanofluids for improved efficiency in cooling solar collectors – A review. Renew. Sustain. Energy Rev., 38: 348-367. https://doi.org/10.1016/j. rser.2014.05.041
[23] Fudholi, A., Sopian, K., Yazdi, M.H., Ruslan, M.H., Ibrahim, A., Kazem, H.A. (2014). Performance analysis of photovoltaic thermal (PVT) water collectors. Energy Conversion and Management, 78: 641-651. https://doi.org/10.1016/j.enconman.2013.11.017
[24] Alsabery, A.I., Yazdi, M.H., Altawallbeh, A., Hashim, I. (2019). Effects of nonhomogeneous nanofluid model on convective heat transfer in partially heated square cavity with conducting solid block. Journal of Thermal Analysis and Calorimetry, 136: 1489-1514. https://doi.org/10.1007/s10973-018-7789-3
[25] Rukman, N.S., Fudholi, A., Utari P.A., Aisyah, C.N., Purwanto A.J., Pramana, R.I., Martides, E., Kristi, A., Asim, N., Yazdi, M.H., Moria, H., Abdulrasool H.H., Darwish, Z.A. (2021). Bi-fluid cooling effect on electrical characteristics of flexible photovoltaic panel. Journal of Mechatronics, Electrical Power, and Vehicular Technology, 12: 51-56. https://dx.doi.org/10.14203/j.mev.2021.v12.51-56
[26] Mohamadi, S., Yazdi, M.H., Solomin, E., Fudholi, A., Sopian, K., Chong, P.L. (2021). Heat transfer and entropy generation analysis of internal flow of nano refrigerant with slip condition at wall. Thermal Science and Engineering Progress, 22: 100829. https://doi.org/10.1016/j.tsep.2020.100829
[27] Fudholi, A., Razali, N.F.M., Yazdi, M.H., Ibrahim, A., Ruslan, M.H., Othman M.Y., Sopian, K. (2019). TiO2/water-based photovoltaic thermal (PVT) collector: Novel theoretical approach, Energy, 183: 305-314. https://doi.org/10.1016/j.energy.2019.06.143
[28] Tang. R., Yang, Y., Gao, W. (2011). Comparative studies on thermal performance of water-in-glass evacuated tube solar water heaters with different collector tilt-angles. Solar Energy, 85(7):1381-9. https://doi.org/10.1016/j.solener.2011.03.019
[29] Vajjha, R.S., Das, D.K. (2008). Measurements of specific heat and density of Al2O3 Nanofluid. AIP Conference Proceedings, 1063: 361. https://doi.org/10.1063/1.3027181
[30] Sundar, L.S., Ramana, E.V., Singh, M.K., Sousa, A.C. (2014). Thermal conductivity and viscosity of stabilized ethylene glycol and water mixture Al2O3 nanofluids for heat transfer applications: An experimental study. International Communications in Heat and Mass Transfer, 56: 86-95. https://doi.org/10.1016/j.icheatmasstransfer.2014.06.009