Junjie Ba | Shuiyun Tu* | Qingyu Zhang | Chunlei Tang
© 2020 IIETA. This article is published by IIETA and is licensed under the CC BY 4.0 license (http://creativecommons.org/licenses/by/4.0/).
OPEN ACCESS
Ruidian geothermal field is a treasure trove of geothermal resources in Southwest China. This paper probes deep into the hydro-chemical features and isotopic features of geothermal fluids in the geothermal field, and discusses the evolution of the hydro-chemical features. The main results are as follows: the geothermal fluids were recharged by the same source, and mixed with cold water through a simple process, that is, the fluids originated from the same high-temperature deep reservoir. The leading hydro-chemical features in Ruidian geothermal field are HCO3·Cl-Na. The Cl- content peaked at 200mg/L, and the $\delta$18O drifted positively by 1.5% to 2.5%. The water-rock interaction in the geothermal fluids is not in the equilibrium state. A good portion of the fluids is surface water. To a certain extent, the underground geothermal fluids have an open circulation condition. The hydro-chemical components mainly come from granite dissolution, the alteration of the magma and hydrothermal fluid, and the mixing with groundwater.
geothermal field, hydro-chemical features isotopic features, water-rock interaction
In 2017, China released the plan for the development and utilization of geothermal energy in 2016-2020, kicking off a new round of research into geothermal exploitation. As an abundant renewable resource, geothermal energy can be utilized efficiently with a low cost and limited emissions. The utilization efficiency of geothermal energy is 5.4 times that of solar power and 3.6 times that of wind power [1-3]. About 84.1% of China’s geothermal resource concentrates in the southwest (e.g. South Tibet, West Sichuan, and West Yunnan), which has the potential to generate 7.12 million kW of electricity. Southwest China has 139 geothermal fields hotter than 150°C, 35.3% (49) of them are in West Yunnan [4-6].
The geothermal fields in Tengchong, a city in West Yunnan, have long been a research hotspot. The earliest research into these geothermal fields can be traced back to 1639, when geographer Xu Xiake recorded the geothermal fluids around Tengchong, as well as the distribution, temperatures, and activities of nearby hot springs [7]. The geothermal system around Tengchong has largely been stable, for the geothermal activity remains almost the same as several centuries ago [8].
Based on the data collected by previous researchers, this paper examines the hydro-chemical and isotopic features of the hot springs in Ruidian geothermal field, Tengchong, and discusses the evolution of the hydro-chemical features. The research results help to model the thermogenesis of similar geothermal fields in Southwest China.
Located 50km to the north of Tenghchong, Ruidian geothermal field (E: 98°23’-98°30’; N: 25°22’-25°30’) is a typical heat source constrained by magma chambers in the geothermal resource belt of Southwest China. The thermogenesis of the geothermal field depends on the distribution of deep fault zone and magma chambers. The geothermal field was generated in the same era as Dayingjiang Fault and Longchuanjiang Fault [9-12].
Geographically, Ruidian geothermal field lies in the north of Tengchong synclinorium, which is part of the Tengchong fold belt in the Gaoligong Mountains. The synclinorium mainly contains magmatic rocks and granites. The residual upper Paleozoic strata is distributed between acid intrusive rocks. Part of the northern area of the synclinorium is covered by tertiary and quaternary intermediate-basic extrusive rocks and volcanic vents.
Ruidian is a north-south trending basin amidst decent-sized mountains. The Xishahe River flows from north to south across the basin into the Longchuan River. The geologic structure of the basin (Figure 1) controls the the stratigraphic distribution, tectonic lines, and hydrothermal activity of Ruidian geothermal field.
The terrestrial heat flow in Tengchong-Ruidian belt peaks at 120.5mW/m2, twice the global average (61.6mW/m2) [2, 7, 11]. The geothermal gradient averages at 4.61°C/100m, higher than anywhere else in Yunnan province [13, 14]. Furthermore, the geothermal gradient in wellbores can reach 30°C/100m, an evidence of obvious geothermal anomaly [11].
As shown in Figure 1, geothermal manifestations are clustered in the 1.70km × 1.05km Axinjie-Dagoubian zone. In total, Ruidian geothermal field has 39 hot springs (spring groups), where the temperature could be as high as 91.5°C. The structure of geothermal reservoir can be divided into a high-temperature deep layer of weathered granite and a shallow layer of Lower Pleistocene gravel and pebble.
(a)
(b)
Figure 1. (a) Location and (b) Hydrogeological map of Ruidian geothermal field
Drawing on the relevant literature [12-14], 35 samples were collected from the hot springs in Ruidian geothermal field during June-December 2016, and subjected to hydro-chemical analysis. As shown in Tables 1 and 2, the geothermal fluids in the field have relatively simple hydro-chemical features: the primary component is HCO3·Cl-Na. The Cl- content and SiO2 content peaked at 200 and 251.8 mg/L, respectively.
Taking sample W1 for example, the primary anion and cation are HCO3- (948.35mg/L) and Na+ (400mg/L), respectively; the secondary anion and cation are Cl- (153.1mg/L) and Ca2+ (26.8mg/L), respectively. The pH values of all the samples fell in the range of 6.4-8.2.
Table 1. Hydro-chemical features of geothermal fluids in Ruidian geothermal field
|
No. |
T (°C) |
Na+ |
K+ |
Mg2+ |
Ca2+ |
Cl- |
SO42- |
HCO3- |
|
mg/L |
mg/L |
mg/L |
mg/L |
mg/L |
mg/L |
mg/L |
||
|
W1 |
91.5 |
400.0 |
37.0 |
3.6 |
26.8 |
153.1 |
18.0 |
948.4 |
|
W2 |
85.0 |
375.0 |
35.5 |
4.0 |
32.5 |
144.6 |
16.0 |
929.0 |
|
W3 |
75.0 |
325.0 |
31.5 |
3.1 |
23.8 |
128.9 |
15.0 |
790.8 |
|
W4 |
74.0 |
340.0 |
30.0 |
3.8 |
28.6 |
138.9 |
16.0 |
799.7 |
|
W5 |
57.0 |
230.0 |
23.0 |
2.7 |
15.2 |
91.6 |
14.0 |
535.1 |
|
W9 |
72.0 |
375.0 |
37.5 |
3.9 |
24.9 |
151.2 |
24.0 |
911.5 |
|
W15 |
91.0 |
385.0 |
38.5 |
3.7 |
24.5 |
155.2 |
16.0 |
942.0 |
|
B-ZY1 |
87.0 |
387.0 |
40.0 |
3.5 |
24.6 |
158.6 |
17.0 |
935.0 |
|
B-LX |
75.6 |
345.0 |
33.8 |
3.5 |
21.8 |
132.7 |
24.0 |
780.3 |
|
B-JZ |
77.0 |
378.0 |
35.4 |
3.8 |
25.7 |
159.3 |
22.0 |
819.7 |
|
W16 |
53.0 |
290.5 |
44.0 |
8.4 |
6.3 |
147.6 |
30.0 |
559.6 |
|
W16-1 |
60.8 |
355.0 |
31.5 |
1.4 |
12.6 |
133.6 |
30.0 |
778.0 |
|
W17 |
58.5 |
350.0 |
31.5 |
2.1 |
16.1 |
144.9 |
20.0 |
766.6 |
|
ZK14 |
67.3 |
390.0 |
41.0 |
4.1 |
30.0 |
152.1 |
30.0 |
972.5 |
|
T-W1 |
86.5 |
400.0 |
42.0 |
3.6 |
23.6 |
157.0 |
16.0 |
912.0 |
|
T-W2 |
87.0 |
410.0 |
45.0 |
4.2 |
4.5 |
140.0 |
31.2 |
895.0 |
|
T-W3 |
77.0 |
350.0 |
34.0 |
3.3 |
22.2 |
139.0 |
32.0 |
775.0 |
|
T-W4 |
81.0 |
400.0 |
36.0 |
3.7 |
23.6 |
164.0 |
24.0 |
837.0 |
|
T-W5 |
56.0 |
245.0 |
28.5 |
3.3 |
7.5 |
76.9 |
14.6 |
520.0 |
|
T-W17 |
64.0 |
378.0 |
36.6 |
2.5 |
7.5 |
133.0 |
25.0 |
768.0 |
|
Z-JM |
79.3 |
154.0 |
39.2 |
6.5 |
4.9 |
181.0 |
31.8 |
927.0 |
|
Z-GX |
74.9 |
165.0 |
42.9 |
6.3 |
4.9 |
200.0 |
34.5 |
939.0 |
|
G-XL |
90.0 |
326.0 |
30.8 |
2.0 |
15.5 |
130.9 |
27.3 |
928.0 |
|
G-JY |
86.0 |
290.1 |
29.2 |
2.0 |
20.4 |
117.6 |
25.2 |
906.2 |
|
G-XR |
75.0 |
250.2 |
26.6 |
1.7 |
17.7 |
105.0 |
25.5 |
752.7 |
|
G-ZY |
85.0 |
320.2 |
33.9 |
2.1 |
21.6 |
119.1 |
27.1 |
902.2 |
|
L-LX |
73.2 |
193.5 |
27.5 |
2.7 |
24.7 |
132.2 |
13.0 |
869.5 |
|
L-XX |
68.7 |
272.8 |
34.6 |
2.3 |
12.5 |
108.7 |
13.8 |
880.3 |
|
L-SP |
62.0 |
278.5 |
35.6 |
2.6 |
17.6 |
125.5 |
19.0 |
904.6 |
|
L-ZY |
61.6 |
391.9 |
83.9 |
4.1 |
25.8 |
165.8 |
28.2 |
1016.0 |
|
L-GX |
72.2 |
388.0 |
76.0 |
3.6 |
17.6 |
166.4 |
28.4 |
1012.9 |
|
L-JZ |
80.0 |
372.1 |
75.1 |
3.6 |
28.0 |
156.1 |
26.8 |
991.6 |
|
L-JM |
58.3 |
383.1 |
75.4 |
3.6 |
27.5 |
161.6 |
27.8 |
1006.8 |
|
B-GX |
73.5 |
421.0 |
44.0 |
3.8 |
21.0 |
164.0 |
28.0 |
983.0 |
|
B-ZY |
82.1 |
390.0 |
43.0 |
4.0 |
25.0 |
154.0 |
27.0 |
938.0 |
Table 2. Hydro-chemical features of geothermal fluids in Ruidian geothermal field (continued)
|
No. |
pH |
SiO2 |
F- |
HBO2- |
Li |
Rb |
Cs |
|
mg/L |
mg/L |
mg/L |
mg/L |
mg/L |
mg/L |
||
|
W1 |
7.3 |
134.0 |
5.2 |
17.0 |
|
|
|
|
W2 |
7.1 |
116.0 |
5.6 |
16.5 |
|
|
|
|
W3 |
6.8 |
108.0 |
5.0 |
13.5 |
|
|
|
|
W4 |
6.9 |
130.0 |
5.0 |
15.5 |
|
|
|
|
W5 |
6.5 |
96.0 |
3.4 |
8.0 |
|
|
|
|
W9 |
7.2 |
130.0 |
4.8 |
19.0 |
|
|
|
|
W15 |
8.2 |
150.0 |
4.8 |
20.0 |
|
|
|
|
B-ZY1 |
7.4 |
145.0 |
6.7 |
|
|
|
|
|
B-LX |
7.0 |
|
5.9 |
|
|
|
|
|
B-JZ |
7.0 |
|
6.2 |
|
|
|
|
|
W16 |
7.2 |
120.0 |
|
25.2 |
|
|
|
|
W16-1 |
7.7 |
140.0 |
|
15.0 |
|
|
|
|
W17 |
7.3 |
125.0 |
|
17.0 |
|
|
|
|
ZK14 |
7.2 |
130.0 |
|
23.0 |
|
|
|
|
T-W1 |
7.5 |
148.0 |
|
16.0 |
2.10 |
0.330 |
0.440 |
|
T-W2 |
7.5 |
129.0 |
|
11.6 |
2.20 |
0.470 |
0.710 |
|
T-W3 |
7.2 |
123.0 |
|
13.0 |
1.80 |
0.310 |
0.440 |
|
T-W4 |
7.5 |
140.0 |
|
13.0 |
2.10 |
0.330 |
0.520 |
|
T-W5 |
6.0 |
104.0 |
|
6.8 |
1.29 |
0.250 |
0.560 |
|
T-W17 |
8.1 |
126.0 |
|
15.1 |
1.85 |
0.360 |
0.720 |
|
Z-JM |
8.2 |
160.0 |
15.6 |
|
|
0.235 |
0.401 |
|
Z-GX |
8.5 |
180.0 |
17.3 |
|
|
0.261 |
0.415 |
|
G-XL |
7.6 |
251.8 |
|
|
1.51 |
0.275 |
0.433 |
|
G-JY |
7.0 |
222.6 |
|
|
1.40 |
0.257 |
0.406 |
|
G-XR |
7.5 |
197.1 |
|
|
1.24 |
0.235 |
0.340 |
|
G-ZY |
6.9 |
254.0 |
|
|
1.44 |
0.284 |
0.422 |
|
L-LX |
6.6 |
|
7.0 |
|
|
|
|
|
L-XX |
7.8 |
|
4.0 |
|
|
|
|
|
L-SP |
6.9 |
|
6.9 |
|
|
|
|
|
L-ZY |
6.9 |
|
8.1 |
|
|
|
|
|
L-GX |
7.4 |
|
7.9 |
|
|
|
|
|
L-JZ |
6.6 |
|
7.5 |
|
|
|
|
|
L-JM |
7.2 |
|
7.7 |
|
|
|
|
|
B-GX |
7.5 |
139.0 |
5.0 |
|
|
|
|
|
B-ZY |
6.8 |
128.0 |
5.2 |
|
|
|
|
3.1 Analysis of hydro-chemical features
It is very meaningful to analyze the hydro-chemical features of geothermal fluids. The hydro-chemical features could reflect the degree of water-rock equilibrium, reveal the circulation conditions, and manifest the evolution and distribution patterns of geothermal fluids, laying the basis for modelling the genesis of the geothermal field [15, 16].
Figure 2 presents the Cl-SO4-HCO3 triangulation of some samples. It can be seen that all the underground geothermal fluids thronged in the corner of HCO3-, for the geothermal field exists in the weathered granite layer rich in Ca2+ and HCO3-. Compared with the Cl- content, the high HCO3- content means the geothermal fluids are mixed with peripheral water. Therefore, the geothermal reservoir of Ruidian geothermal field is not a completely closed geothermal system.
Since the samples belong to the area of peripheral water, the hot springs must fall on the edges of the geothermal system, and contain a mixture of underground geothermal fluids and cold water (Figure 2).
Figure 2. Cl-SO4-HCO3 triangulation of some samples
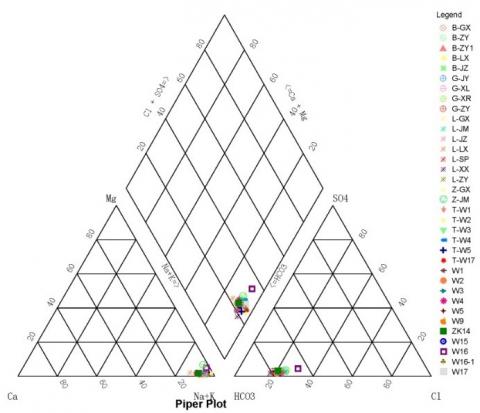
Then, the Piper diagram (Figure 3) of the hydro-chemical features of the hot springs was plotted based on the contents of K+, Na+, Mg2+, Ca2+, Cl-, SO42-, CO3- and HCO3-. Obviously, Na+ and K+ are the main anions, and HCO3- and Cl- are the main cations in the hot springs in Ruidian geothermal field. This means the water-rock interaction is strong in the study area, reducing the runoff and alternating intensity of geothermal fluids. The geothermal system is partly closed, and the hot springs have relatively high temperatures.
Figure 3. Piper diagram of hydro-chemical features of some hot springs
3.2 Further analysis
3.2.1 Water-rock Interaction
In the water-rock equilibrium system, Cl- can neither deposit into inorganic mineral, nor be absorbed to the surface of other minerals under natural conditions. Even if the temperature is high, Cl- will remain as an anion in the underground geothermal fluids. Therefore, Cl- is a good indicator of the source of correlative materials in the geothermal fluids/systems [17].
Here, the correlations between Cl- and other main ions in the samples are analyzed in details. As shown in Figure 4, there is a significant positive correlation between Na+ and Cl- contents (R = 0.96688). It is already known that the r(Na)/r(Cl) value in standard seawater averages at 0.85; if R >0.85, the water must be continental deposit water. It is also known that high Na+ and Cl- contents mean the geothermal fluids have remained for a long time underground before entering the hot springs.
It is learned that the geothermal fluids in Ruidian geothermal field had higher Na+ and Cl- contents than the surface water. Further, the greater-than-one Na+/Cl- ratio indicates that the geothermal fluids are continental deposit water with long-time runoff, deep circulation, and strong water-rock interaction. In addition, the low HCO3- /Cl- ratio (mostly between 4 and 8) (Figure 5) corroborated the long-time runoff, and deep and slow circulation of the geothermal fluids [17].
The Cl- in the geothermal fluids was not from the rocks. There was few rocks and minerals in rich of Cl- on the surface ground of Ruidian area. There was no possibility that the seawater remained in the Cenozoic quaternary strata in Ruidian, Lianghe-Tengchong area. Therefore, the Cl- was from the volatile components generated in the post magmatic stage.
According to the hydrochemical data from the high temperature geothermal field in Axinjie area, the Schoeller fingerprint plots was prepared by AquaChem software (Figure 6). The fingerprint plots of different samples were the similar to each other. It can be concluded from Figure 6 that the hot springs in Axinjie area were under the same generation conditions and shared the same reservoir and recharge source.
Figure 4. Correlation between correlation between Na+ and Cl- contents in geothermal fluids
Figure 5. Relationship between HCO3-/Cl- ratio and Cl- content in geothermal fluids
Figure 6. Schoeller plots of hydrochemistry
3.2.2 Indication meaning of hydro-chemical features
It is generally agreed that, in geothermal fluids, Rb, Cs, B and Li elements come from incipient magma water [18]. However, the B content of our samples were between 4.7 and 6.1mg/L [10, 11]. The contents of Li, Rb and Cs were also relatively high, indicating that the geothermal fluids were mixed with materials from the deep crust. The content of radioactive Rn in the hot springs and in the air were enriched by magma activities.
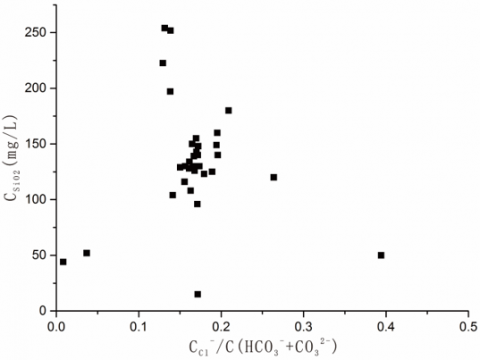
Kearey and Wei [19] concluded that the content ratio of (HCO3-+CO32-)/Cl- in the geothermal fluids is a metric of whether the hot springs are from the same geothermal system. Figure 7 displays the relationship between c(Cl-)/c(HCO3-+CO32-) and c(SO2) in the our samples. It can be seen that the c(Cl-)/c(HCO3-+CO32-) values were smaller than 0.5. Thus, the hot springs share the same geothermal reservoir in Ruidian geothermal field.
Figure 7. Relationship between c(Cl-)/c(HCO3-+CO32-) and c(SO2) in the hot springs
Moreover, whether the hot springs are from the same geothermal system can also be judged by the relationship between Cl- content and the contents of minor components (B, Li, Rb, Cs) in the geothermal fluids. Normally, the Cl- in geothermal fluids is partly resulted from water-rock interaction. If the geothermal system is rather hot, however, most Cl- come from the degassing of magma, and only a negligible portion stems from water-rock interaction. Once generated, the Cl- was neither absorbed into the rocks, nor precipitated as hydrothermal alteration minerals [20, 21]. In Rudian geothermal field, the Cl- content in the geothermal fluids could reach 200mg/L.
The above analysis shows that Cl- is a good indicator of processes like runoff, mixing and circulation. This indicator also facilitates the estimation of the effects on hydro-chemical features in other processes [22, 23]. In our samples, the Cl- content is linearly correlated with Li content and Cs content. Some of the correlation coefficients are shown in Table 3, which indicate that B, Li, Rb, and Cs all come from magma activities.
As shown in Table 3, the Cl- content is clearly correlated with the contents of HBO2, SiO2, Rb, F, and Li. The degree of correlation increases with the c(Cl-). The F and Li contents help to delineate the boundaries and reveal the genesis mechanism of the geothermal field. As shown in Figure 8, the high c(Cl-)/c(F) ratio (24.7) holds evidence to the high-temperature geothermal systems in the study area.
Table 3. Correlation coefficients between Cl- content and the contents of some feature components in the geothermal fluids
|
Correlation coefficient |
Li |
F |
Rb |
Cs |
SiO2 |
HBO2 |
|
R2 |
0.827 |
0.854 |
0.867 |
0.740 |
0.938 |
0.979 |
Figure 8. Relationship between c(Cl-) and c(F) in the hot springs
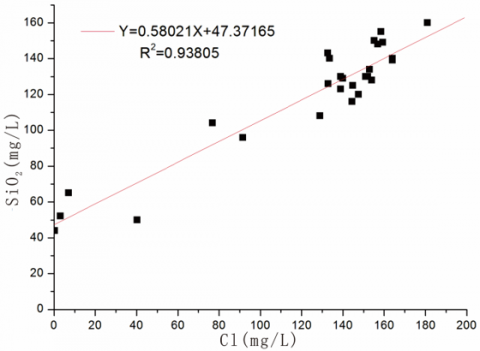
The HBO2 and SiO2 are ubiquitous in the hot springs. Figures 9 and 10 show good correlations between c(Cl-)-c(HBO2) and c(Cl-)-c(SiO2). These correlations can be used to identify the mixing process of cold water. In addition, the high contents of Cl, Li, F and HBO2 in the geothermal fluids testify the presence of high-temperature geothermal systems in the study area
Figure 9. Relationship between c(Cl-) and c(HBO2) in the hot springs
The recharge source of hot springs (e.g. seawater, magma water, or rainfall) can be determined based on the global/local meteoric water line and isotopes of H and O. Moreover, the elevation effect of H-O isotopes is the basis for computing the recharge elevation of hot springs, and modelling the generation mechanism of the geothermal field.
Figure 10. Relationship between c(Cl-) and c(SiO2) in the hot springs
4.1 δ18O shift and water-rock interaction
With elevation effect and temperature effect, δD and δ18O are important indices in the calculation of recharge elevation. For a high-temperature geothermal field, the recharge sources are generally located in remote areas or in the mountains. Therefore, the values of δD and δ18O of such a field tend to be smaller than those of surface water and shallow groundwater.
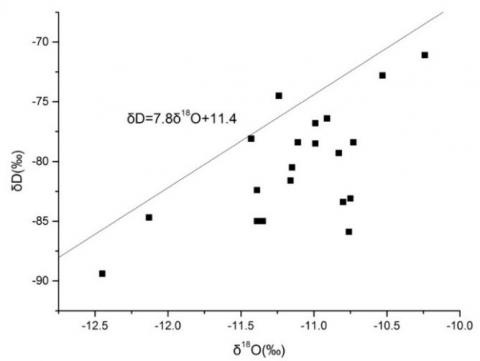
Table 4 compares the δ18O values between the hot springs and meteoric water line. Figure 11 illustrates δD-δ18O relationship of geothermal fluids in the study area. It can be seen that the δ18O value shifted to a certain extent. The common reason for the shift is the water-rock interaction under high temperature. Hence, d-excess=δD-8δ18O was used to calculate the degree of δ18O exchange.
Table 4. The δD-δ18O characteristics in geothermal fluids in the research area
|
Sample number |
Elevation |
δ18O (‰) |
δD (‰) |
|
W1 |
1716 |
-10.91 |
-76.4 |
|
SW1 |
1716 |
-10.99 |
-76.8 |
|
W2 |
1718 |
-11.43 |
-78.1 |
|
TW2 |
1718 |
-11.39 |
-82.4 |
|
W3 |
1718 |
-10.99 |
-78.5 |
|
TW3 |
1718 |
-11.24 |
-74.5 |
|
W4 |
1722 |
-11.11 |
-78.4 |
|
W5 |
1719 |
-10.53 |
-72.8 |
|
TW5 |
1719 |
-10.24 |
-71.1 |
|
W17 |
1720 |
-10.73 |
-78.4 |
|
B-GX |
1716 |
-10.80 |
-83.4 |
|
B-ZY |
1715 |
-11.39 |
-85.0 |
|
B-ZY1 |
1718 |
-11.15 |
-80.5 |
|
B-LX |
1718 |
-10.83 |
-79.3 |
|
B-JZ |
1716 |
-11.16 |
-81.6 |
The δD-δ18O and d-excess diagrams of the geothermal fluids are displayed in Figure 12, where the solid line of d-excess = 10‰ is the global meteoric water line proposed by Craig in 1961 [24, 25], and the dashed lines were d-excess = 20‰ and d-excess = 0‰. It can be seen that the d values of the hot springs mostly fell between the lines of d = 0‰ and d = 10‰ and stayed closer to the d = 10‰ line. The results indicate that the δ18O in the hot springs, which was equal to that of meteoric water, shifted positively by 1.5-2.5%. Therefore, the recharge source of the hot springs is meteoric water with δ18O shift, and the water-rock interaction conditions of the geothermal reservoir is relative open.
Figure 11. The δD-δ18O relationship of the geothermal fluids (solid line [7])
Figure 12. The δD-δ18O and d-excess diagrams of the geothermal fluids
The δ18O shift is common in many high-temperature temperature (T > 205°C) geothermal fields, but rare in low-temperature (T < 205°C) geothermal fields. Craig was the first to discover that the δ18O in different geothermal fluids are away from the global meteoric water line in varied degrees, and attributed the deviation to the interaction between the fluids and reservoir rocks [25]. Truesdell and Hulston collected the δD-δ18O data of many typical high-temperature geothermal fields, and displayed the δ18O shifts in a diagram [26]. The δ18O shifts in the hot springs of the study area are in line with the diagrams in Figure 12, that is, hot geothermal fluids exist in the deep underground of the study area.
The degree of δ18O shift depends on the initial δ18O in the water and rocks, and many other factors, namely, the mineral components and structures of the rocks, the temperature to produce δ18O exchange, the water/rock ratio in the stratum, and the water-rock interaction time. The varied degrees of δ18O shifts in the hot springs reveal that the geothermal fluids differed in vaporization and mixing of cold-water, as they rose from the deep strata to the ground.
In the hot springs, the δ18O and the δD exhibit a linear correlation, owing to the mixing of cold-water into the geothermal fluids. That is, the hot springs are a mixture of the cold water in shallow reservoir stratum and the thermal fluids from the deep stratum. The result agrees with the analysis result of hydro-chemical features.
(1) The main ions are the same in the samples from the hot springs in the study area. The geothermal fluids were generated under the same conditions, and originated in the same geothermal field.
(2) The leading hydro-chemical features in the geothermal fluids are HCO3·Cl-Na. The exposed hot springs share the same high-temperature deep reservoir and recharge source. The hydro-chemical features in the geothermal fluids were significantly affected by magma activities.
(3) The water-rock interaction in the geothermal fluids is not in the equilibrium state. A good portion of the fluids is surface water. To a certain extent, the underground geothermal fluids have an open circulation condition. The mineral and hydro-chemical compositions mainly come from the dissolution of granite, and the alteration of the magma and hydrothermal fluid.
(3) The δ18O in the hot springs, which was equal to that of meteoric water, shifted positively. Thus, the recharge source of the hot springs is meteoric water with δ18O shift, and the water-rock interaction conditions of the geothermal reservoir is relative open. To sum up, the deep stratum in Ruidian has a high-temperature geothermal field, with a huge potential for development.
This research was supported by, the Guangxi Natural Science Foundation (Grant No.: 2018GXNSFAA294046), the National Key Research and Development Program of China (Grant No.: 2018YFC0604301), and the Geological survey project of China (Grant No.: DD20190562).
[1] Barbier, E. (1997). Nature and technology of geothermal energy: A review. Renewable & Sustainable Energy Reviews, (1): 1-69. http://dx.doi.org/10.1016/S1364-0321(97)00001-4
[2] Guo, Q.H. (2012). Hydrogeochemistry of high-temperature geothermal systems in China: A review. Applied Geochemistry, 27(10): 1887-1898. http://dx.doi.org/10.1016/j.apgeochem.2012.07.006
[3] Mongillo, M.A., Axelsson, G. (2010). Preface to geothermics special issue on sustainable geothermal utilization. Geothermics, 39(4): 279-282. http://dx.doi.org/10.1016/j.geothermics.2010.09.011
[4] Guo, Q., Pang, Z., Wang, Y., Tian, J. (2017). Fluid geochemistry and geothermometry applications of the Kangding high-temperature geothermal system in eastern Himalayas. Applied Geochemistry, 81: 63-75. https://doi.org/10.1016/j.apgeochem.2017.03.007
[5] Wang, G.L., Zhang, F.W., Liu, Z.M. (2000). An analysis of present situation and prospects of geothermal energy development and utilization in the world. Acta Geoscientia Sinica, 21(2): 134-139. http://dx.doi.org/10.3321/j.issn:1006-3021.2000.02.004
[6] Guo, S.Y., Li, X.J. (2013). Reservoir stratum characteristics and geothermal resources potential of Rongcheng uplift geothermal field in Baoding, Hebei. Chinese Journal of Geology, 48(3): 922-931. http://dx.doi.org/10.3969/j.issn.0563-5020.2013.03.026
[7] Zhu, M., Tong, W. (1987). Surface hydrothermal minerals and their distribution in the Tengchong geothermal area, China. Geothermics, 16(2): 181-195. http://dx.doi.org/10.1016/0375-6505(87)90065-4
[8] Sevault, A., Soibam, J. (2018). Investigation of an innovative latent heatstorage concept in a stovepipe. Chemical Engineering Transactions, 65: 25-30. http://dx.doi.org/10.3303/CET1865005
[9] Chatterjee, S., Gusyev, M.A., Sinha, U.K., Mohokar, H.V., Dash, A. (2019). Understanding water circulation with tritium tracer in the Tural-Rajwadi geothermal area, India. Applied Geochemistry, 109: 104373. https://doi.org10.1016/j.apgeochem.2019.104373
[10] Jones, B., Peng, X. (2014). Signatures of biologically influenced CaCO3 and Mg-Fe silicate precipitation in hot springs: case study from the Ruidian geothermal area, western Yunnan Province, China. Sedimentology, 61(1): 56-89. http://dx.doi.org/10.1111/sed.12043
[11] Zhang, G., Liu, C.Q., Liu, H., Jin, Z., Han, G., Li, L. (2008). Geochemistry of the Rehai and Ruidian geothermal waters, Yunnan Province, China. Geothermics, 37(1): 73-83. http://dx.doi.org/10.1016/j.geothermics.2007.09.002
[12] Guo, Q., Wang, Y. (2012). Geochemistry of hot springs in the Tengchong hydrothermal areas, Southwestern China. Journal of Volcanology and Geothermal Research, 215: 61-73. http://dx.doi.org/10.1016/j.jvolgeores.2011.12.003
[13] Jiang, Z., Li, P., Tu, J., Wei, D., Zhang, R., Wang, Y., Dai, X. (2018). Arsenic in geothermal systems of Tengchong, China: Potential contamination on freshwater resources. International Biodeterioration & Biodegradation, 128: 28-35. http://dx.doi.org/10.1016/j.ibiod.2016.05.013
[14] Sun, H., Zhang, X., Zhou, L., Shao, X. (2018). Hydration heat and shrinkage of the support of high-performance concrete-filled steel tubes. Chemical Engineering Transactions, 66: 1171-1176. http://dx.doi.org/10.3303/CET1866196
[15] Pirlo, M.C. (2004). Hydrogeochemistry and geothermometry of thermal groundwaters from the Birdsville Track Ridge, Great Artesian Basin, South Australia. Geothermics, 33(6): 743-774. http://dx.doi.org/10.1016/j.geothermics.2004.07.001
[16] Edmunds, W.M. (2004). Bath thermal waters: 400 years in the history of geochemistry and hydrogeology. Geological Society, London, Special Publications, 225(1): 193-199. http://dx.doi.org/10.1144/GSL.SP.2004.225.01.12
[17] Gledhill, D.K., Morse, J.W. (2006). Calcite solubility in Na-Ca-Mg-Cl brines. Chemical Geology, 233(3-4): 249-256. https://doi.org/10.1016/j.chemgeo.2006.03.006
[18] Chandrajith, R., Barth, J.A., Subasinghe, N.D., Merten, D., Dissanayake, C.B. (2013). Geochemical and isotope characterization of geothermal spring waters in Sri Lanka: evidence for steeper than expected geothermal gradients. Journal of Hydrology, 476: 360-369. http://dx.doi.org/10.1016/j.jhydrol.2012.11.04
[19] Kearey, P., Wei, H.B. (1993). Geothermal fields of China. Journal of Volcanology and Geothermal Research, 56(4): 415-428. http://dx.doi.org/10.1016/0377-0273(93)90006-D
[20] Giggenbach, W.F., Sheppard, D.S., Robinson, B.W., Stewart, M.K., Lyon, G.L. (1994). Geochemical structure and position of the Waiotapu geothermal field, New Zealand. Geothermics, 23(5-6): 599-644. http://dx.doi.org/10.1016/0375-6505(94)90022-1
[21] Barragán, R.M., Arellano, V.M., Portugal, E., Sandoval, F. (2005). Isotopic (δ18O, δD) patterns in Los Azufres (Mexico) geothermal fluids related to reservoir exploitation. Geothermics, 34(4): 527-547. http://dx.doi.org/10.1016/j.geothermics.2004.12.006
[22] Hays, P.D., Grossman, E.L. (1991). Oxygen isotopes in meteoric calcite cements as indicators of continental paleoclimate. Geology, 19(5): 441-444. https://doi.org/10.1130/0091-7613(1991)019<0441:OIIMCC>2.3.CO;2
[23] Long, X., Zhang, K., Yuan, R., Zhang, L., Liu, Z. (2019). Hydrogeochemical and isotopic constraints on the pattern of a deep circulation groundwater flow system. Energies, 12(3): 404. ttps://doi.org/10.3390/en12030404
[24] Kim, S.T., O'Neil, J.R. (1997). Equilibrium and nonequilibrium oxygen isotope effects in synthetic carbonates. Geochimica et Cosmochimica Acta, 61(16): 3461-3475. https://doi.org/10.1016/S0016-7037(97)00169-5
[25] Craig, H. (1961). Isotopic variations in meteoric waters. Science, 133(3465): 1702-1703. https://doi.org/10.1126/science.133.3465.1702
[26] Truesdell, A.H., Nathenson, M., Rye, R.O. (1977). The effects of subsurface boiling and dilution on the isotopic compositions of Yellowstone thermal waters. Journal of Geophysical Research, 82(26): 3694-3704. https://doi.org/10.1029/JB082i026p03694