Experimental Heat Transfer and Friction Factor of Fe3O4 Magnetic Nanofluids Flow in a Tube under Laminar Flow at High Prandtl Numbers

Lingala Syam Sundar* | Hailu Misganaw Abebaw | Manoj K. Singh | António M.B. Pereira | António C.M. Sousa
© 2020 IIETA. This article is published by IIETA and is licensed under the CC BY 4.0 license (http://creativecommons.org/licenses/by/4.0/).
OPEN ACCESS
The work is focused on the estimation of convective heat transfer and friction factor of vacuum pump oil/Fe3O4 magnetic nanofluids flow in a tube under laminar flow at high Prandtl numbers experimentally. The thermophysical properties also studied experimentally at different particle concentrations and temperatures. The Fe3O4 nanoparticles were synthesized using the chemical reaction method and characterized using X-ray powder diffraction (XRD) and vibrating sample magnetometer (VSM) techniques. The experiments were conducted at mass flow rate from 0.04 kg/s to 0.208 kg/s, volume concentration from 0.05% to 0.5%, Prandtl numbers from 440 to 2534 and Graetz numbers from 500 to 3000. The results reveal that, the thermal conductivity and viscosity enhancements are 9% and 1.75-times for 0.5 vol. % of nanofluid at a temperature of 60℃, respectively, compared with base fluid data. The heat transfer enhancement is 13.1% and 17.8%, the Nusselt number enhancement is 8.95% and 13.48% for 0.5 vol. % of nanofluid at mass flow rates of 0.0416 kg/s and 0.208 kg/s, respectively, compared with base fluid data with a friction factor penalty of 1.21-times. The correlations of Nusselt number and friction factor were proposed based on the experimental data at high Prandtl numbers.
heat transfer enhancement, friction factor, laminar flow, high Prandtl number, magnetic nanofluid
The research work related to the suspension of particles in a base fluid has been started back in 1975. Ahuja [1, 2] obtained dispersions of 50 $\mu$- and 100 $\mu$- diameter polystyrene spheres in aqueous sodium chloride or glycerin and conducted thermal conductivity and pressure drop measurements in laminar flow. However, the uniform dispersion of micro-suspensions in the base fluids is doubtful. Later on, in 1995, Choi [3] and his team developed nano-meter size particles (called “nanoparticles”) and prepared fluids by dispersing nanoparticles in the base fluid, called as – nanofluids. They conducted thermal conductivity experiments with nanofluids and obtained marked enhancement as compared to base fluid data. After the invention of nanofluids, many researchers have prepared various kinds of nanofluids, but among them, in recent years, magnetic nanofluids are receiving considerable interest due to their many applications. The magnetic nanofluids are prepared by dispersing magnetic nanoparticles in the base fluid. Commonly used magnetic nanoparticles are Fe2O3 (hematite) [4], Fe3O4 (magnetite) [5], Co2O3 (cobalt oxide) [6] and Ni (nickel) [7]. Among those, magnetite (Fe3O4) nanoparticles are having good magnetic properties, when compared with other magnetic nanoparticles. These Fe3O4 based magnetic nanofluids are generally used in biomedical applications such as magnetic cell separation, drug delivery, hyperthermia, and contrast enhancement in magnetic resonance imaging [8-11] and also used in electronic applications, such as audio voice coil-damping, inertia-damping apparatuses and stepped motors, and in mechanical applications, such as bearings, vacuum seals and lubrication [12].
In general, magnetic nanofluids are prepared either in polar based fluids or non-polar based fluids. The polar based fluids are those, which mix with water (e.g., ethylene glycol and propylene glycol). The non-polar based fluids are those, which do not mix water (e.g., kerosene, engine oil and transformer oil). The thermal transport properties and heat transfer of polar based or non-polar based nanofluids are essential, before they used in a particular thermal application. The thermal properties such as, thermal conductivity and viscosity, of polar based magnetic nanofluids are presented as follows. Gavali et al. [13] tested polar (water) based Fe3O4 magnetic nanofluid and observed thermal conductivity enhancement of 200% at 5% volume concentration. Altan et al. [14] used polar (water and heptane) based Fe3O4 magnetic nanofluids and observed thermal conductivity enhancement of 5.2% with weight concentration below of 2% in the presence of external magnetic fields of 0.2 tesla. Abareshi et al. [15] obtained magnetic Fe3O4 nanoparticles using the co-precipitation method for different pH values and prepared polar (water) based Fe3O4 nanofluids using tetra methyl ammonium hydroxide as a dispersant. They observed thermal conductivity enhancement of 11.5% for the nanofluid with 3% volume concentration at 40℃. Li et al. [16] prepared two types of polar based magnetic nanofluids: Fe3O4–water magnetic fluid and Fe-water magnetic fluid. They conducted viscosity and thermal conductivity experiments for volume concentrations of 1.0% to 5.0% and they noted that viscosity varies from 6.14 mPa.s to 9.25 mPa.s when the volume fraction of nanoparticles increases from 2% to 4% for Fe-water nanofluid. The thermal conductivity enhancement is 14.9% for the 5% volume fraction of Fe-water nanofluid as compared to that of the base fluid (water). Sundar et al. [17] prepared a polar (ethylene glycol-water mixture) based Fe3O4 nanofluid for 20:80%, 40:60% and 60:40% by weight ratio of ethylene glycol-water mixture. They observed thermal conductivity enhancement of 46% at 2.0 volume concentration of nanoparticles at a temperature of 60℃. Sundar et al. [18] studied for this nanofluid [17] the effect of volume concentration and temperature on viscosity. The volume concentration was varied between 0% to 1% and the temperature between 0℃ and 50℃. They observed maximum viscosity increase of 2.94-times for the 60:40% ethylene glycol-water mixture based nanofluid at 1% volume concentration.
The thermal properties such as, thermal conductivity and viscosity, of non-polar based magnetic nanofluids are presented as follows. Philip et al. [19] prepared non-polar (kerosene) based Fe3O4 magnetic nanofluids and observed thermal conductivity enhancement of 300% at 6.3% volume concentration. Segal et al. [20] developed a new kind of non-polar (transformer oil) based magnetic nanofluids and they used them for high-voltage insulation. They observed that the use of magnetic nanofluids increases the lightning impulse withstand voltage and it decreases the discharge propagation velocity. Yu et al. [21] obtained Fe3O4 nanoparticles using the phase-transfer method and they prepared non-polar (kerosene) based Fe3O4 magnetic nanofluids using oleic acid as a surfactant. They found thermal conductivity enhancement of 34% with 1% volume concentration. Parekh and Lee [22] prepared non-polar (kerosene) based Fe3O4 magnetic nanofluid and they observed thermal conductivity enhancement of 30% for 4.7% volume concentration under transverse magnetic field. Wang et al. [23] conducted experiments with non-polar (heat transfer oils) based Fe3O4 magnetic nanofluids and they obtained thermal conductivity enhancement of 26.4% at a mass fraction of 4%. Sundar et al. [24] studied the thermal conductivity and viscosity for the non-polar (vacuum pump oil) based Fe3O4 nanofluid for the volume concentration range of 0% to 1.0%. Pop et al. [25] used 7.2 vol. % magnetite in synthetic ester and 7.2 vol. % magnetite in petroleum (non-polar) ferrofluids to study the effect of a magnetic field strength on the viscosity. They indicated that the change of viscosity can be explained as an effect of a chain-like structure formation in ferrofluids, whereas its magnitude depends on the particle–particle interaction.
The heat transfer and friction factor of polar and non-polar based magnetic fluids are presented as follows. Lajvardi et al. [26] prepared polar (water) based Fe3O4 nanofluids and studied the convective heat transfer in the laminar regime in the presence of magnetic field. They observed heat transfer enhancement with the increase of particle volume concentration and of applied magnetic field strength. Xuan and Li [27] used polar (water) based Fe3O4 nanofluids to study heat transfer of nanofluids flowing over a fine wire under the influence of an external uniform magnetic field. They report that the magnetic field has a major influence on the convective heat transfer performance of the magnetic fluids. Sundar et al. [28] conducted heat transfer experiments with polar (water) based nanofluids in the Reynolds number range from 3000 from 22000 and the volume concentration range from 0 to 0.6% and they report for a Reynolds number 22000 and a 0.6% volume concentration, Nusselt number enhancement of 30.96% with a friction factor penalty of 10.01% as compared to water data. The earlier works dealing with heat transfer and friction factor of polar (water) based magnetic nanofluids.
However, the thermal properties, heat transfer and friction factor of non-polar based magnetic nanofluids are not available. In this regards, the present work deals with the estimation of heat transfer and friction factor of non-polar (vacuum pump oil) based magnetic nanofluids flow in a tube under laminar flow at high Prandtl numbers. The motivation for considering vacuum pump oil as a base fluid in this study is its widely use in compressors and vacuum pumps to reduce the friction between the rotating parts by acting as a lubricant. The experiments were conducted under laminar flow (Re < 2300), and particle volume concentrations from 0.05% to 0.5%. The obtained data is compared with the other nanofluids data in the laminar region. Nusselt number and friction factor correlations were proposed based on the experimental data.
The magnetic nanofluids were prepared by dispersing Fe3O4 nanoparticles in the base fluid (vacuum pump oil). The nanoparticles were prepared based on the chemical reduction method by using ferric chloride (FeCl3.6H2O), ferrous chloride (FeCl2.4H2O) and sodium hydroxide (NaOH). These chemicals were purchased from Sigma-Aldrich Chemicals, USA and were used without purification. The vacuum pump oil was purchased from Molykote L-0610, Belgium. The Molykote L-0610 vacuum pump oil is generally used in, among others, centrifugal and piston compressors, vacuum pumps, rotary and reciprocating equipment, and blowers to reduce the friction in the components.
The chemical reduction method contains the flowing steps: (i) dispersion of ferric and ferrous chloride salts in 1 liter of distilled water in the molar ratio of 2:1, (ii) after the dispersion is completed, the solution takes an orange color, (iii) then it is added to it, drop-by-drop, a NaOH-water solution, while maintaining a pH of 12, (iv) it can be noted that the color of the solution turns to black with the formation of a black color precipitate, (v) the precipitate was washed several times with water and acetone and then dried in an oven at a temperature of 80℃ for 24 hours. This procedure was repeated several times for the preparation of bulk quantity of nanoparticles.
The phase characterization of the synthesized nanoparticles was performed by XRD (X-ray diffraction: Siemens, D-500, 45 kV and 40 mA) and the diffraction pattern was shown in Figure 1a. The XRD pattern indicates that the nanoparticles consist of magnetite (Fe3O4), and the diffraction peaks are broadened due to the very small size of the crystallites. The observed XRD diffraction peaks are indexed by the cubic structure of Fe3O4 (JCPDS no. 19-629) revealing high phase purity for the magnetite. The magnetite is formed according to the following reaction:
$F e_{2}^{+}+2 F e_{3}^{+}+8(O H) \rightarrow F e_{3} O_{4}+4 H_{2}$ (1)
The characteristic peaks occur at (220), (311), (400), (422), (511), (440) and (533), as determined from the XRD patterns, over the $2 \theta$ range from 10o to 90o at rate of 2.5o/min, using a wavelength ($\lambda$) of 0.15418 nm. The average core size of the particles can be evaluated from Scherrer equation, namely:
$d=\frac{0.94 \lambda}{B(2 \theta) \cos \theta}$ (2)
where, d is equivalent to the average core diameter of the particles, $\lambda$ is the wavelength of the incident X-ray, $B(2 \theta)$ denotes the full width in radian subtended by the half maximum intensity width of the powder peak and $\theta$ corresponds to the angle at that maximum peak. For the maximum peak in the XRD pattern the observed values of $2 \theta$ and $B(2 \theta)$ are 35.502º and 1.3359º, respectively. For a given wavelength $(\lambda)$ of 0.15148 nm, the particle size (d) was estimated from Eq. (2) and obtained as 11.42 nm. Temizel et al. [29] also used the same method of chemical reduction method for the preparation of Fe3O4 nanoparticles and observed particle size (d) of 11nm.
The magnetic property was analyzed by using the vibrating sample magnetometer (Cryogenics, UK) and the hysteresis is presented in Figure 1b. From the, measurements, the saturation magnetization (Ms) of Fe3O4 nanoparticles is 45 emu/g, which is considerably lower than the theoretical value of saturation magnetization (Ms) for bulk magnetite (92 emu/g). The lower value of saturation magnetization (Ms) indicates, the synthesized nanoparticles are small in size, which leads to structural distortions that can cause spin canting and existence of non-magnetic surface layer [30]. Under the similar synthesis conditions, the present saturation magnetization value well matches with Iida et al. [31] data.
The magnetic nanofluids were prepared by dispersing nanoparticles in the base fluid (vacuum pump oil) without adding any surfactant. The physical properties of magnetite (Fe3O4) and base fluid (VPO) was listed in Table 1. The nanofluids were prepared in the volume concentrations $(\phi)$ of 0.05%, 0.2% and 0.5%, in the base fluid of 15 kg. The known quantity of particles volume concentrations, required quantity of nanoparticles used was calculated from Eq. (3).
Volume concentration (%),
$\phi \times 100=\frac{\frac{W{F e_{3}} O_{4}}{\rho{F e_{3}} O_{4}}}{\frac{W{F e_{3}} O_{4}}{\rho{F e_{3}} O_{4}}+\frac{W_{V P O}}{\rho_{V P O}}}$ (3)
where, density of base fluid $\left(\rho_{V P O}\right)$ is 870 kg/m3, density of Fe3O4 $\left(\rho_{F e_{3}} o_{4}\right)$ is 5810 kg/m3, weight of base fluid $\left(W_{V P O}\right)$ is 15 kg and weight of Fe3O4 $\left(W_{F e_{3} O_{4}}\right)$ is calculated.
Table 1. Physical properties of Fe3O4 and vacuum pump oil (VPO) at 30oC
|
Substance |
Physical properties |
|||
|
$\boldsymbol{\rho}$, (kg/m3) |
k, (W/m K) |
$\boldsymbol{\mu}$, (mPa.sec) |
Cp, (J/kg K) |
|
|
Fe3O4 |
5810 |
80 |
---- |
670 |
|
VPO |
870 |
0.13 |
93.1 |
2320 |
The sample nanofluids were shown in Figure 1c. The present synthesized nanoparticles are showing magnetic behavior even though they dispersed in vacuum pump oil (Figure 1d). The prepared non-polar based magnetic nanofluid of 0.5% volume concentration does not mix with water, even though they dispersed in water (Figure 1d). The nanofluid volume concentrations of 0.05%, 0.2% and 0.5% were prepared in 15 kg of base fluid by dispersing 43.5g, 173.9g, and 436.2g of nanoparticles, respectively. Each nanofluid concentration was stirred with mechanical stirrer at low speed for 2 hours.
Figure 1. Synthesized Fe3O4 nanoparticles: (a) XRD patterns, (b) M-H hysteresis, (c) VPO/Fe3O4 nanofluids samples, (d) nanoparticles showing its magnetic behavior even when they are dispersed in the base fluid, (e) magnetic nanofluid floating on water, indicating the magnetic nanofluid has non-polar behavior
The physical properties, density, specific heat, thermal conductivity and viscosity, were determined experimentally and compared with available literature values.
4.1 Thermal conductivity of nanofluids
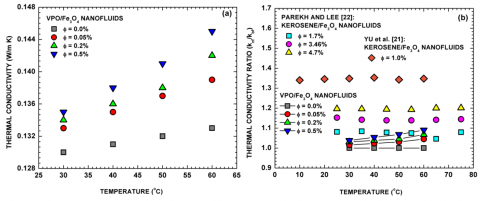
Figure 2. (a) $k_{n f}$ for different values of volume concentrations and temperatures, (b) comparison of thermal conductivity ratio $\left(k_{n f} / k_{b f}\right)$ between the present study and the data of Yu et al. [21] and Parekh and Lee [22] for kerosene/Fe3O4 nanofluids
The thermal conductivity of nanofluids was measured using KD 2 Pro thermal properties analyzer (Decagon Devices Inc., USA). It consists of a KS-1 sensor needle with diameter and length of 60 mm and 1.3 mm, respectively, which is made of stainless steel. The accuracy of the instrument is ±3%. The instrument was calibrated with known thermal conductivity fluid of glycerol. The experimental thermal conductivity was shown in Figure 2a along with base fluid data. It is noticed that, the thermal conductivity of nanofluids is increases with increase of particle volume concentrations from 0.05% to 0.5% and temperatures from 30℃ to 60℃. The thermal conductivity enhancement, when compared to the base fluid, for 0.05% volume concentration is 2.3% and 3.56% at the temperature of 30℃ and 60℃, respectively. Similarly, the thermal conductivity enhancement for 0.5% volume concentration is 3.8% and 9% at the temperature of 30℃ and 60℃, respectively. The thermal conductivity enhancement is caused due to micro-convection and Brownian motion of the nanoparticles in the base fluid. Similar trend of enhanced thermal conductivity with the increase of particle volume concentrations and temperatures were observed by Sundar et al. [17] and Gavali et al. [13].
The relative thermal conductivity $\left(k_{n f} / k_{b f}\right)$ between the thermal conductivity of nanofluids $\left(k_{n f}\right)$ and base fluid $\left(k_{b f}\right)$ is presented in Figure 2b along with the data of Yu et al. [21] and Parekh and Lee [22], who used non-polar (kerosene) based magnetic nanofluids. They report that the relative thermal conductivity increases quasi-linearly with increasing volume concentrations and temperatures. In the present study also, the similar trend was observed, where the thermal conductivity presents a quasi-linear enhancement with increasing particle volume concentrations and temperatures. When compared with the data of Yu et al. [21] and Parekh and Lee [22], the present study data showing lower values of relative thermal conductivity, because in the present study, nanofluids were prepared at low percentage of volume concentration.
4.2 Viscosity of nanofluids
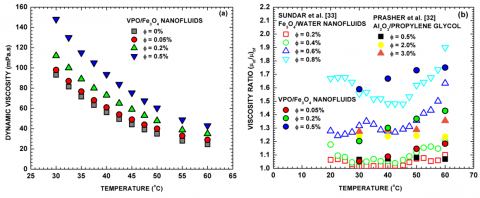
Figure 3. (a) $\mu_{n f}$ for different values of volume concentrations and temperatures, (b) comparison of viscosity ratio $\left(\mu_{n f} / \mu_{b f}\right)$ between the present study and the data of Prasher et al. [32] and Sundar et al. [33]
The viscosity of nanofluids was measured using Vibro-viscometer (A&D Vibro-viscometer, SV-10, Japan) with an accuracy of ±2.5%. It consists of fluid filling-cup, two-gold coated plates and PT-100 sensor of an accuracy of ±0.1℃. The temperature of the fluid filling-cup is controlled by the Julabo temperature controller bath, Germany. The fluid filling-cup was filled with 20 ml of the nanofluid of was filled and then placed on the stand. The height of the stand was adjusted up to the mark given on the vibrating plates. The experiments were conducted in the temperature range of 20℃ to 60℃ and in the particle volume concentration range of 0.02% to 0.5%. The experiment for each sample was repeated five times, and their average is recorded as the final value.
The experimental viscosity data at different volume concentrations of nanofluids is reported in Figure 3a at different temperatures. The viscosity of nanofluids increases with increase of particle volume concentrations and decreases with increase of temperatures. The viscosity increases for 0.05 vol. % of nanofluid is 1.052-times and 1.18-times when compared to the base fluid data at temperatures of 30℃ and 60℃, respectively. For 0.5 vol. %, the viscosity increase is 1.58-times and 1.75-times at temperatures of 30℃ and 60℃, respectively, in comparison to the base fluid data. The viscosity increase is caused by collision of the particles against themselves and the additional between the magnetic particles and the base fluid. Similar trend of viscosity increase due to the particles was observed by Sundar et al. [18] for Fe3O4 nanoparticles.
The relative viscosity $\left(\mu_{n f} / \mu_{b f}\right)$ between the viscosity of nanofluid ($\mu_{n f}$) and the viscosity of base fluid ($\mu_{b f}$) obtained in the present study is presented in Figure 3b along with the data of Prasher et al. [32] for propylene glycol/Al2O3 nanofluids and Sundar et al. [33] for Fe3O4/water data. Prasher et al. [32] and Sundar et al. [33] report that the relative viscosity increases with increase of volume concentrations and temperatures. The same trend of increased viscosity with increase particle volume concentrations and temperatures were observed.
4.3 Density of nanofluids
The density of nanofluids was determined using Archimedes’ principle, where the volume is measured by the buoyancy in a fluid with known density. The weight and buoyancy measurements were performed with an electromagnetic balance (LA203S, Sartorius, Germany) and the accuracy of the instrument is ±0.5%. Pak and Cho [34] proposed the density equation based on the law of mixtures, which is given as:
$\rho_{n f}=(1-\phi) \rho_{V P O}+\phi \rho{F e_{3}} O_{4}$ (4)
where, $\rho_{n f}$ is density of the nanofluid, $\rho_{V P O}$ is the density of base fluid (870 kg/m3) and $\rho{F e_{3}} O_{4}$ is the density of nanoparticles (5810 kg/m3), respectively.
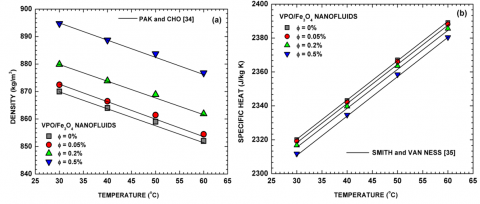
The experimental density values were reported in Figure 4a along with the values of Eq. (4) of Pak and Cho [34]. The experimental density values are in good agreement with the Eq. (4) values of Pak and Cho [34]. The density of nanofluids increases with increase of particle volume concentrations and it decreases with the increase of temperatures. At, 0.5 vol. % of nanofluid, the density increase is 2.84% and 3% at temperatures of 30℃ and 60℃, respectively.
4.4 Specific heat of nanofluids
There are two models to estimate the specific heat of nanofluids.
Model I: The ideal gas mixture principle is used to estimate the specific heat of nanofluids as presented by Smith and Van Ness [35], namely:
$C_{p, n f}=(1-\phi) C_{p, V P O}+\phi C_{p, F e_{3} O_{4}}$ (5)
where, $C_{p, n f}$ is specific heat of the nanofluid, $C_{p, V P O}$ specific heat of the base fluid (2320 J/kg K) and $C_{p, F e_{3} O_{4}}$ specific heat of the nanoparticles (670 J/kg K), respectively.
Model II: This model is based on the statistical mechanism presented by Avsec and Oblak [36]. Assuming that, base fluid and nanoparticles are in thermal equilibrium, the nanofluid specific heat (Cp) is predicted by the following equation.
$C_{p, n f}=\frac{\phi\left(\rho C_{p}\right)_{F e_{3} O_{4}}+(1-\phi)\left(\rho C_{p}\right)_{V P O}}{\phi \rho_{F e_{3} O_{4}}+(1-\phi) \rho_{V P O}}$ (6)
The specific heat of nanofluids was measured using a modulated differential scanning calorimeter (DSC 2920 modulated, TA Instruments) with an accuracy of ± 2%. The measurements were carried out in the temperature range from 30℃ to 60℃ with a heating rate of 5 K/min. Before using the nanofluids, the DSC was calibrated with a standard sapphire sample of known specific heat.
Figure 4. Comparison of (a) density and (b) specific heat of the present study nanofluids at different values of volume concentration and temperature with the predictions of Smith and Van Ness [35] equations
The model I and model II give the same predictions; therefore, in the present study, as reported in Figure 4b, values of specific heat of nanofluids are compared with the values given by Eq. (5) that describes ideal gas mixture principle. It can be observed that the experimental specific heat values are in good agreement with those obtained with Eq. (5). The specific heat of nanofluids increases with increase of temperatures, but it decreases with increase of particle volume concentrations. At, 0.5 vol. % of nanofluid, the specific heat decrease is 0.33% and 0.39% at temperatures of 30℃ and 60℃, respectively. Zhou and Ni [37] also observed similar trend of specific heat as a function of temperature and particle volume concentration for Al2O3/water nanofluids.
The specific heat of nanofluids was measured using a modulated differential scanning calorimeter (DSC 2920 modulated, TA Instruments) with an accuracy of ±2%. The measurements were carried out in the temperature range from 30℃ to 60℃ with a heating rate of 5 K/min. Before using the nanofluids, the DSC was calibrated with a standard sapphire sample of known specific heat.
4.5 Prandtl number
As mentioned above, heat transfer and friction factor values were determined at high Prandtl numbers. The Prandtl number (Pr) is calculated based on the dynamic viscosity ($\mu$), specific heat (Cp) and thermal conductivity (k), according to the following relation.
$\operatorname{Pr}=\frac{\mu \times C_{p}}{k}$ (7)
The Prandtl number values calculated from Eq. (7) is listed in Table 2. It can be noted that the Prandtl number of base fluids is 1661 and 440 at the temperature of 30℃ and 60℃, respectively. The Prandtl number of 0.5 vol. % of nanofluids is 2534.4 and 704.3 at temperatures of 30℃ and 60℃, respectively. The Prandtl number is 1.52-times and 1.6-times higher than that of base fluid data at temperatures of 30oC and 60℃. With the increase of temperature from 30oC to 60oC, the Prandtl number values are decreases.
Table 2. Thermophysical properties of VPO and VPO/Fe3O4 nanofluids
|
$\phi$ |
T, (oC) |
Physical properties |
||||
|
$\boldsymbol{\rho}$ |
k |
$\boldsymbol{\mu}$ |
$\boldsymbol{C}_{\boldsymbol{p}}$ |
Pr |
||
|
$\phi=0 \%$ |
30 |
870 |
0.13 |
93.1 |
2320 |
1661.5 |
|
|
40 |
864 |
0.131 |
56.1 |
2343 |
1003.4 |
|
|
50 |
859 |
0.132 |
34.9 |
2367 |
625.8 |
|
|
60 |
852 |
0.133 |
24.5 |
2389 |
440.1 |
|
$\phi=0.05 \%$ |
30 |
872.47 |
0.133 |
98 |
2319.17 |
1708.9 |
|
|
40 |
866.47 |
0.135 |
61 |
2342.16 |
1058.3 |
|
|
50 |
861.45 |
0.137 |
40 |
2366.15 |
690.8 |
|
|
60 |
854.43 |
0.139 |
29 |
2388.14 |
498.2 |
|
$\phi=0.2 \%$ |
30 |
879.88 |
0.134 |
112 |
2316.70 |
1936.3 |
|
|
40 |
873.89 |
0.136 |
73 |
2339.65 |
1255.8 |
|
|
50 |
868.90 |
0.138 |
47.8 |
2363.60 |
818.7 |
|
|
60 |
861.91 |
0.142 |
35 |
2385.56 |
588.0 |
|
$\phi=0.5 \%$ |
30 |
894.73 |
0.135 |
148 |
2311.75 |
2534.4 |
|
|
40 |
888.73 |
0.138 |
93.6 |
2334.63 |
1583.5 |
|
|
50 |
883.75 |
0.141 |
60.4 |
2358.51 |
1010.3 |
|
|
60 |
876.79 |
0.145 |
42.9 |
2380.40 |
704.3 |
5.1 Experimental fabrication
The experimental setup schematic diagram is depicted in Figure 5. The components of the experimental setup are: (i) test tube, (ii) heating element, (iii) variable pump, (iv) flow meter, (v) chiller and (vi) U-tube manometer. A brief description of the components is given as follows: (i) The test tube consists of copper material with an inner diameter of 10 mm and outer diameter of 12 mm with a length of 1750 mm; (ii) The test tube is wound with nichrome heater of 20 mm gauge, 53.3 $\Omega / \mathrm{m}$ and capacity of 2000 W to provide uniform heat flux boundary condition. The heating element is connected to control panel, which contains voltage regulating dimmerstat, voltmeter (V), and ammeter (I). The test tube with the wounded heating element is placed in a straight horizontal square duct. The gap between the outer surface of the heating element and the square duct is filled with rock wool insulation to minimize the heat loss from the test tube to atmosphere. The outer surface of the square duct is covered with asbestos rope insulation to avoid any further heat loss from the test tube. To record the surface temperature of the test tube, five resistance temperature detector (RTD) PT-100 type thermocouples (General instruments, Mumbai, India) were brazed on the outer surface of the tube at locations of 187.5(T1), 375(T2), 750(T3), 1125(T4) and 1312(T5) mm, respectively, away from the flow meter. Two additional PT-100 type thermocouples were placed at the inlet ($T_{i}$) and outlet ($T_{0}$) of the test tube to record the inlet and outlet temperatures of the working fluid. Before inserting the thermocouples in the test tube, each thermocouple was calibrated with a cold-bath and hot-bath and the observed maximum deviation was ±0.1oC; (iii) One end of the test tube is connected to a variable pump through an oil flow-meter and the other end of the test tube is connected to a chiller; (iv) The flow rate of the base fluid (VPO) or nanofluids, which enter into the test tube was measured with an oil flow-meter K-05 (Belanto water meters, Jalandhar, India) with an accuracy of ±0.2%. One end of the variable pump is connected to a receiving tank of 30 kg capacity and the other end of the variable pump is connected to the oil flow meter. The speed of the pump is controlled by connecting the pump with voltage regulating dimmer start. (v) The chiller is used to bring back the outlet temperature of the base fluid or nanofluids to the atmospheric temperature; (vi) The friction factor of the base fluid and nanofluids were calculated based on the pressure drop. The pressure drop between the inlet and outlet of the test tube was measured by connecting the U-tube manometer between them. One end of the U-tube manometer is connected to a flexible tube at the inlet and outlet of the tube by using 4 mm holes drilled in the test tube. The mercury (Hg) is used as the manometric fluid and the height of the mercury is converted into equivalent VPO column height for the pressure drop calculations. The friction factor experiments were conducted with no heating applied to the test tube.
Figure 5. Schematic representation of experimental setup
5.2 Procedure
The main steps of the procedure are described in what follows. First, the receiving tank is filled with 15 kg of VPO; then, the variable-pump is switched-on and tests are conducted for the volumetric flow rates of 2.5, 5, 7.5, 10 and 12.5 LPM into the test tube to obtain Reynolds number values of 52, 104, 156, 208, and 260, respectively. After achieving the required flow rate in the test tube, the nichrome heater is switched-on and the voltage and ammeter readings are recorded. The temperature readings of the thermocouples are checked every 10 minutes to verify if the steady-state is reached. The steady-state condition is accepted when three sequential sets of temperature readings have differences within the expected accuracy of the thermocouples. After the steady-state condition occurs, the readings of the eight thermocouples are recorded and used for the heat transfer calculations. It takes approximately 2 hours for the system to reach steady state. The same procedure was followed for the other volumetric flow rates of the base fluid or nanofluids. The thermophysical properties used for heat transfer calculations of the base fluid and the nanofluids were calculated at mean temperature. The Newton’s law of cooling equation was used for the heat transfer calculations of the base fluid and nanofluids.
5.3 Data reduction
5.3.1 Experimental Nusselt number
The test section is calibrated with the base fluid before using the nanofluids. The heat supplied (Qh) to the test section is estimated with Eq. (8) using the voltage (V) and the current intensity (I) and the heat absorbed ($\boldsymbol{Q}_{a}$) by the base fluid and nanofluids is determined with Eq. (9) using the mass flow rate ($\dot{\boldsymbol{m}}$). Comparison between the heat supplied and the heat absorbed presents a maximum deviation of ± 2.5%. The relations for Qh and $\boldsymbol{Q}_{a}$ are given as follows:
Heat supplied to the test tube,
$Q_{h}=V \times I$ (8)
Heat absorbed by base fluid and nanofluids,
$Q_{a}=\dot{m} \times C_{p} \times\left(T_{оut}-T_{\text {in }}\right)$ (9)
The Newton’s law of cooling equation is used to estimate the heat transfer coefficient, as follows:
Heat transfer coefficient,
$h_{E x p}=\frac{Q_{a v g}}{A\left(T_{w a l l}-T_{b u l k}\right)}$ (10)
where, $Q_{a v g}$ is the average value between Qh and $Q_{a}$, $Q_{a v g}=\left(Q_{h}+Q_{a}\right) / 2$; A is the heat transfer area, $A=\pi D L$, D and L are the diameter and the length of the tube, respectively; $T_{\text {wall}}$ is the wall temperature, $T_{\text {wall}}=\left(T_{1}+T_{2}+T_{3}+T_{4}+T_{5}\right) / 5$ and $T_{\text {bulk}}$ is the bulk fluid temperature, $T_{\text {bulk}}=\left(T_{\text {out}}+T_{\text {in}}\right) / 2$.
The Nusselt number of the base fluid and nanofluids is calculated by substituting the heat transfer coefficient values from Eq. (10), thermal conductivity of the fluid (k) and diameter of the tube (D), as follows:
Nusselt number,
$N u_{E x p}=\frac{h_{e x p} \times D}{k}$ (11)
5.3.2 Experimental friction factor
The friction factor of the base fluid and nanofluids is calculated based on the pressure difference ($\Delta P$) between the inlet and outlet of the tube and the square of the averaged velocity flowing through the tube ($v^{2}$), as follows:
Friction factor,
$f_{e x p}=\frac{\Delta P}{\left(\frac{L}{D}\right)\left(\frac{\rho v^{2}}{2}\right)}$ (12)
5.4 Available Nusselt number correlations
There are various Nusselt number correlations are available in the fully developed laminar flow, some of them are presented below. Incropera and Dewitt [38] reported the Hausen correlation, which is applicable for inlet uniform velocity and $P r \gg 1$, when the thermal boundary layer is developing in the presence of fully developed laminar flow in a tube.
Hausen correlation:
$N u=3.657+\frac{0.0668(R e P r D / L)}{1+0.04(R e P r D / L)^{2 / 3}}$ (13)
For fully developed hydrodynamically and thermally developing flows, the condition of $(\operatorname{RePr} D / L)^{1 / 3}\left(\mu_{b} / \mu_{w}\right)^{0.14}>2$ [38] is satisfied, then the Nusselt number is calculated based on the Sieder–Tate [39] equation, which is given below.
$N u=1.86\left(\operatorname{RePr} \frac{D}{L}\right)^{1 / 3}\left(\frac{\mu_{b}}{\mu_{w}}\right)^{0.14}$ (14)
$R e<2300 ; 0.48<P r<16700 ;$
$0.0044<\left(\mu_{b} / \mu_{w}\right)<9.75$
For the condition of $(\operatorname{RePr} D / L)^{1 / 3}\left(\mu_{b} / \mu_{w}\right)^{0.14}<2$ [38], the Nusselt number is constant and equal to 3.66. The combined entry length and thermal entry length is characterized based on the Graetz number (Gz) which is defined as $G z=\operatorname{RePr} D / L$. If the value of Gz is less than 100, the Hausen correlation is used. If the value of Gz is greater than 100, Sieder-Tate [39] correlation is used.
Shah [40] proposed correlations, which are applicable for thermally developing, hydrodynamically developed laminar flow $(R e<2300)$ for constant wall temperature and constant heat flux.
Shah [40] equation for constant wall temperature.
$N u=\left\{\begin{array}{c}1.953(\operatorname{RePr} D / L)^{1 / 3} \quad \text { for }(\operatorname{RePr} D / L) \geq 33.3 \\ 4.364+0.0722(\operatorname{RePr} D / L) \quad \text { for }(\operatorname{RePr} D / L)<33.3\end{array}\right.$ (15)
Shah [40] equation for constant wall heat flux.
$N u=3.657+\frac{0.19(\operatorname{RePr} D / L)^{0.8}}{1+0.117(\operatorname{RePr} D / L)^{0.467}}$ (16)
5.5 Available friction factor correlations
The Thome [41], reported the Hagen-Poiseuille and Shah and London relations for laminar flow (Reynolds number, $R e \leq 2100$) for the estimation of friction factor of single-phase fluids. In these correlations, the friction factor is linearly dependent on the Reynolds number, and they are given as below.
Hagen-Poiseuille law:
Friction factor,
$f=64 / R e$ (17)
Shah and London equation
Friction factor,
$f R e=\frac{3.44}{\sqrt{X}}+\frac{P_{o}+\frac{K}{4 X}-\frac{3.44}{\sqrt{X}}}{\frac{1+0.000212}{X^{2}}}$ (18)
where, $X=L / D$; $K=1.2+\frac{38}{R e}$; Poiseuille number $\left(P_{o}\right)$= 16 for circular tubes.
6.1 Nusselt number
The selection of proper Nusselt number correlations is important, to validate the experimental data. In the present study, the experiments are conducted in the thermally developing and the hydrodynamically developed laminar flow at constant heat flux conditions, hence, the Eq. (16) of Shah [40] is suitable to compare the present experimental data. The Eqns. (11) and (12) are used to calculate the heat transfer coefficient and the Nusselt number of base fluids, respectively. Figure 6 reports the experimental Nusselt number of VPO at different Reynolds numbers and the values from Eq. (16) of Shah [40]. It can be observed that the maximum deviation between the experimental values and the Eq. (16) values is ± 3.0%. This deviation is relatively low; hence the test section is adequate to use with the experiments of nanofluids.
Figure 6. Relation between Nusselt number and Reynolds number for the base fluid (VPO) in laminar flow and comparison with Shah [40] equation data
The same Eqns. (11) and (12) are used to calculate the heat transfer coefficient and the Nusselt number of nanofluids, respectively. Figure 7 reports the Nusselt number of nanofluids for different Reynolds numbers along with VPO data. The Nusselt number of base fluids is 15.88 and 27.14 at Reynolds numbers of 63.3 and 316.5, respectively, while the Nusselt number of 0.05 vol. % of nanofluid is 16.5 and 28.7 at same Reynolds numbers. For 0.5 vol. % of nanofluid, the Nusselt number is 17.3 and 30.8 at Reynolds numbers 39.5 and 197.5, respectively. It should be noted that the heat transfer experiments for the VPO and nanofluids were conducted at same mass flow rates. The Reynolds number values of varies, because of the presence of nanofluid viscosity in the calculation of the Reynolds number. It can be noted in Figure 7 that the Nusselt number of nanofluids increases with increase of particle volume concentrations.
Figure 8 shows the Nusselt number of nanofluids at different mass flow rates. The mass flow rates of VPO and nanofluids used in the test section is 0.0416, 0.083, 0.12, 0.166 and 0.2 kg/s. It is observed from the Figure, the Nusselt number of nanofluids increases with increase of particle volume concentrations and mass flow rates. The Nusselt number enhancement for 0.05 vol. % of nanofluid is 3.9% and 5.74% at mass flow rates of 0.0416 kg/s and 0.208 kg/s, respectively, when compared to the VPO data, similarly, at 0.5 vol. % of nanofluid, the Nusselt number enhancement is 8.94% and 13.48%, respectively.
Figure 7. Relation between Nusselt number and Reynolds number for the nanofluids in laminar flow
Figure 8. Relation between Nusselt number and mass flow rate for the nanofluids in laminar flow with different values of particle volume concentration
Figure 9 presents the Nusselt number of VPO and nanofluids at different Graetz numbers $(G z=\operatorname{RePr} D / L)$ The calculated values of Reynolds numbers and Prandtl numbers are listed in Table 2 and the ratio of D/L is 0.0057. From the Figure, it is observed that the Nusselt number of nanofluids increases with increase of particle volume concentrations and Graetz numbers. The Nusselt number of VPO increases from 15.88 to 27.14 with the increase of Graetz number from 537.24 to 2908.12, respectively. Similarly, the Nusselt number of 0.05 vol. % of nanofluids is increases from 16.5 to 28.7 with the increase of Graetz numbers from 526.96 to 2878.56, respectively. The Nusselt number of 0.5 vol. % of nanofluids increases from 17.3 to 30.8 with the increase of Graetz numbers from 520.54 to 2788.48, respectively.
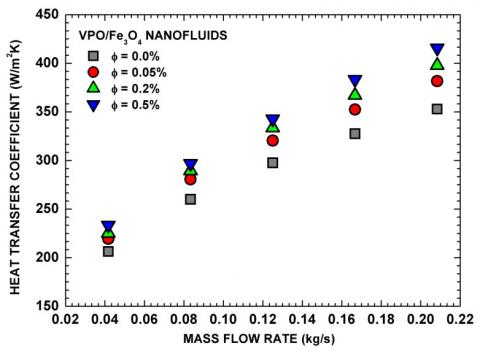
The experimental heat transfer coefficient at different volume concentrations of nanofluid is presented in Figure 10 along with VPO data. The heat transfer coefficient enhancement for 0.05 vol. % of nanofluid is 6.29% and 8.78% at mass flow rates of 0.0416 kg/s and 0.208 kg/s, respectively, compared with VPO data. Similarly, the heat transfer coefficient enhancement of 0.5 vol. % of nanofluid is 13.1% and 17.8% at mass flow rates of 0.0416 kg/s and 0.208 kg/s, respectively, compared with VPO data.
Figure 9. Relation between Nusselt number and Graetz number for the nanofluids in laminar flow
Figure 10. Relation between heat transfer coefficient and mass flow rate for the nanofluids at different values of particle volume concentration in laminar flow
Considering that no reports were found in the open literature related to the Nusselt number of non-polar based magnetic nanofluids, the present data is compared with results of other nanofluids under laminar flow conditions. Yu et al. [42] prepared polar based Al2O3 nanofluids by considering 45:55%, in volume, of ethylene glycol and water as a base fluid and conducted heat transfer experiments by considering 0.01% and 0.02% volume fractions under laminar flow. The present heat transfer coefficient data is reported in Figure 11 along with the data of Yu et al. [42]. In the present study, the experiments were conducted up to a Reynolds number of 330, whereas Yu et al. [42] conducted the experiments up to the Reynolds number close to 2000. The inset in Figure 9 shows the comparison of the present experimental data with Yu et al. [42] data up to the measured Reynolds number range. The present data is lower by 7.8% with 0.01% volume fraction and by 15.31% with 0.02% volume fraction than Yu et al. [42] data for the Reynolds number of 200. In this respect, the Al2O3 based ethylene glycol/water mixture nanofluids of Yu et al. [42] outperform the Fe3O4 based vacuum pump oil nanofluids of the present study.
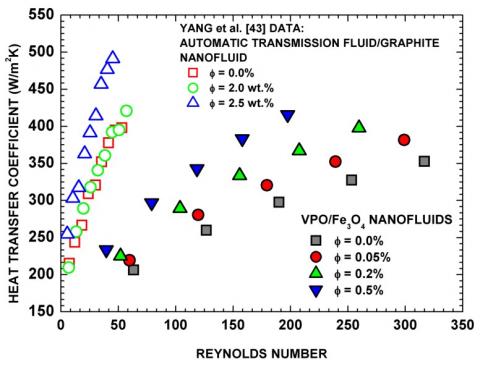
The present experimental heat transfer coefficient is reported in Figure 12 along with the data of Yang et al. [43] for the comparison purpose. Yang et al. [43] conducted heat transfer experiments in the Reynolds number range of 7 to 52 using automatic transmission fluid (ATF)/graphite (non-polar) nanofluids. They observed heat transfer enhancement of 5.5% and 23% with 2.0 wt. % and 2.5 wt. % nanofluid, respectively, at a Reynolds number of 52, when compared with the base fluid (ATF). For the same Reynolds number of 52, in the present study, the heat transfer enhancement is 6.3% and 9.2% for 0.05% and 0.5% volume concentration nanofluid, respectively, when compared with the base fluid (VPO). For the Reynolds number of 52, Yang et al. [43] data shows that their ATF/graphite nanofluids outperform in terms of heat transfer enhancement by 54.17% the VPO/Fe3O4 nanofluids used in the present study.
Figure 11. Relation between heat transfer coefficient and Reynolds number for the nanofluids at different values of particle volume concentration in laminar flow and its comparison with the Yu et al. [42] data for 45:55% EG/W-Al2O3 nanofluids
Figure 12. Relation between heat transfer coefficient and Reynolds number for the nanofluids at different values of particle volume concentration in laminar flow and its comparison with Yang et al. [43] data for ATF/Graphite nanofluids
The Nusselt number data of the present study is correlated ($N u_{r e g}$) using a relation similar to that of Shah [40]. Its average deviation and standard deviation are 1.673% and 1.907%, respectively. The correlation is given as:
$N u_{r e g}=2.015(\text {RePr } D / L)^{0.3306}(1+\phi)^{0.2524}$ (19)
$50<R e<320 ; 1489<P r<2477 ; 0<\phi$
$<0.5 \%$
The proposed correlation, Eq. (19), and the experimental data are presented in Figure 13. It can be noticed that the experimental data is well fitted by Eq. (19) with a maximum deviation of ±2%.
Figure 13. Proposed regression equation of Nusselt number and its comparison with the experimental data
6.2 Friction factor
The tests were conducted to determine the friction factor of VPO under laminar flow and the Eq. (19) was used to calculate the friction factor. The friction factor determined by Hagen-Poiseuille law (Eq. 17) and by Shah and London equation (Eq. 20) lead practically to the same values. Hence, the present friction factor of VPO is verified with the Hagen-Poiseuille law $(f=64 / R e)$ and the data is reported in Figure 14. A maximum of ±2% deviation was observed between the experimental and Hagen-Poiseuille values. The experiments were repeated with VPO/Fe3O4 nanofluids, and Eq. (19) is used to calculate the friction factor. Figure 15 reports the friction factor of nanofluids at different values of Reynolds number and volume concentrations, and the friction factor of VPO. The friction factor for 0.05 vol. % of nanofluid is 1.1 and 0.221 with Reynolds number of 59.8 and 299, respectively. Similarly, the friction factor of 0.5 vol. % of nanofluid is 1.23 and 0.24 at Reynolds number of 39.5 and 197.5, respectively, whereas, the VPO friction factor is 1.01 and 0.20 at Reynolds number of 63.3 and 316.5, respectively.
The friction factor of nanofluids and VPO were reported in Figure 16 at different mass flow rates. The mass flow rate of VPO and nanofluids were kept constant throughout the experiments. The friction factor penalty of 1.09-times and 1.075-times was observed for 0.05 vol. % of nanofluid at mass flow rates of 0.041 kg/s and 0.2 kg/s, respectively, when compared to VPO data. Similarly, the friction factor penalty of 1.21-times and 1.182-times was observed for 0.5 vol. % of nanofluid at mass flow rate of 0.041 kg/s and 0.2 kg/s, respectively, compared to VPO data.
As stated above, Ahuja [1] conducted the friction factor experiments with dispersion of 50$\mu-$ and 100$\mu-$ diameter polystyrene spheres in aqueous sodium chloride or glycerin fluids in 20 wt. % under laminar flow conditions and observed friction factor reduction $f=64 / R e$ (Hagen-Poiseuille) to $f=59 / R e$.
Figure 14. Verification of the friction factor data for vacuum pump oil in the laminar flow regime using the Hagen-Poiseuille law (f = 64/Re)
Figure 15. Relation between friction factor and Reynolds number for the nanofluids in laminar flow
Figure 16. Relation between friction factor and Reynolds number for the nanofluids in laminar flow
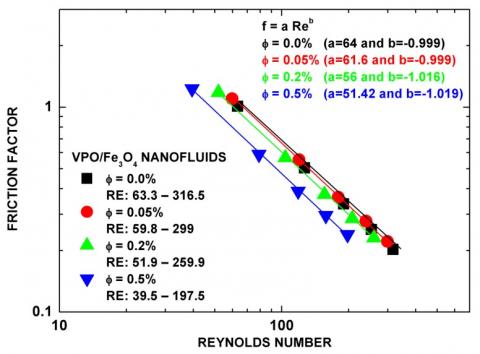
The friction factor data of present study is correlated under the similar lines of Ahuja [1] and developed equation is presented below.
$f=a R e^{b}$ (20)
The constants a and b of Eq. (20) are obtained by linear regression at different values of particle volume concentrations.
$\phi=0 \% \Rightarrow f=64 R e^{-0.999}\left(\mathrm{R}^{2}=0.995\right)$
$\phi=0.05 \% \Rightarrow f=61.6 R e^{-0.999}\left(\mathrm{R}^{2}=0.993\right)$
$\phi=0.2 \% \Rightarrow f=56 R e^{-1.016}\left(\mathrm{R}^{2}=0.987\right)$
$\phi=0.5 \% \Rightarrow f=51.42 R e^{-1.019}\left(\mathrm{R}^{2}=0.982\right)$
If the Hagen-Poiseuille law $(f=64 / R e)$ is used to calculate the friction factor it would overpredict, as compared to Eq. (20) values, by 3.25%, 12.5% and 19.65% for 0.05%, 0.2% and 0.5% volume concentration nanofluids, respectively. The values obtained with Eq. (20) are presented in Figure 17 along with the experimental friction factor data.
Figure 17. Proposed regression equation and experimental data for the friction factor
The heat transfer and friction factor of high Prandtl number based Fe3O4 nanofluids flow in a tube under laminar flow conditions were analyzed experimentally. The thermal properties were also measured experimentally. The following conclusions were draw from the analysis.
The new Nussle number and friction factor correlations were proposed for fully developed laminar flow. So, the vacuum pump oil based nanofluids are having higher heat transfer rates and those are more beneficial fluids in the vacuum pumps for absorbing more heat from the rotating components.
The authors acknowledge FCT through the grant: UID/EMS/00481/2013, infrastructures support CENTRO-01-0145-FEDER-022083. The author ACMS also acknowledges the 2017 Visiting Scientist Fellowship awarded to him under the Chinese Academy of Sciences President’s International Fellowship Initiative. The author LSS acknowledges FCT, through his post–doctoral grant (SFRH/BPD/100003/2014).
[1] Ahuja, A.S. (1975). Augmentation of heat transport in laminar flow of polystyrene suspension. I. Experiments and results. Journal of Applied Physics, 46: 3408-3416. https://doi.org/10.1063/1.322107
[2] Ahuja, A.S. (1975). Augmentation of heat transport in laminar flow of polystyrene suspension. II. Analysis of the data. Journal of Applied Physics, 46: 3417-3425. https://doi.org/10.1063/1.322062
[3] Choi, S.U.S. (1995). Enhancing thermal conductivity of fluid with nanoparticles, in: D.A. Siginer, H.P. Wang (Eds.), Developments and Applications of Non-Newtonian Flows.FED-V.231/MD-V.66. ASME. New York: 99-105.
[4] Abareshi, M., Sajjadi, S.H., Zebarjad, S.M., Goharshadi, E.K. (2011). Fabrication, characterization, and measurement of viscosity of α-Fe2O3-glycerol nanofluids. Journal of Molecular Liquids, 163(1): 27-32. https://doi.org/10.1016/j.molliq.2011.07.007
[5] Ni, S., Lin, S., Pan, Q., Yang, F., Huang, K., He, D. (2009). Hydrothermal synthesis and microwave absorption properties of Fe3O4 nanocrystals. Journal of Physics. D: Applied Physics, 42(5): 1-5. https://doi.org/10.1088/0022-3727/42/5/055004
[6] Salavati-Niasari, M., Khansari, A., Davar, F. (2009). Synthesis and characterization of cobalt oxide nanoparticles by thermal treatment process. Inorganica Chimica Acta, 362(14): 4937-4942. https://doi.org/10.1016/j.ica.2009.07.023
[7] Sundar, L.S., Singh, M.K., Bidkin, I., Sousa, A.C.M. (2014). Experimental investigations in heat transfer and friction factor of magnetic Ni nanofluid flowing in a tube. International Journal of Heat and Mass Transfer, 70: 224-234. http://doi.org/10.1016/j.ijheatmasstransfer.2013.11.004
[8] Hiegeister, R., Andra, W., Buske, N., Hergt, R., Hilger, I., Richter, U., Kaiser, W. (1999). Application of magnetite ferrofluids for hyperthermia. Journal of Magnetism and Magnetic Materials, 201(1-3): 420-422. https://doi.org/10.1016/S0304-8853(99)00145-6
[9] Nakamura, M., Decker, K., Chosy, J., Comella, K., Melnik, K., Moore, L., Lasky, L.C., Zborowski, M., Chalmers, J.J. (2001). Separation of a breast cancer cell line from human blood using a quadrupole magnetic flow sorter. Biotechnology Progress, 17(6): 1145-1155. https://doi.org/10.1021/bp010109q
[10] Zborowski, M., Sun, L., Moore, L.R., Williams, P.S., Chalmers, J.J. (1999). Continuous cell separation using novel magnetic quadrupole flow sorter. Journal of Magnetism and Magnetic Materials, 194(1-3): 224-230. https://doi.org/10.1016/S0304-8853(98)00581-2
[11] Miller, M.M., Prinz, G.A., Cheng, S.F., Bounnak, S. (2002). Detection of a micron-sized magnetic sphere using a ring-shaped anisotropic magnetoresistance-based sensor: A model for a magnetoresistance-based biosensor. Applied Physics Letters, 81: 2211-2213. https://doi.org/10.1063/1.1507832
[12] Shuchi, S., Sakatani, K., Yamaguchi, H. (2005). An application of a binary mixture of magnetic fluid for heat transport devices. Journal of Magnetism and Magnetic Materials, 289: 257-259. https://doi.org/10.1016/j.jmmm.2004.11.073
[13] Gavili, A., Zabihi, F., Isfahani, T.D., Sabbaghzadeh, J. (2012). The thermal conductivity of water base ferrofluids under magnetic field. Experimental Thermal and Fluid Science, 41: 94-98. https://doi.org/10.1016/j.expthermflusci.2012.03.016
[14] Altan, C.L., Elkatmis, A., Yüksel, M., Aslan. N., Bucak, S. (2011). Enhancement of thermal conductivity upon application of magnetic field to Fe3O4 nanofluids. Journal of Applied Physics, 110(9): 1-7. https://doi.org/10.1063/1.3658868
[15] Abareshi, M., Goharshadi, E., Zebarjad, S.M., Fadafan, H.K., Youssefi, A. (2010). Fabrication, characterization and measurement of thermal conductivity of Fe3O4 nanofluids. Journal of Magnetism and Magnetic Materials, 322(24): 3895-3901. https://doi.org/10.1016/j.jmmm.2010.08.016
[16] Li, Q., Xuan, Y., Wang, J. (2005). Experimental investigations on transport properties of magnetic fluids. Experimental Thermal and Fluid Science, 30(2): 109-116. https://doi.org/10.1016/j.expthermflusci.2005.03.021
[17] Sundar, L.S., Singh, M.K., Sousa, A.C.M. (2013). Thermal conductivity of ethylene glycol and water mixture based Fe3O4 nanofluid. International Communications in Heat and Mass Transfer, 49: 17-24. https://doi.org/10.1016/j.icheatmasstransfer.2013.08.026
[18] Sundar, L.S., Ramana, E.V., Singh, M.K., Sousa, A.C.M. (2012). Viscosity of low volume concentrations of magnetic Fe3O4 nanoparticles dispersed in ethylene glycol and water mixture. Chemical Physics Letters, 554: 236-242. https://doi.org/10.1016/j.cplett.2012.10.042
[19] Philip, J., Shima, P.D., Raj, B. (2007). Enhancement of thermal conductivity in magnetite based nanofluid due to chainlike structure. Applied Physics Letters, 91(20): 203108. https://doi.org/10.1063/1.2812699
[20] Segal, V., Rabinovich, A., Nattrass, D., Raj, K., Nunes, A. (2000). Experimental study of magnetic colloidal fluids behaviour in power transformers. Journal of Magnetism and Magnetic Materials, 215-216: 513-515. https://doi.org/10.1016/S0304-8853(00)00205-5
[21] Yu, W., Xie, H., Chen, L., Li, Y. (2010). Enhancement of thermal conductivity of kerosene-based Fe3O4 nanofluids prepared via phase-transfer method. Colloids and Surfaces A: Physicochemical and Engineering Aspects, 355(1-3): 109-113. https://doi.org/10.1016/j.colsurfa.2009.11.044
[22] Parekh, K., Lee, H.S. (2019). Magnetic field induced enhancement in thermal conductivity of magnetite nanofluid. Journal of Applied Physics, 107(09A310): 1-3. https://doi.org/10.1063/1.3348387
[23] Wang, B., Wang, B., Wei, P., Wang, X., Lou, W. (2012). Controlled synthesis and size-dependent thermal conductivity of Fe3O4 magnetic nanofluids. Dalton Transactions, 41(3): 896-899. https://doi.org/10.1039/C1DT11222H
[24] Sundar, L.S., Ramana, E.V., Singh, M.K., Sousa, A.C.M. (2015). Magnetic field induced enhancement in thermal conductivity and viscosity of stabilized vacuum pump oil (VPO)-Fe3O4 magnetic nanofluids. Journal of Nanofluids, 4(1): 1-9. http://doi.org/10.1166/jon.2015.1124
[25] Pop, L.M., Odenbach, S., Wiedenmann, A., Matoussevitch, N., Bonnemann, H. (2005). Microstructure and rheology of ferrofluids. Journal of Magnetism and Magnetic Materials, 289: 303-306. https://doi.org/10.1016/j.jmmm.2004.11.086
[26] Lajvardi, M., Moghimi-Rad, J., Hadi, I., Gavili, A., Isfahani, T.D., Zabihi, F., Sabbaghzadeh, J. (2010). Experimental investigation for enhanced ferrofluid heat transfer under magnetic field effect. Journal of Magnetism and Magnetic Materials, 322(21): 3508-3513. https://doi.org/10.1016/j.jmmm.2010.06.054
[27] Li, Q., Xuan, Y. (2009). Experimental investigation on heat transfer characteristics of magnetic fluid flow around a fine wire under the influence of an external magnetic field. Experimental Thermal and Fluid Science, 33(4): 591-596. https://doi.org/10.1016/j.expthermflusci.2008.12.003
[28] Sundar, L.S., Naik, M.T., Sharma, K.V., Singh, M.K., Siva Reddy, T.C. (2012). Experimental investigation of forced convection heat transfer and friction factor in a tube with Fe3O4 magnetic nanofluid. Experimental Thermal and Fluid Science, 37: 65-71. https://doi.org/10.1016/j.expthermflusci.2011.10.004
[29] Temizel, E., Ayan, E., Senel, M., Erdemi, H., Yavuz, M.S., Kavas, H., Baykal, A., Ozturk, R. (2011). Synthesis, conductivity and magnetic properties of poly (N-pyrrole phosphoric acid)–Fe3O4 nanocomposite. Materials Chemistry and Physics, 131(1-2): 284–291. http://doi.org.10.1016/j.matchemphys.2011.09.043
[30] Umarea, S.S., Shambharkar, B.H., Ningthoujam, R.S. (2010). Synthesis and characterization of polyaniline–Fe3O4 nanocomposite: Electrical conductivity, magnetic, electrochemical studies. Synthetic Metals, 160(17-18): 1815-1821. https://doi.org/10.1016/j.synthmet.2010.06.015
[31] Iida, H., Takayanagi, K., Nakanishi, T., Osaka, T. (2007). Synthesis of Fe3O4 nanoparticles with various sizes and magnetic properties by controlled hydrolysis. Journal of Colloid and Interface Science, 314(1): 274-280. https://doi.org/10.1016/j.jcis.2007.05.047
[32] Sundar, L.S., Singh, M.K., Sousa, A.C.M. (2013). Investigation of thermal conductivity and viscosity of Fe3O4 nanofluid for heat transfer applications. International Communications in Heat and Mass Transfer, 44: 7-14. https://doi.org/10.1016/j.icheatmasstransfer.2013.02.014
[33] Prasher, R., Song, D., Wang, J., Phelan, P. (2006). Measurements of nanofluid viscosity and its implications for thermal applications. Applied Physics Letters, 89(13): 1-3. https://doi.org/10.1063/1.2356113
[34] Pak, B.C., Cho, Y.I. (1998). Hydrodynamic and heat transfer study of dispersed fluids with submicron metallic oxide particles. Experimental Heat Transfer, 11(2): 151-170. https://doi.org/10.1080/08916159808946559
[35] Smith, J.M., Van Ness, M.C. (1987). Introduction to Chemical Engineering Thermodynamics. McGraw–Hill, New York.
[36] Avsec. J., Oblak, M. (2007). The calculation of thermal conductivity, viscosity and thermodynamic properties for nanofluids on the basis of statistical nanomechanics. International Journal of Heat and Mass Transfer, 50(21-22): 4331-4341. https://doi.org/10.1016/j.ijheatmasstransfer.2007.01.064
[37] Zhou, S.Q., Ni, R. (2003). Measurement of the specific heat capacity of water-based Al2O3 nanofluid. Applied Physics Letters, 92(9): 1-3. https://doi.org/10.1063/1.2890431
[38] Incropera, F.P., Dewitt, D.P. (1996). Introduction to Heat Transfer. 3rd Edition, John Wiley & Sons Inc., New York, USA.
[39] Sieder, E.N., Tate, G.E. (1936). Heat transfer and pressure drop of liquids in tubes. Industrial Engineering Chemistry, 28(12): 1429-1435. https://doi.org/10.1021/ie50324a027
[40] Shah, R.K. (1975). Thermal entry length solutions for the circular tube and parallel plates. Proceedings of 3rd National Heat and Mass Transfer Conference, vol. 1, Indian Institute of Technology, Bombay, HMT-11-75. http:/doi.org/10.1109/THETA.2010.5766420
[41] Thome, J.R. (2010). Engineering Data Book III. Faculty of Engineering Science and Technology, Swiss Federal Institute of Technology Lausanne (EPFL) CH – 1015 Lausanne, Switzerland, Wolverine Tube, Inc.
[42] Yu, W., Xie, H., Li, Y., Chen, L., Wang, Q. (2012). Experimental investigation on the heat transfer properties of Al2O3 nanofluids using the mixture of ethylene glycol and water as base fluid. Powder Technology, 230: 14-19. https://doi.org/10.1016/j.powtec.2012.06.016
[43] Yang, Y., Zhang, Z.G., Grulke, E.A., Anderson, W.B., Wu, G. (2005). Heat transfer properties of nanoparticle-in-fluid dispersions (nanofluids) in laminar flow. International Journal of Heat and Mass Transfer, 48(6): 1107-1116. http://doi.org.10.1016/j.ijheatmasstransfer.2004.09.038