Yousef Al Horr | Bourhan Tashtoush* | Nelson Chilengwe
© 2020 IIETA. This article is published by IIETA and is licensed under the CC BY 4.0 license (http://creativecommons.org/licenses/by/4.0/).
OPEN ACCESS
An experimental investigation of the performance of a direct-indirect evaporative cooling fresh air handling unit with different modes of operation is presented. Linear regression analysis is used to fit the experimental results, and the correlation coefficient is evaluated.
It is found that the highest temperature reduction of 18.8℃ is achieved across the heat exchanger for the tested unit when the water shower mode is implemented at an ambient dry-bulb temperature of 44℃ in conditions of relative humidity less than 20%. In the water shower and the combined mist injection and water shower modes of operation, the temperature reduction across the heat exchanger generally reduces, with increasing relative humidity. Furthermore, the results showed that water consumption increased with increasing ambient dry-bulb temperature and decreased with increasing ambient relative humidity. Finally, the lowest energy consumption of 1.64 kWh occurred with the water shower mode operated at peak dry-bulb temperature design condition. The energy consumptions for the mist injection mode of operation were 1.89 kWh and 2.15 kWh for the peak dry-bulb temperature and peak wet-bulb temperature design conditions, respectively. At these design conditions, the energy consumptions of the combined mist injection and water shower mode of operation are 2.7 kWh and 2.83 kWh, respectively.
direct evaporative cooling, indirect evaporative cooling, mist injection, energy consumption, water shower
Hot arid countries heavily rely on air conditioning to create comfortable indoor environments for occupants around the year. Electrical energy consumption of air conditioning in residential buildings is relatively high in hot climate countries and accounts for 70% of the total energy consumption [1-3]. The use of several evaporative cooling (EC) is becoming increasingly popular and continues to be studied by various researchers who have focused on a variety of aspects, such as developing smaller and lightweight cooling units. These units are often fitted with enhanced evaporative cooling technologies, which enable them to deliver large cooling capacities required from air handling units for ventilation applications [4, 5].
The change of phase from liquid to vapor results in a reduction of the temperature of the air and requires less energy than that used by comparable refrigeration systems. In arid climatic conditions, EC has the added benefit of increasing the moisture content of the supply air stream. In hot arid climates, it is feasible to utilize EC, which can be implemented by employing various modes of operation such as mist injection [6], water spray [7], or the combination of mist injection and water spray [8].
The main characteristic of the materials used in EC systems is the water-holding ability while allowing air to pass through, i.e., and its porosity has a direct impact on water consumption. Researchers have considered a variety of potential materials, including porous ceramic pads [9], cellulose pads [10, 11], corrugated paper [12], and organic type pads [13], to name but a few.
A significant barrier to the use of EC systems in hot and arid climatic regions of the world is the essential water requirements. The water consumption patterns for EC purposes were studied and investigated for different situations ranging from understanding how it affects the condition of supply air to assessments aimed at optimizing the water consumption rate [14, 15].
The water consumption in an indirect evaporative cooling (IEC) system with installed water spray nozzles was considered for balanced primary and secondary air flows, [16]. The case where water was supplied at a constant rate of 0.11 kgs-1, to the exhaust air stream of an IEC prototype, which enhanced the cooling performance was investigated [17]. The two-stage indirect/direct evaporative cooling (IDEC) system operating in various climatic conditions was analyzed, and the results showed that the combined mode consumed 55% more water compared to the direct evaporative cooling (DEC) system [18]. The effect of water nozzles and airflow arrangements on the performance of a cross-flow indirect evaporative cooler was studied [19]. The effect of water temperature on the EC performance was investigated, and it was noted that higher temperatures enhanced the evaporation rate of a mist injection spray [20]. Some researchers have quantified evaporative losses in EC systems to be up to 15%–20% of the quantity of water used per day [21].
Another important aspect relating to EC systems is its associated low electrical energy consumption, which makes the use of EC units to pre-cool ventilation air an attractive and promising technology. EC technology has been deemed to provide cooling energy savings, has a beneficial impact on the environment, and can improve the efficiency of cooling systems [22, 23].
Researchers over the past decades have extensively studied cooling systems employing EC methods from the perspective of energy savings [24, 25]. The results showed that the combination of IEC and conventional cooling coil for application in hot/dry and hot humid climates could achieve about 55% saving in electrical energy where the system could provide 75% of the cooling load in the cooling season. In another work on EC, it was found that a two-stage EC system was four and half times more efficient than a conventional system and identified water pumps as well as air blower as the primary energy-consuming devices in EC units [26].
In cases where it is not desirable to increase the moisture content of the supply air, indirect evaporative coolers can be integrated into traditional air handling systems to improve energy efficiency [27]. IEC is often used in combination with conventional cooling technologies such as chilled water-cooling coils to create more effective cooling cycles [28].
The primary electrical energy consuming items in an air handling unit (AHU) with chilled water-cooling coil and EC are ventilation fans and water pumps, which are required to circulate chilled water in the cooling coil. The energy consumption associated with these systems was investigated and documented [29, 30]. An IEC unit was analytically evaluated and compared to a conventional packaged air conditioner and found that the traditional package consumed 3.5 times more energy than that of the EC unit [31].
The use of IEC to pre-cool fresh air was also investigated [32]. Several researchers have explored how EC performs in various climates [33, 34], with some focusing on how IEC performs in hot and humid climatic regions [35, 36].
Results from many studies have shown that EC could achieve significant cooling capacity in many operating conditions.
There is, however, still a lack of knowledge in the literature concerning water usage in different modes of operation (mist injection, water shower, or combination of mist injection and water shower) of the EC system used in a variety of climatic conditions. Therefore, to address this concern of water usage of EC systems under hot and arid ambient conditions experienced in GCC countries, particularly in Qatar, this study sought to investigate and identify which mode of operation uses the least amount of water under prevailing ambient conditions. Such information can be useful in drawing up efficient sequences of operation and control of EC systems to conserve water.
The present study investigates the performance of a hybrid IEC with a chilled water-cooling coil system operating under multiple modes (mist injection, water shower, and combination of mist injection and water shower) in a wide variety of ambient conditions experienced in GCC countries. Therefore, this study utilizes experimental data to investigate the performance of the hybrid fresh air handling cooling system from the perspectives of potential water and energy savings derived from choosing the most effective mode of operation under prevailing ambient conditions. The study considers temperature reduction across the heat exchanger, water consumption, and electrical energy consumption, which are analyzed based on actual data acquired via experimental measurements during the 12 months extending from August 2018 to July 2019.
2.1 Experimental rig
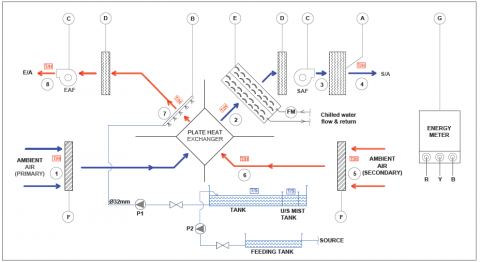
The experimental test rig (Model HSL050M-S) is an industrial FAHU with a cooling capacity of 80 kW and a motor power of 0.55 kW. The overall unit size is 2 m x 1.1 m x 2.1 m with balanced primary and secondary airflow rates of 5000 CMH. The FAHU system is composed of a cross-flow heat exchanger, a chilled water cooling coil, fans, water pumps, filters, pads, water tanks, spray nozzles, and ultrasonic mist injection generator, as shown in Figure 1. The main parameters of the FAHU components are shown in Table 1.
Figure 1. Schematic diagram of the IDEC system
Table 1. IDEC system parts specification
|
S. No |
Parts |
Qty |
Specifications |
|
1 |
Supply Fan |
1 |
Centrifugal fan, Power – 4.2 kW Measured CFM – 1654 |
|
2 |
Exhaust Fan |
1 |
Centrifugal fan, Power -4.2 kW Measured CFM – 1363 |
|
3 |
Ultrasonic Mist injection |
3 |
Mist injection Generation – 18 Lit h-1 Power -0.75KW Tank Dimension – 0.18 * 0.24*0.7 m |
|
4 |
Water Shower |
1 |
Nozzle – 12 Pcs, Pump Power -1 HP |
|
5 |
Cooling Coil |
1 |
Dimension - 6 Row*21 holes*25.9” Chilled water flow rate – 0.172 ms-1 Cooled water flow rate – 0.37 ms-1 |
|
6 |
Heat Exchanger |
1 |
Air to Air – Wavy type Dimension – 0.5 *0.5*1.05 m Air Flow - Counter Flow |
(a)
(b)
Figure 2. Air conditioning processes of the (a) Theoretical and (b) Experimental IDEC
The secondary air indirectly cools the primary air in the cross-flow heat exchanger. Water consumption for each mode of operation was measured by evaluating the differences in the tank water levels over a period recorded at the beginning and end of the operation. Energy consumption was measured by an energy meter installed as part of the electrical circuit within the air handling unit.
The ambient primary (supply) air, at state (1), flows through the dry channels of the cross-flow plate heat exchanger, where it is cooled by contact with the cold surfaces to attain air state (2). The primary air then flows across the chilled water-cooling coil, where it is cooled to air state (3). Finally, the supply air stream passes through a cellulose pad before being supplied to the conditioned space at state (4). In dry weather conditions, where the primary air humidity is very low, it could be humidified and further cooled down by direct EC if a water shower was added to the cellulose pad, which increases the moisture content of the supply air. The ambient secondary flow at state (5) is pre-conditioned by mist injection, where its temperature is decreased, and relative humidity is increased at state (6). An additional decrease in the secondary air temperature, at state (7), can be achieved when the secondary air flows through the wet channels of the heat exchanger, where nozzles spray a water shower. The secondary airflow is exhausted to the ambient at the air state (8).
Suitable sensors are installed at the respective inlets and outlets of the various components to measure the temperature and relative humidity levels. Aranet wireless current temperature sensors are used with a measurement range of -40 to 60℃, relative humidity ranges from 0 to 100%, and the accuracy of the sensors is 0.4℃ and 4%, respectively. The measured data is logged using a wireless data acquisition system and saved on a server for further processing and analysis.
2.2 Psychrometric processes
The theoretical processes (1-4) of cooling the primary airflow and (5-8) of the secondary airflow treatment are presented in the psychrometric chart in Figure 2a. The corresponding experimental psychrometric processes are shown in Figure 2b. The primary air sensible cooling process in the cross-flow heat exchanger is represented in the process 1-2. The temperature of the supply air stream at state (2) cannot be lower than the temperature of the secondary air leaving the heat exchanger. Free chilled water supplied by a solar absorption chiller is utilized to cool down the primary air stream to state 3. A dehumidification process can occur on the cooling coil, which leads to a decrease in the moisture content of the supply air. In case when the relative humidity is lower than the set value, the primary air can be humidified by direct EC in the cellulose pad, if a water shower was installed, where its relative humidity can be increased to the required setpoint. The pre-conditioning process of the secondary air stream (5-6) by mist injection results in a decrease of the air temperature and an increase in relative humidity along the line of constant wet-bulb temperature. The water shower process of the secondary flow (6-7) in the cross-flow heat exchanger compensates for the increase in secondary air temperature due to indirect cooling with the primary air. The secondary air is exhausted to ambient by the exhaust air fan at state (8).
The experimental presentation of the psychrometric processes shown in Figure 2b indicates a slight difference in the range of one degree in the ambient temperatures of the primary and secondary air streams. It is seen that the experimental process of the secondary airflow (6-7) deviates from the saturation line. This deviation occurs since the secondary air will have a lower wet bulb temperature than the corresponding dry bulb temperature as it flows from state 6 to state 7.
The working modes of operation considered in the present study are IDEC with water shower, mist injection, and a combination of water shower and mist injection, and experimental data of the performance of the FAHU are collected during the tests and analyzed.
For the constant primary and secondary airflow rates, water and electricity consumption were measured and recorded accordingly for each of the modes of operation. The water shower is provided by 120 nozzles installed on two parallel manifolds. The water flowrate, as provided by the manufacturer, is 0.5 ls-1 at a pressure of 5 bars. A counter-current arrangement is adopted to provide water to the secondary air stream. A pumping unit with a flow rate of 0.67 ls-1 and 10 bars, respectively, are used to supply water to the nozzles. The average water temperature in the storage tank is 36℃.
For the mist mode operation, three pieces of mist producing devices are mounted in the unit. The specification of these devices is: a working voltage of 40~50V, the work current is 5300~5700 mA, the working temperature range is 5-55℃, the humidity production method is the spray method, the fog amount is 7 kg.h-1, the best water level is 36-40 mm, the material is copper, and the maximum working temperature is 55±3℃. The working procedure of the mist can be described as follows: each mist device with ten heads and each head comprises of atomizer film with a ceramic plate mounted on the top. Every mist device has a water sensor, which will work at a water level of 36-40 mm height from the device. During the operation of the device, the atomizer film makes a vibration movement with 1700 kHz. During this vibration, the fog will be produced with a capacity of 7 kg.h-1 of fog. As the misting device is working, the water temperature will be increased.
The regression analysis is defined as a statistical method used for finding the relationship between a dependent variable and one or more independent variables. In the present work, the temperature difference is the dependent variable, and the ambient temperature and relative humidity are the independent variables. The regression analysis is utilized to assess the strength of the relationship between theses dependent and independent variables for modeling the future relationship between them. The regression analysis can be linear, multiple linear, or nonlinear, where the common model is the simple linear. The linear model is expressed as:
Y = a + bX + ϵ (1)
where,
Y – Dependent variable, which is the temperature difference in this analysis, X – Independent variable, which is either the ambient temperature or the relative humidity, a – Intercept. b – Slope, and ϵ – Residual (error). The correlation coefficient, R2, measures the degree of association of data. Sometimes, it is defined as Pearson's correlation coefficient. It is measured on a scale that varies from + 1 through 0 to - 1. The plus and minus unity is used to express the complete correlation between the two variables. The positive value indicates an increase in one variable as the other increases, whereas the negative value indicates a decrease in the variable as the other increases. It is estimated as follows:
$R^{2}=\frac{n\left(\sum x y\right)-\left(\sum x\right)\left(\sum y\right)}{\sqrt{\left[n\left(\sum x^{2}-\left(\sum x\right)^{2}\right)\right]} n\left(\sum y^{2}-\left(\sum y\right)^{2}\right)}$ (2)
where, n is the number of data.
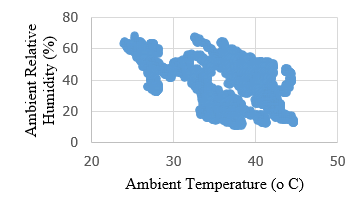
Figure 3. Ambient temperature and relative humidity for August 2018-July 2019 in Doha-Qatar
The experimental measurements of the performance of different modes of operation were carried out for a wide range of temperatures and relative humidity from August 2018 to July 2019 for the Qatar climate, as shown in Figure 3. The highest relative humidity of 69% at a temperature of 25.1℃ was recorded. For higher ambient temperatures, the relative humidity was in the range of 10-50%.
The acquired experimental data was analyzed from various perspectives, and the results are presented and discussed in this section. For comparison purposes, the data was divided into two categories, one for temperature and the other for the relative humidity. Each category is divided into three ranges: <28℃, (28-40)℃, and >40℃ for temperature values and <20%, (20-40)%, and >40% for relative humidity. All experimental data were modeled using regression analysis, and the corresponding correlation coefficients are provided for each case.
4.1 Temperature difference variation with ambient temperature at relative humidity less than 20%
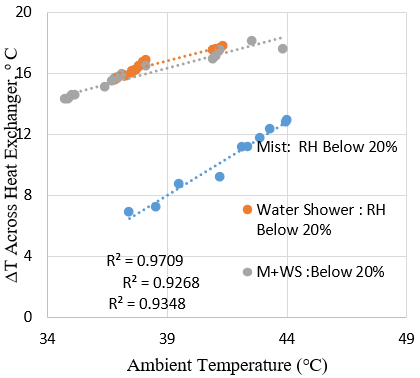
The variation of the temperature difference across the heat exchanger for different modes of operation and relative humidity less than 20% is presented in Figure 4. It can be seen that higher temperature differences, across the heat exchanger, can be obtained with the water shower mode of operation for ambient temperatures ranging from 37.3 to 41.2℃. For this mode of operation, the minimum and maximum temperature reductions achieved are 15.9℃ and 17.8℃ at ambient temperatures of 37.3 and 41.2℃, respectively. In ambient conditions of low relative humidity, the mist injection mode of operation achieves the lowest temperature reductions across the heat exchanger. The highest temperature reduction for this mode is found to be than 13℃, which occurs at a dry bulb temperature (DBT) of 44℃. A linear regression representation of the temperature difference across the heat exchanger as a function of ambient DBT for the experimental range gave excellent correlation coefficients, above 0.92 for all modes of operation, which means that the linear representation is a good approximation of the relationship between temperature difference across the heat exchanger and the ambient DBT. This behavior aligns with expectations from the psychrometric chart, whereby the wet-bulb depression, i.e., the difference between the ambient DBT and the corresponding ambient WBT, increases with increasing ambient DBT. The wet-bulb depression represents the potential for EC to occur.
4.2 Temperature difference variation with ambient temperature at a relative humidity range of 20-40%
The performance of the FAHU in terms of the change of temperature difference across the heat exchanger, for different modes of operation and relative humidity of 20-40% is presented in Figure 5. Comparison of Figure 4 and Figure 5 shows that as the relative humidity increases, the effect of EC on the temperature difference decreases. Figure 5 shows that temperature differences of 11.65 and 14.22℃ are recorded for ambient temperatures of 37.3 and 41.2℃, respectively, for water shower mode of operation. However, slightly higher temperature differences of 12.58 and 14.28℃ are obtained with the combined mist injection and water shower mode of operation for ambient temperatures of 37.3 and 41.2℃, respectively. A linear regression representation of the temperature difference across the heat exchanger as a function of ambient DBT for the experimental range gave excellent correlation coefficients, above 0.93, for all the modes of operation.
Figure 4. Temperature difference variation for relative humidity less than 20% with different modes of operation
Figure 5. Temperature difference variation for relative humidity range 20-40% with different modes of operation
4.3 The effect of high relative humidity on the temperature difference
The change of the temperature difference across the heat exchanger for different modes of operation for relative humidity greater than 40% is presented in Figure 6. Direct representation of the temperature difference across the heat exchanger as a function of ambient DBT for the experimental range gave excellent correlation coefficients, above 0.94 in all cases. For the experimental temperature range of 26-44℃, the water shower mode of operation and combined water shower and mist injection achieve higher temperature reductions across the heat exchanger than the mist injection mode. The water shower mode of operation is observed to be the most efficient mode of operation for these conditions. For the temperature range of 26-44℃, the water shower mode of operation achieved the minimum and maximum temperature reductions across the heat exchanger of 5.93 and 12.62℃, respectively.
Figure 6. Temperature difference variation with a relative humidity greater than 40% in different modes of operation
The temperature differences across the heat exchanger are calculated for each mode of operation from the linear regression equations obtained by modeling and curve fitting the experimental data. The results are then used to identify which mode of operation would provide the best performance in terms of temperature reduction across the heat exchanger.
It is found that when ambient relative humidity is less than 20%, the water shower mode of operation provides higher temperature reductions across the heat exchanger than the other two modes. For ambient relative humidity in the range, 20-40%, the combined mist injection and water shower mode of operation is the best performing for maximizing the temperature reduction across the heat exchanger until the ambient DBT reaches 42℃, above which the water shower mode provides higher temperature reductions than the combined mist injection and water shower mode.
In conditions when the ambient relative humidity is higher than 40%, again the water shower becomes the best mode to operate in, to maximize temperature reduction across the heat exchanger.
4.4 Temperature difference variation with relative humidity at ambient temperatures between 28℃ and 40℃
In the case of ambient temperature between 28℃ and 40℃, the ambient relative humidity effect on the temperature difference for the different modes of operation is presented in Figure 7. The combined mist injection and water shower mode are more effective than the water shower and the mist injection modes operating separately.
It was found that for the mist injection mode of operation, the temperature reduction across the heat exchanger improved slightly as ambient relative humidity increased. The improvement in temperature reduction across the heat exchanger as relative humidity increases is contrary to what was expected. A possible reason for the observed unexpected trend of the mist injection mode of operation is the relatively low number of data points obtained for this mode of operation. However, for the water shower and the combined mist injection and water shower modes of operation, as expected and for reasons previously stated, the temperature reduction achieved across the heat exchanger reduced with increasing ambient relative humidity. The highest temperature reduction achieved by the combined mist injection and water shower mode of operation is found to be 15℃ at a relative humidity of 22%, which gradually reduces to 11.8℃ when the ambient relative humidity reaches 42%. These values compare very well with the published data, where a maximum reduction in the temperature difference was 7.1 to 13.9℃ [7], and 11.6 [28]. Linear regression representation of the temperature reduction as a function of ambient relative humidity for the experimental range gave correlation coefficients of 0.9554, 0.9505, and 0.8134, respectively, for the water shower, mist injection, and combined mist injection and water shower modes of operation.
Figure 7. Temperature difference variation with relative humidity for ambient temperature between 28-40℃ with different modes of operation
4.5 FAHU water consumption assessments
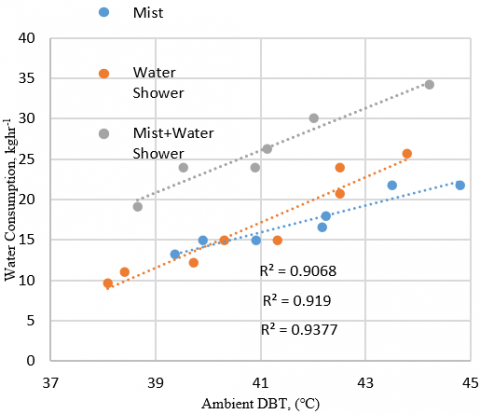
The water consumption of the EC cycle in the FAHU depends on ambient temperature, relative humidity, water retention properties of the heat exchanger, and the mode of operation. This study considered only the ambient conditions and mode of operation in the assessments of water consumption of the FAHU. The variation of the water consumption of the FAHU with ambient DBT at a relative humidity of 25% is shown in Figure 8. As expected, the combined mist injection and water shower mode have the highest water consumption amongst the three modes of operation. It was also found that for ambient DBT higher than 40℃, the mist injection mode performs better than the water shower mode. The difference in water consumption between these two modes progressively increases with increasing ambient DBT. On the other hand, for ambient temperatures lower than 40℃, the water shower mode performs better than the mist injection mode when these two modes operate separately. Linear regression representation of the water consumption as a function of ambient DBT for the experimental range gave excellent correlation coefficients, above 0.90 for all modes of operation.
Figure 8. Water consumption variation with ambient temperature for different modes of operation
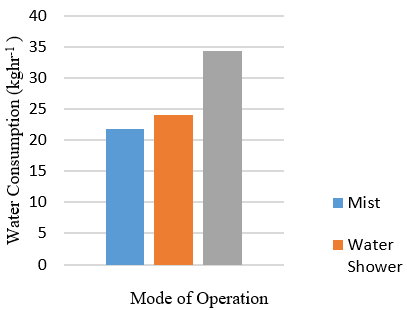
A notional dry condition design point referred to as the peak DBT design condition (ambient temperature of 45℃ and 10% relative humidity) was arbitrarily selected for comparison of the water consumption of the three modes of operation of the FAHU. The water consumption of the FAHU for various modes of operation at the peak DBT design condition was determined from experimental measurements, and these are shown in Figure 9. The highest water consumption of 34.29kgh-1and the lowest of 21.82kgh-1 was recorded for the combined mist injection and water shower, and the mist injection mode of operation, respectively.
Figure 9. Water consumption comparison for different modes of operation at 45℃ and 10% RH
The difference in water consumption between the water shower and the mist injection modes of operation at the peak DBT design condition is 2.18 kg.h-1, while the difference between the water shower and the combined mist injection and water shower modes is 10.29 kg.h-1. These differences could be a massive quantity of water if the FAHU operated in dry conditions for prolonged periods. It was stated earlier that when ambient relative humidity is less than 20%, the water shower mode of operation provides higher temperature reductions across the heat exchanger than the other two modes. Hence, for optimizing the FAHU as a whole, it is logical that a compromise is established between the conflicting demands of water consumption and temperature reduction across the heat exchanger for the FAHU in ambient conditions of relative humidity less than 20%. Depending on the degree of overall benefit, it may be more practical to operate the FAHU in the mist injection mode, which has a lower water consumption rate under these conditions.
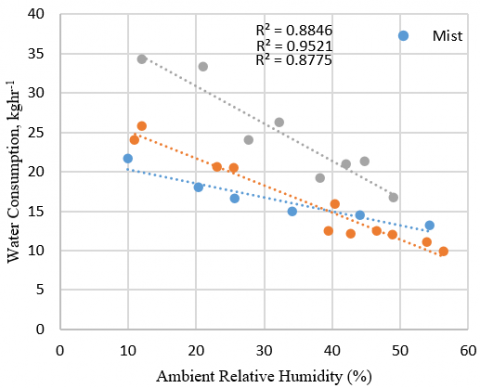
The variation of the water consumption of the FAHU with ambient relative humidity is shown in Figure 10. As the relative humidity increases, the evaporation rate of water decreases, and the water consumption decreases. As expected, the combined mist injection and water shower mode have the highest water consumption amongst the three modes of operation. It was also found that for ambient relative humidity higher than 40%, the water shower mode performs better than the mist injection mode from the angle of water consumption. The difference in water consumption between these two modes progressively increases with increasing ambient relative humidity. On the other hand, for ambient relative humidity lower than 40%, the mist injection mode performs better than the water shower mode, from a water consumption perspective, when these two modes operate separately. Linear regression representation of the water consumption as a function of ambient relative humidity for the experimental range gave good correlation coefficients above 0.87 for all modes of operation of the FAHU.
Figure 10. Water consumption variation with ambient relative humidity for different modes of operation at 45℃ and 10% RH
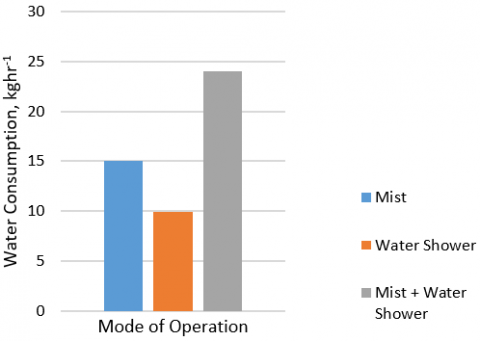
Similarly, a notional wet condition design point referred to as the peak WBT design condition (ambient temperature of 40℃ and 60% relative humidity) was arbitrarily selected for comparison of the water consumption of the three modes of operation of the FAHU. The water consumption of the FAHU for the various modes of operation at the peak wet-bulb design condition was determined from experimental measurements, and these are shown in Figure 11. For these conditions, the highest water consumption of 24 kg.h-1 was recorded for the combined mist injection and water shower mode of operation, while the lowest was 9.9 kg.h-1 for the water shower mode of operation mode.
Figure 11. Water consumption comparison for different modes of operation at 40℃ and 60% RH
It was found earlier that when ambient relative humidity is higher than 40%, the water shower mode of operation provides higher temperature reductions across the heat exchanger than the other two modes. Hence, for optimizing the FAHU as a whole, it is clear that the water shower mode of operation provides the best performance from the angles of water consumption and temperature reduction across the heat exchanger for the FAHU in ambient conditions of relative humidity greater than 40%.
4.6 FAHU energy consumption assessments
The energy-saving potential of EC makes it attractive to use in ventilation and air conditioning applications. This study assessed the energy consumptions of the various modes of operation of the investigated FAHU at the notional peak DBT and WBT design conditions described earlier. The energy consumptions of the various modes of operation of the FAHU at the peak DBT design condition were determined from experimental measurements, and these are shown in Figure 12. The highest energy consumption of 2.7 kWh was recorded for the combined mist injection and water shower mode, while the lowest of 1.64kWh was recorded for the water shower mode operating separately.
Figure 12. Energy consumption comparison for different modes of operation at 45℃ and 10% RH
At peak DBT design condition, the water shower has the lowest energy consumption amongst the different modes of operation. Further, it was stated earlier that when ambient relative humidity is less than 20%, the water shower mode of operation provides higher temperature reductions across the heat exchanger than the other two modes. Hence, for optimizing the FAHU as a whole, it is clear that the water shower mode of operation provides the best benefits in terms of both energy consumption and temperature reduction across the heat exchanger, in ambient conditions of relative humidity less than 20%.
Similarly, the energy consumptions of the various modes of operation of the FAHU for the peak WBT design condition were determined from experimental measurements, and these are shown in Figure 13. For these conditions, the highest energy consumption of 2.83kWh was recorded for the combined mist injection and water shower mode of operation, while the lowest of 1.86kWh was recorded for the water shower mode of operation mode.
Figure 13. Energy consumption comparison for different modes of operation at 40℃ and 60% RH
At peak WBT design condition, the water shower has the lowest energy consumption amongst the different modes of operation. Further, it was stated earlier that when ambient relative humidity is higher than 40%, the water shower mode of operation provides higher temperature reductions across the heat exchanger than the other two modes. Hence, for optimizing the FAHU as a whole, it is clear that the water shower mode of operation provides the best benefits in terms of both energy consumption and temperature reduction across the heat exchanger, in ambient conditions of relative humidity greater than 40%.
4.7 The selection of the process control logic of the FAHU
The theoretically desired ideal cooling performance of the FAHU under given ambient conditions would result if the highest temperature reduction across the heat exchanger, lowest water consumption, and lowest energy consumption co-occurred. However, it is seen from the results of this study that no single mode of operation would provide peak values of these attributes in all ambient conditions.
Therefore, based on the analysis of the experimental data, a preferred process control logic of operation is determined for the FAHU when operating in various ambient conditions. The preferred process control logic of operation takes into account the temperature reduction across the heat exchanger, water consumption, and energy consumption of the various modes of operation. It identifies the most effective mode of operation, which would maximize cooling performance.
The results suggest that, for a low ambient relative humidity of less than 20%, the water shower mode should be implemented. For ambient relative humidity between 20% and 40%, the combined mist injection and water shower mode are the most effective. Whereas for relative humidity higher than 40%, the water shower mode is more effective than the other two modes.
On the other hand, for ambient DBT of less than 28℃, the water shower mode should be implemented. The combined mist injection and water shower mode are also suggested for ambient DBT higher than 20℃.
In order to refine the process control logic and make it more comprehensive, detailed quantitative assessments, which take into account the three cooling performance variables (i.e., temperature reduction across the heat exchanger, water consumption and energy consumption), of the benefits provided by each mode of operation under given ambient conditions are needed.
In the present work, an experimental investigation of the performance of a DIEC FAHU is presented for harsh ambient conditions experienced in Qatar. The ambient temperature, relative humidity, water, and energy consumptions were recorded and analyzed for the period from August 2018 to July 2019.
For the range of the experimental data considered, it was found that the highest temperature reduction of 18.8℃ was achieved across the heat exchanger for the tested FAHU when the water shower mode was implemented at ambient DBT of 44℃ and relative humidity less than 20%. At these conditions, the mist injection mode and the combined mist injection and water shower mode achieved temperature reductions of 12.84℃ and 18.32℃, respectively.
The results from the tested FAHU showed that water consumption increased with increasing ambient DBT. For the peak DBT design condition, the mist injection mode had a water consumption of 21.82 kg.h-1, which reduced to 15 kg.h-1 at the peak WBT design condition. The water shower mode of operation had a water consumption of 24 kg.h-1 and 9.9 kg.h-1 for the peak DBT and peak WBT design conditions, respectively.
The energy consumptions for the various modes of operation were compared at two design conditions, i.e., a peak DBT condition (45℃, 10% RH) and a peak WBT condition (40℃, 60%RH). The lowest energy consumption of 1.64 kWh occurred with the water shower mode operated at peak DBT design condition. On the other hand, the energy consumptions for the mist injection mode of operation were 1.89 kWh and 2.15 kWh for the peak DBT and peak WBT design conditions, respectively. At these design conditions, the energy consumptions of the combined mist injection and water shower mode of operation were 2.7 kWh and 2.83 kWh, respectively.
θp, in Primary air inlet DBT ( $^{\circ} \mathrm{C}$ )
θs, in Secondary air inlet DBT ( $^{\circ} \mathrm{C}$ )
θp, out Supply air DBT ( $^{\circ} \mathrm{C}$ )
θs, out Secondary air outlet DBT/Exhaust temperature ( $^{\circ} \mathrm{C}$ )
θp, out, HE Primary air outlet DBT after heat exchanger ( $^{\circ} \mathrm{C}$ )
θs, out, HE Secondary air outlet DBT after heat exchanger ( $^{\circ} \mathrm{C}$ )
θp, in, wb Primary air inlet WBT ( $^{\circ} \mathrm{C}$ )
∆θp Primary air stream DBT difference ( $^{\circ} \mathrm{C}$ )
∆θs Secondary air stream DBT difference ( $^{\circ} \mathrm{C}$ )
∆Xp Primary air stream humidity ratio difference (gkg-1)
∆Xs Secondary air stream humidity ratio difference (g.kg-1)
$\varepsilon_{\mathrm{db}}$ & $\varepsilon_{\mathrm{wb}}$ Dry & Wet Bulb Effectiveness of heat exchanger
ṁw,in Water Flow rate – water shower (kg s-1m-2)
DBT Dry bulb temperature
DEC Direct Evaporative Cooling
E/A Exhaust Air
EAF Exhaust Air Fan
EC Evaporative Cooling
FAHU Fresh Air Handling Unit
IEC Indirect Evaporative Cooling
IDEC Indirect/Direct Evaporative Cooling
HEX Heat Exchanger
S/A Supply Air
SAF Supply Air Fan
WBT Wet bulb temperature
[1] Alshahrani, J., Boait, P. (2019). Reducing high energy demand associated with air conditioning needs in Saudi Arabia. Energies, 12(1): 87. https://doi.org/10.3390/en12010087
[2] Elakhdar, M., Tashtoush, B., Nehdi E., Kairouani, L. (2018). Thermodynamic analysis of a novel Ejector Enhanced Vapor Compression Refrigeration (EEVCR) cycle. Energy, 163: 1217-123. https://doi.org/10.1016/j.energy.2018.09.050
[3] Tashtoush, B., Nayfeh, Y. (2020). Energy and economic analysis of a variable-geometry ejector in solar cooling systems for residential buildings. J. Energy Storage, 27: 101061. https://doi.org/10.1016/j.est.2019.101061
[4] Al Horr, Y., Tashtoush, B., Chilengwe, N., Musthafa, M. (2020). Operational mode optimization of indirect evaporative cooling in hot climates. Case Studies in Thermal Engineering, 18: 100574. https://doi.org/10.1016/j.csite.2019.100574
[5] Tashtoush, B., Al-Oqool, A. (2019). Factorial analysis and Experimental study of water-based cooling system effect on the performance of Photovoltaic module. International Journal of Environmental Science and Technology, 16: 3645-3656. https://doi.org/10.1007/s13762-018-2044-9
[6] Yu, F.W., Ho, W.T., Chan, K.T., Sit, R.K.Y. (2018). Theoretical and experimental analyses of mist injection pre-cooling for an air-cooled chiller. Applied Thermal Engineering, 130: 112-119. https://doi.org/10.1016/j.applthermaleng.2017.11.046
[7] Al-Zubaydi, A.Y., Hong, G. (2019). Experimental study of a novel water-spraying configuration in indirect evaporative cooling. Applied Thermal Engineering, 151: 283-293. https://doi.org/10.1016/j.applthermaleng.2019.02.019
[8] Al Horr, Y., Tashtoush, B., Chilengwe, N., Musthafa, M. (2019). Performance assessment of a hybrid vapor compression and evaporative cooling fresh-air-handling unit operating in hot climates. Processes, 7(12): 872. https://doi.org/10.3390/pr7120872
[9] Ibrahim, E., Shao, L., Riffat, S. (2003). Performance of porous ceramic evaporators for building cooling applications. Energy and Buildings, 35(9): 941-949. https://doi.org/10.1016/S0378-7788(03)00019-7
[10] Malli, A., Seyf, H.R, Layeghi, M., Sharifian, S., Behravesh, H. (2011). Investigating the performance of cellulosic evaporative cooling pads. Energy Conversion Management, 52(7): 2598-2603. https://doi.org/10.1016/j.enconman.2010.12.015
[11] Franco, A., Valera. D.L, Pena. A. (2014). Efficiency in greenhouse evaporative cooling techniques: Cooling boxes versus cellulose pads. Energies, 7(3): 1427-1447. https://doi.org/10.3390/en7031427
[12] Poku, R., Oyinki, T., Ogbonnaya, E. (2017). The effects of evaporative cooling in tropical climate. American Journal of Mechanical Engineering, 5(4): 145-150. https://doi.org/10.12691/ajme-5-4-5
[13] Amer, O., Boukhanouf, R., Ibrahim, H.G. (2015). A review of evaporative cooling technologies. International Journal of Environmental Science and Development, 6(2): 111-117. https://doi.org/10.7763/IJESD.2015.V6.571
[14] Al Fahed, S.F., Alasfour, F.N., Quadri, M.A. (2014). Pottery evaporative cooling system: A novel approach to cool inlet air with minimal change in relative humidity and low water consumption. Experimental Heat Transfer, 27(2): 144-159. https://doi.org/10.1080/08916152.2012.757675
[15] Ndukaife, T.A., Nnanna, A.G.A. (2019). Optimization of water consumption of hybrid evaporative cooling air conditioning systems for Data Centre cooling applications. Heat Transfer Engineering, 40(7): 559-573. https://doi.org/10.1080/01457632.2018.1436418
[16] Morgado, B.I., Melero, T.S., Neila, G.J., Acha, R.C. (2011). Evaporative cooling efficiency according to climate conditions. Procedia Engineering, 21: 283-290. https://doi.org/10.1016/j.proeng.2011.11.2016
[17] Gomez, E.V., Martinez, F.J.R., González, T.A. (2012). Experimental characterization of an indirect evaporative cooling prototype in two operating modes. Applied Energy, 97: 340-346. https://doi.org/10.1016/j.apenergy.2011.12.065
[18] Heidarinejad, G., Bozorgmehr, M., Delfani, S., Esmaeelin, J. (2009). Experimental investigation of two-stage indirect/direct evaporative cooling system. Building and Environment, 44(10): 2073-2079. https://doi.org/10.1016/j.buildenv.2009.02.017
[19] De Antonellis, S., Joppolo, C.M., Liberati, P. (2019). Performance measurement of a cross-flow indirect evaporative cooler: Effect of water nozzles and airflows arrangement. Energy & Buildings, 184: 114-121. https://doi.org/10.1016/j.enbuild.2018.11.049
[20] Farnham, C., Nakao, M., Nishioka, M., Nabeshima, M., Mizuno, T. (2015). Effect of water temperature on evaporation of mist injection sprayed from a nozzle. Journal of Heat Island Institue International, 10: 35-44.
[21] Tashtoush, B., Tahat, M., Al-Hayajneh, A., Mazur, V.A., Probert, D. (2001). Thermodynamic behavior of an air conditioning system employing combined evaporative-water air coolers. Applied Energy, 70: 305-319. https://doi.org/10.1016/S0306-2619(01)00039-3
[22] Porumb, B., Unguresan, P., Tutunaru, L.F., Serban, A., Balan, M. (2016). A review of indirect evaporative cooling operating conditions and performances. Energy Procedia, 85: 452-460. https://doi.org/10.1016/j.egypro.2015.12.226
[23] Guo, X.C., Zhao, T.S. (1998). A parametric study of an indirect evaporative air cooler. Int. Comm. Heat Mass Transfer, 25(2): 217-226. https://doi.org/10.1016/S0735-1933(98)00008-6
[24] Delfania, S., Esmaeeliana, J., Pasdarshahrib, H., Karamia, M. (2010). Energy saving potential of evaporative cooler as a pre-cooling unit for mechanical cooling systems in Iran. Energy Build, 42: 2169-2176. https://doi.org/10.1016/j.enbuild.2010.07.009
[25] Chauhan, S.S., Rajput, S.P.S. (2015). Thermodynamic analysis of the evaporative-vapour compression based combined air conditioning system for hot and dry climatic conditions. Journal of Building Engineering, 4: 200-208. https://doi.org/10.1016/j.jobe.2015.09.010
[26] Suryawanshi, S.D., Chordia, T.M., Nenwani, N., Bawaskar, H., Yambal, S. (2011). Efficient technique of air-conditioning. Proceedings of the World Congress on Engineering Vol (iii) (2011) London UK.
[27] Bora, Y.R., Bhosale, S.D., Ghandi, K.N., Ghandi, T.S. (2017). Performance improvement techniques for evaporative air cooler – a review. International Journal of Engineering Research & Technology, 6(3): 379-382.
[28] Comino, F., Milani, S., De Antonellis, S., Joppolo, C.M., De Adana, M.R. (2018). Simplified performance correlation of an indirect evaporative cooling system: Development and validation. International Journal of Refrigeration, 88: 307-317. https://doi.org/10.1016/j.ijrefrig.2018.02.002
[29] Kim, M.H., Jeong, J.W. (2013). Cooling performance of a 100% outdoor air system integrated with indirect and direct evaporative coolers. Energy, 52: 245-257. https://doi.org/10.1016/j.energy.2013.02.008
[30] Chauhan, S.S., Rajput, S.P.S. (2016). Parametric analysis of a combined dew-point evaporative-vapour compression-based air conditioning system. Alexandria Engineering Journal, 55(3): 2333-2344. https://doi.org/10.1016/j.aej.2016.05.005
[31] Maheshwari, G.P., Al Ragom, F., Suri, R.K. (2001). Energy saving potential of an indirect evaporative cooler. Applied Energy, 69(1): 69-76. https://doi.org/10.1016/S0306-2619(00)00066-0
[32] Niranjan, B. (2018). Psychrometric analysis of indirect evaporative cooling based dedicated outdoor air system for Indian cities with different climatic conditions. International Journal of Engineering Research, 7(11): 187-189.
[33] Chen, Y., Luo, Y., Yang, H. (2014). Fresh air pre-cooling and energy recovery by using indirect evaporative cooling in hot and humid region – a case study in Hong Kong. Energy Procedia, 61: 126-130. https://doi.org/10.1016/j.egypro.2014.11.922
[34] Ghiabaklou, Z. (2010). Climatic range for comfort evaporative cooling. World Academy of Science, Engineering and Technology. International Journal of Architectural and Environmental Engineering, 4(8) (2010).
[35] Baca, M.I., Tur, M.S., Gonzalez, N.J., Román, A.C. (2011). Evaporative cooling efficiency according to climate conditions. Procedia Engineering, 21: 283-290. https://doi.org/10.1016/j.proeng.2011.11.2016
[36] Cui, X., Chua, K.J., Islam, M.R., Ng, K.C. (2015). Performance evaluation of an indirect pre-cooling evaporative heat exchanger operating in hot and humid climate. Energy Conversion and Management, 102: 140-150. https://doi.org/10.1016/j.enconman.2015.02.025