Feng Xu | Xin Chen | Hongxi Zhang | Yongjiang Shi*
© 2020 IIETA. This article is published by IIETA and is licensed under the CC BY 4.0 license (http://creativecommons.org/licenses/by/4.0/).
OPEN ACCESS
This paper aims to study the winter heating performance of the air source heat pump (ASHP) system in cold regions. To this end, a winter operation performance test platform of the ASHP was built in an office building of a university in Zhangjiakou area. In the heating season of 2017-2018, the field test on performance parameters such as heating capacity and power consumption of the ASHP system were conducted. The results showed that the ASHP system used in the test can operate normally in extremely cold weather conditions in Zhangjiakou area; the indoor temperature during the ASHP operation meets the winter heating requirements; the coefficient of performance (COP) during the deep cold period was between 1.32 and 3.29; with the outdoor temperature reduced, the heat pump defrosting and oil return process is one of the main factors for energy consumption increase; when the outdoor temperature is high, 10-hour operating mode can save more power compared to the full-day operation; when the outdoor temperature is low, it does not necessarily save more. The research findings provide a valuable reference for the application and improvement of the ASHPs in cold regions.
cold region, ASHP, operating performance, field test, COP
The ASHP is a cold and heat source device of the heating, ventilating and air conditioning (HVAC) system with outdoor air as the heat source side energy-carrying medium [1]. Due to its characteristics such as simple structure, convenient installation, low manufacturing cost, dual-purpose cooling and heating, high efficiency, energy saving, and environmental protection, etc. [2-5], the ASHP has a promising development prospects.
However, there are some problems with the ASHP under the heating operating conditions in cold regions, e.g., with the low volumetric efficiency of the compressor, the excessive low evaporating pressure leads to an increase in the suction specific volume, and then the mass flow of refrigeration system, and the unit heat supply are reduced [6, 7]; When the outdoor temperature is low and the relative humidity is too high, the outdoor heat exchanger is prone to frosting, which deteriorates the heat exchange, resulting in a sudden decrease in heat supply and even a shutdown phenomenon [8, 9]. In order to improve the low-temperature adaptability of the ASHP, domestic and foreign scholars and enterprises have carried out many related technology research and development, launched a variety of ASHP solution under low temperature, and conducted related testing experiments [10-14]. For example, Deng et al. [15] conducted a comparison test of the heating performance between the single-stage compression and double-stage enthalpy-adding compression rotor-type low-temperature ASHP units, which showed that the COP of the double-stage compression low-temperature unit was about 22% -40% higher than the other type; Hakkaiki-Fard et al. [16] studied the replacement of the working medium of the heat pump, and used the azeotropic refrigerant mixture to improve the performance of the ASHP in cold regions; Ma et al. [17] performed the heating experiments in rural houses in Beijing using the ASHP of two-stage enthalpy-adding compression rotor type and hot air type under low temperature; the results showed that the ASHP can operate normally under the outdoor temperature conditions in winter in Beijing and create a suitable room temperature. Thus, there have been a lot of valuable research results about the heat supply of low-temperature AHSP. However, the research on the actual application effect of the ASHP in Zhangjiakou and other cold regions is still insufficient, due to many uncertainties in the use of the AHSP for heating in these regions.
This study attempts to explore the actual application effect of the ASHPs in cold regions such as Zhangjiakou. For this, it built an operation performance test platform of the multi-split ASHP system in the office building of a college in Zhangjiakou during the heating season 2017-2018. Then, the field test was conducted on the actual heating performance from the aspects of indoor and outdoor environment (temperature and humidity), unit inlet and outlet parameters (wind temperature and wind speed), system power consumption, heating capacity, and COP etc. The technical feasibility and applicability of this ASHP system in the cold region were analyzed. The research results are of great significance for expanding the application range of the ASHPs in cold regions of China.
2.1 Building overview
The test buildings were three offices on the south side of the second floor of an office building in Zhangjiakou City. Each office is 8m long, 7.5m wide and 4m high, with a total building area of 180m2; the south wall is the outer wall, and the rest are the inner wall; the north inner wall connects the corridor. Each room has a total of 6 south outer double-glass windows, which are 1.45m high and 1.15m wide. The outer wall and top layer are well insulated. All meet the requirements of relevant building heating design specifications.
2.2 Test object
The test object is a multi-split ASHP system, with a rated heating capacity of 45kW, and a heating power consumption of 10.7kW. There are a total of 3 embedded indoor units with full-round wind. Using a turbo-fan, they can be operated silently, and a PM2.5 electrostatic dust filter was installed at the return air inlet to circulate and filter the indoor air. The test used a scroll compressor with the high and medium pressure chamber that adopts the DC frequency conversion technology. It’s also equipped with intelligent touch manager, connecting indoor unit and outdoor unit, and setting parameters such as temperature and running time etc., thereby achieving energy efficient control. The outdoor unit was installed on the south-facing terrace on the second floor of the office building, with good ventilation and lighting.
Figure 1 shows the principle of the system under test.
Figure 1. Schematic diagram of the multi-split ASHP system structure
The calculated outdoor temperature of Zhangjiakou in winter is -13.6℃, and the average outdoor temperature in the heating season is -3.9℃. The coldest month is January, the average humidity is 41%, and the heating period starts from November for a total of 146 days. To investigate the winter operation performance of the multi-spit ASHP system in cold regions such as Zhangjiakou, the field test was conducted on the system from November 4, 2017 to March 31, 2018. During the test, the power consumption of the system was measured and recorded hourly using a multi-function intelligent electric meter; the heating capacity was measured by the outlet sampling method of indoor unit, that is, by measuring the indoor unit inlet and outlet air volume and the heating capacity of wind temperature computer group.
3.1 Measuring points’ arrangement and test instruments
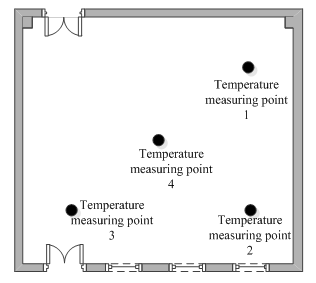
During the test, real-time monitoring and recording were performed for the indoor and outdoor ambient temperature, wind speed and humidity, as well as the wind temperature, wind speed and heat consumption at the fan coil outlet of the indoor unit. Among them, the measuring points of indoor temperature were arranged according to the provisions of the Evaluation Standards for Indoor Thermal and Humid Environment of Civil Buildings (GB/T50785-2012), i.e., select the three equal diversion points on the diagonal of the test area and arrange them at the location 1.5m from the ground and 1m from the wall where few people walk along and has no door and window, as shown in Figure 2.A temperature sensor and a temperature and humidity tester were arranged in a well ventilated outdoor space about 1.5 meters from the ground to measure the outdoor temperature and humidity, respectively. Temperature sensors were also arranged at the four air outlets and return air outlets of the fan coil in the indoor unit, and a wind speed recorder was arranged at the air outlet of the fan coil. The temperature sensor and wind speed recorder were connected to the paperless recorder, which is used for collection and storage with the data collection period of 30S. Table 1 lists the parameters of test instruments.
In order to ensure the measurement accuracy, all test instruments were calibrated before the test, e.g., all temperature sensors were calibrated with a laboratory standard thermometer, and the error was within ±0.3℃, which meets the test requirements.
Table 1. Parameters of main test instruments
|
Instruments |
Model |
Scope |
Accuracy |
|
Multi-function intelligent electric meter |
DTS-253 |
Class 1 |
|
|
Wind speed recorder |
8465-150-1VR003 |
0.125-50m/s |
±5% |
|
Temperature sensor |
PT100 |
-50~+200℃ |
±0.3℃ |
|
Digital temperature-humidity tester |
Testo635-1 |
-20~70℃ 0~100%RH |
±0.5℃ ±3% |
|
Paperless recorder |
YOKOGAWAP20 |
Figure 2. Layout of indoor temperature measuring points
3.2 Test plan
The test plan was developed by changing the system's operating time and indoor temperature in order to test the system heating performance under different working conditions as much as possible, and to ensure each working condition within a wider outdoor temperature range. Considering that the test building is an office building, and has no people staying at night, the operating conditions are divided into two situations: all-day operation and 10-hours operation.
(1) Nov 4-Jan 2: 24 hours a day, and the indoor set temperature of 20℃;
(2) Jan 3- 27: 24 hours a day, and the indoor set temperature of 22℃;
(3) Jan 28-Feb 10: 10 hours from 8: 00-18: 00, and the indoor set temperature of 20℃;
(4) Feb 11-Mar 31: 10 hours from 8: 00-18: 00, and the indoor setting temperature of 22℃.
3.3 Test data processing
(1) Unit power consumption
A separate power meter was configured for the unit to measure the power consumption and accurately obtain the power consumption. The multi-function intelligent electric meter DTS-253 with Class 1 accuracy was applied to measure and record the power consumption Ni hourly.
(2) System heat supply
The heat supply of the system was calculated using the air volume and the inlet and outlet wind temperature of the fan coil. The instantaneous heat supply of the unit at the moment i is:
${{Q}_{i}}={{{C}_{p}}\cdot {{v}_{i}}\cdot A\cdot \rho \cdot \left( {{t}_{c,i}}-{{t}_{h,i}} \right)}/{3600}\;$
where: Qi is the instantaneous heat supply (kW⸱h) of the unit at the moment i, Cp is the constant pressure specific heat capacity of the air (kJ/(kg·K)), vi is the wind speed (m/s) of the fan coil outlet at the moment i, $v_{i}=\frac{1}{n} \sum_{1}^{n} v_{j}$ by taking the average value at the measuring points of all wind speeds at that moment, A is the cross-sectional area (m2) of the air outlet of the fan coil, ρ is the air density (kg/ m3), tc,i and th,i are the temperature (℃) of the air outlet and return air of the fan coil at i.
The cumulative heat supply of the unit in time $\tau_{0}$ is given as:
${{Q}_{\tau }}=\int\limits_{0}^{{{\tau }_{0}}}{\frac{1}{3600}{{C}_{p}}\cdot {{v}_{i}}\cdot A\cdot \rho \cdot \left( {{t}_{c,i}}-{{t}_{h,i}} \right)}d\tau $
where, τ is time (s). The above formula shows that the cumulative heat supply of the unit can be calculated in any length of time.
(3) COP of the heat pump
The COP is defined as the ratio of the unit's heating capacity to the power consumption, and is an important indicator to measure the operating performance of the ASHP.
$CO{{P}_{i}}=\frac{{{Q}_{i}}}{{{N}_{i}}}$
where, COPi is the COP of the heat pump unit at the moment i, Qi is the heat supply (kW⸱h)of the heat pump unit, and Ni is its power consumption (kW⸱h) in this period.
3.4 Error analysis
Before completing the formal test of the test platform, all the test points were calibrated using the corresponding standard test equipment. After multiple sets of tests, the relative errors of all test points were within ± 5%, meeting the test requirements.
During the test period of the ASHP system, continuous operation and intermittent operation were conducted in different time periods at the indoor temperature settings of 20℃ and 22℃, respectively, to obtain the heating experiment data for the entire heating season. The study selected several sets of typical experimental data to analyze the heating performance of the system in winter. According to the design rules of heating, ventilation and air conditioning, the indoor design temperature range of heating in cold regions is 18-24℃. Therefore, in this paper, when the indoor heating temperature reaches 18℃ or above, it’s considered to meet the indoor heating demands.
4.1 Analysis of indoor heating effect
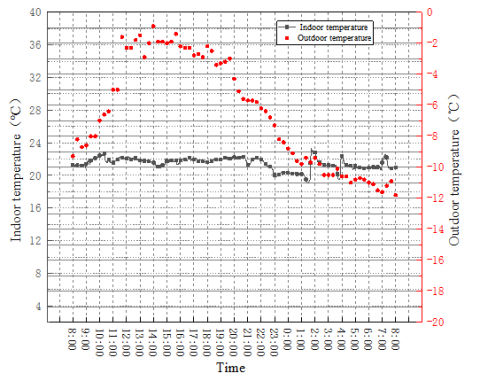
Figure 3 and 4 show the outdoor temperature and indoor temperature variation curves of the heating room during the system operation on January 21 and 27, 2018, respectively.
On Jan. 21, 2018, the weather conditions changed from cloudy to light snow, with a minimum outdoor temperature of -12.1℃, a maximum temperature of -0.9℃, an average temperature of -6.38℃, and an outdoor humidity of 81.2%. The operating conditions of the ASHP were set to be all-day operation and the indoor set temperature of 22°C. It can be seen from Figure 3 that during the time period from 8:00 to 14:00 on Jan. 21, the outdoor temperature gradually increased due to the increase in outdoor solar radiation; from 15:00 to 8:00 on Jan. 22, rain and snow began to appear; at this time, the amount of solar radiation became less, outdoor humidity increased, and the temperature began to fall, while the indoor temperature was basically maintained at 22℃, with almost no fluctuation; at 1:00 a.m. on Jan. 22, the indoor temperature was below 20℃, because there was no one working indoors during this period of time, the amount of free heat in the room became less, and the defrosting or oil return process of the heat pump during this period reduced the room temperature to a small extent, but the average indoor temperature remained at about 21℃ during the entire test period. This shows that the ASHP system under test can still meet the indoor heating requirements in rainy and snowy weather with low average outdoor temperature.
Figure 3. The indoor and outdoor temperature variation curve from 8:00 on the 21st to 8:00 on the 22nd, January
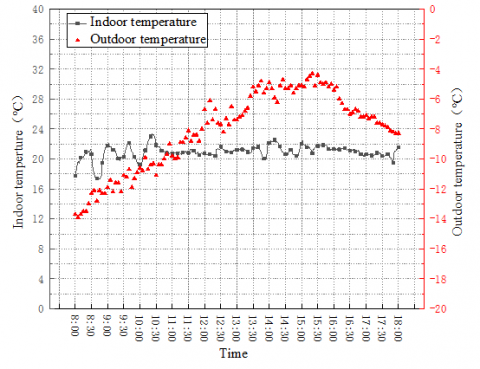
Figure 4. The indoor and outdoor temperature variation curve from 8:00 to 18:00 on the 27th, January
On Jan. 27, 2018, the weather conditions changed from light snow to cloud, with a minimum outdoor temperature of -14℃, a maximum temperature of -4℃, an average temperature of -8.16℃, and the outdoor humidity of 70.1%. Operating conditions of the ASHP were set to the indoor temperature of 20℃and the operating period for ten hours from 8:00 am to 18:00 pm. It can be seen from Figure 4 that when the device was just turned on, the indoor temperature was low, and the indoor temperature gradually increased with time, reaching the indoor set temperature. This shows that when rising to the set temperature, the indoor temperature is basically maintained at about 20℃, which can meet the indoor heating requirements.
4.2 Hourly performance analysis of the unit
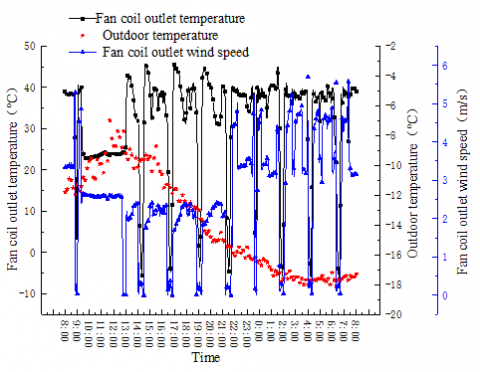
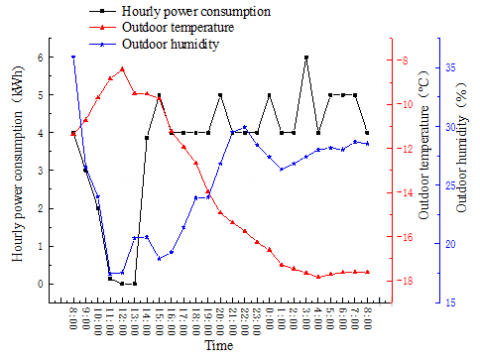
To explore the low-temperature operating performance of the unit, hourly performance analysis was performed on the day when the outdoor temperature was low (8:00 am on January 22, 2018 to 8:00 am on January 23, 2018). The operating condition of the system during this period was 24 hours a day, and the indoor set temperature was 22℃. Figure 5 and 6 shows the changes of fan coil outlet temperature and wind speed, outdoor temperature and humidity, and power consumption of the unit during this period.
Figure 5. The changes of fan coil outlet temperature, wind speed and outdoor temperature with time
Figure 6. The changes of system power consumption, outdoor temperature and humidity with time
It can be seen from Figure 5 that during this period, the outdoor temperature was always below -5℃ and the minimum temperature was -18℃, while the air outlet temperature of the indoor unit was maintained within the range of 30℃-45℃, and the maximum temperature reached 47℃. Starting from 8:00 am on Jan. 22, the outdoor weather turned from cloudy and sunny, the amount of solar radiation increased, and the temperature gradually rose; between 12:00 and 13:00, the outdoor temperature reached the highest; afterwards, the amount of radiation gradually decreased and there was snow outside; the heat absorption during the snow melting process caused the outdoor temperature to decrease linearly. The indoor temperature of the heat pump was set at 22℃.From 8:00 am to 9:00 am on January 22nd, people enter the room one after another, the indoor air changed more frequently, and the temperature was lower, so that the heat pump was in full load heating state, and the wind speed at the air outlet was high, reaching about 5.5m/s, while the temperature of the air outlet was maintained at about 40℃; with the increase of outdoor solar radiation and the number of indoor personnel, as well as the operation of the computer, electric lights and other equipment, the indoor free heat increased, and the heat load of the ASHP was reduced. As shown in Figure 5, the temperature of the air outlet at 9:00-13:00 decreased and maintained at 22℃, while the wind speed was reduced and maintained at about 2.5m/s, the heat pump was in a standby state; from 13:00 to 8:00 the next morning, due to the reduction of solar radiation, coupled with the heat absorption of snowmelt, the outdoor temperature dropped rapidly, the increasing difference between indoor and outdoor temperature resulted in the increase in the indoor heat dissipation, and the heat pump was always in the heating state; from 13:00 to 22:00, the outlet temperature fluctuation range of the indoor unit was 30℃ to 45℃, and the wind speed of the outlet in the indoor unit maintained between 1.5m/s to 2.5m/s; from 22:00 to t 8:00 the next morning, the outlet temperature of the indoor unit fluctuated around 40℃, and its wind speed became larger, fluctuating at 3m/s to 5m/s. This is because during the period from 22:00 to 8:00 in the morning the people were not in the office, and the computers, lights, and other related equipment used were turned off, while the outdoor temperature was lower, which caused an increase in the head load of the ASHP.
It should be noted that there were 9 extreme operating conditions on the temperature curve at the air outlet of the indoor unit, e.g., the minimum air outlet temperature was even lower than 0℃, and the corresponding wind speed was quickly reduced to 0m/s, which is the defrosting or the oil return process of the heat pump. This could take away heat from the room, so the unit's fan stops running at the corresponding time to avoid blowing cold air into the room.
Figure 6 shows that from the perspective of energy consumption, the power consumption of the ASHP was significantly lower in the period of 8:00 to 12:00 on Jan. 22, and it suddenly increased to 5kWh from 13:00 to 15:00, which is because the outdoor temperature started to decrease, the indoor heat loss increased, and the heat pump defrosted or returned oil during this time. From 16:00 to 22:00, the power consumption of the heat pump was maintained at an average of 4kWh per hour, because the large amount of free heat was obtained in this room, and the heating load of the unit wasn’t too large. From 22:00 to 8:00 in the morning of Jan. 23, the heat pump power consumption was maintained at 4kWh to 6kWh per hour. At this time, the outdoor temperature dropped to -18℃, the indoor load increased and the heat pump had the defrosting and oil return process for four times, leading to the most power consumption during this time. In the other days of the heating season, the parameters of the unit changed roughly the same, and only differed slightly in the fan start-stop time according to the outdoor temperatures.
4.3 Daily performance analysis of the unit
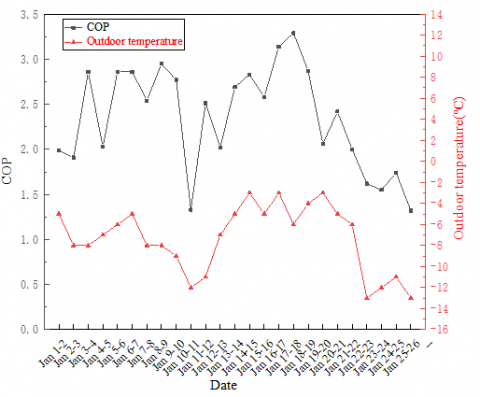
The test data of the deep cold period (Jan. 2 to 26, 2018) was selected to analyze the daily energy consumption and energy efficiency ratio of the unit. The operating condition of the system during this period was 24 hours a day, and the indoor set temperature was 22℃. The daily system heat supply was calculated according to the method of test data processing in 2.3, and the daily COP of computer group was calculated based on the daily power consumption of the system recorded by the smart meter. Figure 7 shows the daily variation curve of the unit COP. Figures 8-10 show the effects of the outdoor average temperature, outdoor maximum humidity, and defrosting time ratio on the unit COP and heat pump power consumption, respectively.
It can be seen from Figure 7 that the variation trend of the outdoor average temperature and the COP was basically the same, that is, as the outdoor average temperature increases or decreases, so does the COP. During the deep cold period from Jan.2 to 26, the maximum value of the unit COP was 3.29 and the minimum value was 1.32. Also, when the average outdoor temperature is less than -10℃, the COP is prone to be less than 2, that is, the outdoor temperature has a greater impact on the working efficiency of the ASHP.
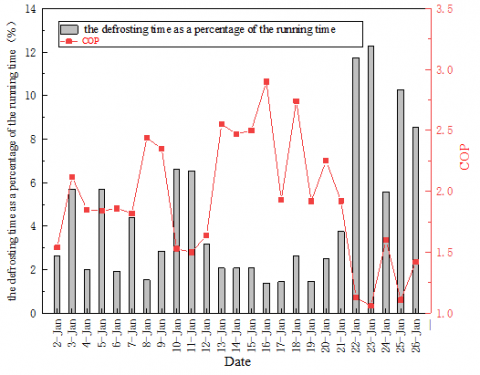
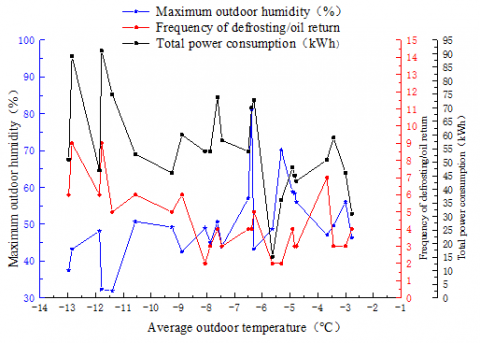
The COP of the unit was affected by the defrosting time of the outdoor heat exchanger. As shown in Figure 8, the longer the defrosting time, the smaller the COP value. When the percentage of defrost time in the operating time decreased, COP showed an upward trend; otherwise, the COP showed a downward trend. From Jan. 13 to 15, the defrosting time accounted for 2.08% of the running time, and the average COP of these three days was 2.5; and from Jan. 22 to 23, Jan. 25 to 26, its percentage was significantly greater than the number of other measured days, and the average COP value for these four days was only 1.18.The data analysis found that the outdoor defrosting time changes with the outdoor temperature and the outdoor maximum humidity. Figure 9 shows that when the outdoor temperature was -5.63℃, and the maximum relative humidity was 48.7%, the shortest defrosting time was 21min; when the outdoor temperature was -12.97℃, and the maximum relative humidity was 37.4%, the longest heat pump defrosting time was 148min. Outdoor temperature reduction is still the main factor for frost formation in outdoor heat exchangers of the heat pump. With the outdoor temperature range -13≤t≤-5℃, the defrosting time increased as the outdoor temperature decreased, and the maximum outdoor relative humidity measured during the test reached about 60%, which is the consistent with the research results of Jiang et al. [18] that the possible range of frosting in the ASHP in winter is -12.8≤t≤-5 ℃, and the relative frosting occurs when the relative humidity reaches 67%.
As the outdoor temperature decreased, the power consumption of the heat pump also increased significantly, as shown in Figure 10. This is because of the increase in the unit operating load under the lowered outdoor temperature and the heat supply. It can also be seen that the variation trend of the ASHP power consumption curve is very similar to that of the defrosting and return oil frequency curve, indicating that the heating efficiency of the ASHP has a great correlation with its defrosting or oil return process. Therefore, the key factor to improving the ASHP heating efficiency is not only to increase the volumetric efficiency of the compressor during operation, but also to reduce its energy consumption during the defrosting and returning oil.
Figure 7. Daily variation curve of COP
Figure 8. The effect of defrosting time on COP
Figure 9. The effects of outdoor daily average temperature and relative humidity on the defrosting time of heat pump
Figure 10. Variation of unit power consumption with outdoor average temperature and humidity
4.4 Analysis for system power consumption under different operating conditions
The operating data in the heating season was collected to analyze the power consumption under different operation conditions. Table 2 lists the power consumption with the same outdoor temperature and indoor temperature under different operation conditions.
Table 2 shows that at the indoor set temperature of 22℃, and the average outdoor temperature of -3, -4℃, the power consumption for 10 hours of operation per day was 10kW·hless than all-day operation; at the outdoor temperature of -9℃, the power consumption for all-day operation was less than 10 hours of operation per day. Comparing 4 and 5 in Table 2, it can be seen that when the indoor set temperature was 20v and the outdoor average temperature was -6 or -9℃, the power consumption for all-day operation was less than that for 10 hours of operation per day.
By comparison it’s found that the power consumption of the system is not only directly related to the outdoor temperature, but also the operation mode. During all day operation, when the temperature-sensing element receives the indoor temperature signal, it’s fed back and compared with the set temperature; if greater than or equal to the set temperature, the heating will be stopped; otherwise, it will start, which can ensure the indoor temperature within the set temperature range. In this operating condition, the system is not running at full load, because there is a period of time to stop heating, and the power consumption during heating is not very large. If the system runs for 10 hours a day, the entire device will stop working after 18:00 in the afternoon. At night, affected by the outdoor temperature, the indoor temperature will gradually decrease in a large degree. To reach the indoor setting temperature the next day, the system needs to run at full load when it starts working at 8:00, and this process consumes a relatively large amount of power. Therefore, with the high outdoor temperature, 10-hour operating mode can save more power compared to the full-day operation; with the low outdoor temperature, it does not necessarily mean it.
Table 2. Comparison of power consumption under different operating conditions
|
No. |
Average outdoor temperature (℃) |
Date |
Operating mode |
Indoor set temperature (℃) |
Power consumption (kW·h) |
|
1 |
-3 |
Feb.14 |
8:00-18:00 |
22 |
34.15 |
|
Jan 14-15 |
All-day (8:00-8:00 next day) |
46.02 |
|||
|
2 |
-4 |
Feb.25 |
8:00-18:00 |
22 |
33.01 |
|
Jan. 18-19 |
All-day (8:00- 8:00 next day) |
50.89 |
|||
|
3 |
-9 |
Feb. 11 |
8:00-18:00 |
22 |
52.02 |
|
Jan. 9-10 |
All-day (8:00- 8:00 next day) |
46.02 |
|||
|
4 |
-6 |
Jan. 31 |
8:00-18:00 |
20 |
38.01 |
|
Dec. 3-4 |
All-day (8:00- 8:00 next day) |
22.01 |
|||
|
5 |
-9 |
Feb. 8 |
8:00-18:00 |
20 |
50.01 |
|
Dec. 11-12 |
All-day (8:00- 8:00 next day) |
33.02 |
This paper attempts to study the winter heating performance of the ASHP system in cold region. For this, it builds a test platform of ASHP heating performance in Zhangjiakou, and performed the field tests on the heating performance of the ASHP system in a complete heating season. The main conclusions have been drawn as follows:
(1) The ASHP system in this test operated normally in extremely cold weather conditions in Zhangjiakou area. On the day when the outdoor temperature was always at -5℃ and the minimum temperature reaches -18℃, the maximum frequency of ASHP defrost or return oil was 9 times, but the ASHP can still maintain the indoor average temperature above 20℃;
(2) From the perspective of energy consumption, the variation curve of total system power consumption is significantly related to the defrosting or oil return frequency curve, indicating that the process of defrosting and oil return is one of the main factors for its energy consumption increase;
(3) During the coldest period in winter (January-February) of Zhangjiakou, the measured COP of the ASHP system was between 1.32 and 3.29; the COP could also be maintained at 1 to 2 in extreme cold weather. It meets the needs of indoor heating, but with a large energy consumption;
(4) The decrease of outdoor temperature is the main factor for frost formation of the outdoor heat exchanger. At the outdoor temperature of -13≤t≤-5 ℃, the defrosting time of the ASHP increased as the outdoor temperature decreases. The COP of the heat pump system showed a downward trend as the defrost time increased as a percentage of the running time.
(5) The power consumption of the system is related to the operating mode and outdoor temperature. With the high outdoor temperature, 10-hour operating mode can save power compared to the full-day operation; with the low outdoor temperature, it does not necessarily save more power than the full-day operation.
The test results showed that the ASHP system can operate normally in cold regions such as Zhangjiakou and meet the heating needs of the building. The COP can be maintained between 1 and 2 in extremely cold weather, and the system energy saving can be achieved by changing the operating mode at different outdoor temperatures. The research findings provide a reference for the popularization and application of the ASHPs in cold regions.
[1] Songhui, A., Chengbin, W., Wenxing, S., Songlin, Z. (2015). Running performance of low-temperature air-source heat pump applied in winter of Beijing. Heating Ventilating & Air Conditioning, 3: 10.
[2] Byrne, P., Miriel, J., Lenat, Y. (2011). Experimental study of an air-source heat pump for simultaneous heating and cooling–part 2: dynamic behaviour and two-phase thermosiphon defrosting technique. Applied Energy, 88(9): 3072-3078. https://doi.org/10.1016/j.apenergy.2011.03.002
[3] Dai, Y.M.B. (2013). Analysis of air-source heat pump for room heating. Refrigeration and Air-Conditioning, 13(7): 6-11.
[4] Ma, G.Y., Chai, Q.H., Jiang, Y. (2003). Experimental investigation of air-source heat pump for cold regions. International Journal of Refrigeration-Revue Internationale du Froid, 26(1): 12-18. https://doi.org/10.1016/S0140-7007(02)00083-X
[5] Sun, X., Guo, K., Zhou, Z.R., Zhang, Y. (2016). System investigation of a solar combined with air-source heat pump system for greenhouse heating. Acta Energiae Solaris Sinica, 37(3): 665-685. https://doi.org/10.3969/j.issn.0254-0096.2016.03.020
[6] Guo, J.J., Wu, J.Y., Wang, R.Z., Li, S. (2011). Experimental research and operation optimization of an air-source heat pump water heater. Applied Energy, 88(11): 4128-4138. https://doi.org/10.1016/j.apenergy.2011.04.012
[7] Wang, F.H., Wang, Z.H., Zheng, Y.X., Hao, J.B. (2013). Research progress and prospect of air source heat pump in low temperature environment. Journal of Refrigeration, 34(5): 47-54. https://doi.org/10.3969/j.issn.0253-4339.2013.05.047
[8] Jiazheng, Z. (2017). Present state and prospect of defrosting method for air source heat pump. Building Energy & Environment, 36(8): 42-46. https://doi.org/10.3969/j.issn.1003-0344.2017.08.011
[9] Yang, B., Dong, J., Zhang, L., Song, M., Jiang, Y., Deng, S. (2019). Heating and energy storage characteristics of multi-split air source heat pump based on energy storage defrosting. Applied Energy, 238: 303-310. https://doi.org/10.1016/j.apenergy.2019.01.079
[10] Busato, F., Lazzarin, R.M., Noro, M. (2013). Two years of recorded data for a multisource heat pump system: A performance analysis. Applied Thermal Engineering, 57(1-2): 39-47. https://doi.org/10.1016/j.applthermaleng.2013.03.053
[11] Wang, L.J., Liu, W., Zhang, D., Gao, Z.W., Men, J. (2016). Experimental study on radiation heating of low temperature air source heat pump in cold areas. Journal of Gansu Sciences, 28(1): 77-82. https://doi.org/10.16468/j.cnki.issn1004-0366.2016.01.018
[12] Liang, C.H., Zhang, X.S., Li, X.W., Zhu, X. (2011). Study on the performance of a solar assisted air source heat pump system for building heating. Energy and Buildings, 43(9): 2188-2196. https://doi.org/10.1016/j.enbuild.2011.04.028
[13] Chen, Z.D., Luo, H.L., Liu, J.C. (2018). Analysis of heating performance of CO2 air-source heat pump in cold region. CIESC Journal, 69(9): 4030-4036. https://doi.org/10.11949/j.issn.0438 -1157.20180224
[14] Dong, J., Zhang, L., Deng, S., Yang, B., Huang, S. (2018). An experimental study on a novel radiant-convective heating system based on air source heat pump. Energy and Buildings, 158: 812-821. https://doi.org/10.1016/j.enbuild.2017.10.065
[15] Dneg, J., Yang, X., Wang, P. (2014). Comparative analysis on heating performance and heating effect of single and double stage compression low temperature air source heat pump of frequency conversion. Building Science, 10: 7. https://doi.org/10.13614/j.cnki.11-1962/tu. 2014.10.07
[16] Hakkaki-Fard, A., Aidoun, Z., Ouzzane, M. (2014). Applying refrigerant mixtures with thermal glide in cold climate air-source heat pumps. Applied Thermal Engineering, 62(2): 714-722. http://doi.org/10.1016/j.applthermaleng.2013.10.033
[17] Ma, R., Mao, C., Shan, M., Zhang, L., Yang, X. (2017). Occupant control patterns of low temperature air-to-air heat pumps in Chinese rural households based on field measurements. Energy and Buildings, 154: 157-165. https://doi.org/10.1016/j.enbuild.2017.08.049
[18] Jiang, Y.Q., Yao, Y., Ma, Z.L. (2000). Calculation of the loss coefficient for frosting-defrosting of air source heat pumps. HV&AC, 30(5): 24-26. https://doi.org/10.3969/j.issn.1002-8501.2000.05.008