Nattadon Pannucharoenwong* | Phadungsak Rattanadecho | Snunkhaem Echaroj | Suwipong Hemathulin | Kriengkrai Nabudda
© 2020 IIETA. This article is published by IIETA and is licensed under the CC BY 4.0 license (http://creativecommons.org/licenses/by/4.0/).
OPEN ACCESS
A rise in utility consumption in rural areas have promoted the demand for the development of solar-based technologies for water purification system. This research aimed to develop a slanted double-slope solar distillation unit (SDSD) assisted by heat absorbers, which is employed as a distillation unit for generating clear distilled water from underground water. The prototype SDSD distillation unit developed in this research was evaluated based on production efficiency, productivity, distillation rate and temperature measured at different locations inside the device. Significant parameters that were varied included the types of heat absorber used (gasket, rubber, aluminum, high carbon steel and zinc) and the size of heat absorber (10 to 90% of surface area inside the SDSD). Results demonstrated an increase in the production of distilled water as the surface area of heat absorber decreases. This is because a reduction in surface area of the heat absorber allowed a more intense sunlight to enter the system. Maximum productivity peaked at 1.2 liter per day (24.9% efficiency). Monitored data in both the upper and bottom part of the distillation unit revealed the highest distillation rate at 15:00 each day. Distillation rate decreases with water height and insulator’s thermal conductivity, but increase with water speed. Additionally, a mathematical model was proposed which was capable of accurately predicting the production efficiency and productivity as a function of the heat absorber’s size and distillation time. Under the same operating conditions, aluminum was found to generate the best results relative to other types of heat absorber.
distillation rate, solar-base technology, heat absorber, black gasket
Many rural areas in Thailand lacked an effective electricity distribution system, which is essential for operating a water treatment system [1, 2]. As a consequence, communities in these rural areas have to depend on underground and river water that are contaminated with inorganic salts, heavy metals, salts, and pathogen. Analysis of most underground water demonstrated high level of undesired color, turbidity, total coliform and fecal coliform [3].
Fortunately, development in the energy sector have provided a variety of novel technologies that can help harness renewable source of energy such as wind, water and sunlight. Since Thailand is located close to the equator, sunlight in Thailand is relatively intense. For this reason, application of solar thermal system in Thailand can yield profitable results [4]. Evidence can be found from the Solargis model based satellite data illustrating the solar intensity of the three different provinces in Thailand (Hua Hin, Nakhon Ratchasimam and Sing Buri). According to these data, the daily maximum global horizontal radiation (GHI) varied from 5.2 to 5.4 kWh/m2, which was equaled to an average annual sum of 1.899 to 1.972 kWh/m2 [5]. Solar radiation has been applied for the development of distillation technology, which have been used for water treatment system [6, 7].
Water treatment via a solar-based distillation is one of the most effective method to harness solar energy in rural area. One of the main advantages of a solar-based distillation unit is that it is easy to operate, required low operating and low installation cost. In the present, two types of solar-based distillation unit were used which included passive and active types. Passive type is a form of distillation that gain all the required energy naturally from sunlight. Therefore, passive distillation does not required electricity to function properly [8]. In contrary, active type distillation unit usually depend on an external heat source in order to enhance the evaporation rate of the system. The general component of a distillation unit that employed solar-based technology included two layers of glass compartment with water channels and heat absorbers. Evaporation is controlled by the difference in temperature between the liquid medium inside the compartment and the glass covers [9]. The heat transfer mode in a distillation unit is usually carried out through convection [10]. Inside the compartment, evaporated water flowed toward the top glass cover which is then condensed and dripped down onto the side channels and then collected in order to evaluate the distillation performance.
Various parameters have been found to demonstrate significant effect on the distillation efficiency of the solar type unit including, compartment material, height of water surface in the compartment, wind speed, location of the distillation setup, angle of the distillation unit and solar intensity. Distillation efficiency depend strongly on the temperature difference between the compartment and the slanted class cover. Many researchers have developed ways to improve the distillation rate of the solar-type water treatment system [11, 12]. For instance, an increase in productivity of a sponge-like distillation unit can be accomplished by adding brine solution into the distillation basin [13]. A V-shaped distillation unit assisted by the charcoal heat absorber and mirrors system demonstrated high distillation efficiency of roughly 30% [14]. Additionally, distillation efficiency can be improved by including multilevel step in the design [15] and installation of heat exchanger tube on the sides of the distillation compartment [16]. Material used as heat absorber, such as sand, sponges and pebble demonstrated positive effect on the rate of distillation and can produced as high as 5.1 mL/m3 [17]. Shukla et al. reported an improvement in the production of clean distilled water by addition of phase change chemical solution consisting of lauric acid [18].
The objective of this research is to investigate the effectiveness of different size (in the range of 10% to 90%) and type of heat absorbers. In order to evaluate the efficiency of the slanted double-slope solar distillation unit (SDSD), solar intensity at the installation site was continuously recorded during the day. Other environmental parameters were also monitored including temperature at different spot inside the distillation system, wind speed, thermal conductivity and water height inside the distillation compartment [19]. Experimental data were used to numerically calculate the efficiency of the distillation unit through the Engineering Equation Solver (EES). The efficiency and distilled water productivity were accurately predicted by using the proposed mathematical model.
Heat transfer inside the distillation unit is initiated as sunlight passed through the glass cover and then absorbed by fluid inside the distillation compartment. When the accumulation of energy inside the fluid increases higher than latent heat the intermolecular bond will start to cleavage resulting in the evaporation of the fluid. This is found to result in an increase in evaporation activities inside the distillation unit. Fluid vapor would flow upward, condensed as it collides into the glass cover and flow down the fluid channels into a distillate collector. In order for the fluid to flow effectively into the distillate collector, the distillation unit need to be designed with an optimal slope and an appropriate channel length.
2.1 Calculating insolation based on location
Insolation is referred to the quantity of solar radiation that collide with the surface of the Earth. Solar insolation strongly depends on the location of the sun relative to Earth which is why solar insolation need to be calculated throughout the year to identify the maximum radiation potential. As shown in Eq. (1) and Eq. (2), it is possible to determine solar insolation per hour (SIh) by multiplying solar insolation per day (SId) by the total radiation ratio (rtotal) on that particular day.
SIh=SId x rtotal (1)
$r_{\text {total}}=\pi\left(\frac{\mathrm{a}+\mathrm{b} \cos \omega}{24}\right) \times \frac{\cos \omega-\cos \omega_{\mathrm{s}}}{\sin \omega_{\mathrm{s}}-\left(\frac{2 \pi \omega_{\mathrm{s}}}{360}\right) \cos \omega_{\mathrm{s}}}$ (2)
$\mathrm{a}=\mathrm{a}_{1}+\mathrm{a}_{2} \sin \left(\omega_{\mathrm{s}}-60\right)$
$\mathrm{b}=\mathrm{b}_{1}+\mathrm{b}_{2} \sin \left(\omega_{\mathrm{s}}-60\right)$
where, $\omega_{s}$ represent incidence angle between area exposed to sunlight and sunlight ray. The values of a1, a2, b1 and b2 are constant which varied according to the location of the installation sites. Since this experiment was conducted in Phathumthani area these values are equaled to a1=0.79, a2=-0.038, b1=0.231 and b2=0.241.
2.2 Heat transfer governing equations
The quantity of energy transfer inside the distillation system can be calculated by plugging data into different energy balance equations. Energy balance equation for the insulator component inside the distillation system is demonstrated as Eq. (3).
$\mathrm{m}_{\mathrm{insu.}} \mathrm{C}_{\mathrm{p}. \mathrm{insu}} \frac{\mathrm{dT}_{\mathrm{insu.}}}{\mathrm{dt}}=\mathrm{I}(\mathrm{t}) \mathrm{A}_{\mathrm{insu}}-\mathrm{q}_{\mathrm{c}. \mathrm{insu}}-\mathrm{q}_{\mathrm{loss}}$ (3)
where, $\mathrm{m}_{\text {insu }}$ represent the insulator’s weight (10 kg), $\mathrm{C}_{\mathrm{p} . \mathrm{insu}}$ represent insulator’s heat capacity, \Gamma_{\text {ins } u} demonstrated the insulator’s temperature, $A_{\text {ins }}$ is equaled to the surface area of the insulator and $\mathrm{q}_{\text {insu }}$ is heat transfer away from the insulator.
Eq. (4) demonstrated energy balance consisting of fluid body at the bottom part of the distillation system.
$\mathrm{m}_{\mathrm{wt} 1} \mathrm{C}_{\mathrm{p}. \mathrm{wt} 1} \frac{\mathrm{d} \mathrm{T}_{\mathrm{wt} 1}}{\mathrm{dt}}=\mathrm{I}(\mathrm{t}) \mathrm{A}_{\mathrm{wt} 1}+\mathrm{q}_{\mathrm{insu}}-\mathrm{q}_{\mathrm{r}. \mathrm{wt} 1}-\mathrm{q}_{\mathrm{c}. \mathrm{w} \mathrm{t} 1}-\mathrm{q}_{\mathrm{v}. \mathrm{w} \mathrm{t} 1}$ (4)
where, $m_{w t 1}$represent water bottom located in the bottom part of the distillation unit, water heat capacity is represented by $C_{p . w t 1}$ which is equaled to 4,178 J/kg °C, fluid surface area at the bottom part of distillation unit is represented as $A_{\mathrm{wt} 1}$, heat transfer via radiation between glass cover and fluid medium is represented as $\mathrm{q}_{\mathrm{r} . \mathrm{wt} 1}$, heat transfer through convection mode is referred to as $\mathrm{q}_{\mathrm{c.wt} 1}$ and heat transfer during evaporation heat is referred as $\mathrm{q}_{\mathrm{v} . \mathrm{wt} 1}$.
Eq. (5) described the energy balance in the area of glass cover at the bottom part of the distillation unit.
$\mathrm{m}_{\mathrm{gs} 1} \mathrm{C}_{\mathrm{p}. \mathrm{g} s 1} \frac{\mathrm{d} \mathrm{T}_{\mathrm{gs} 1}}{\mathrm{dt}}=\mathrm{I}(\mathrm{t}) \mathrm{A}_{\mathrm{gs} 1}+\mathrm{q}_{\mathrm{r.gs} 1}+\mathrm{q}_{\mathrm{c}. \mathrm{gs} 1}+\mathrm{q}_{\mathrm{v}. \mathrm{gs}}-q_{c . g s 1 w t 2}$ (5)
where, $m_{g s 1}$ represent the weight of glass cover in the bottom part (6 kg), glass’s heat capacity is represented by $C_{\mathrm{p} . \mathrm{gs} 1}$ (800 J/kg °C), glass cover’s temperature of glass cover in the bottom section is referred to as $\mathrm{T}_{\mathrm{wt} 1}$, glass cover area in the bottom part is referred to as and heat transfer between water surface in the upper part of the distillation unit and glass cover is $\mathrm{q}_{\mathrm{c} . \mathrm{gs} 1 \mathrm{wt} 2}$.
Eq. (6) demonstrated the energy balance of fluid medium in the upper part of the distillation unit
$\begin{aligned} \mathrm{m}_{\mathrm{wt} 2} \mathrm{C}_{\mathrm{p}. \mathrm{wt} 2} \frac{\mathrm{d} \mathrm{T}_{\mathrm{wt} 2}}{\mathrm{dt}} &=\mathrm{I}(\mathrm{t}) \mathrm{A}_{\mathrm{wt} 2}+\mathrm{q}_{\mathrm{c}. \mathrm{gs} 1 \mathrm{wt} 2}-\mathrm{q}_{\mathrm{c.wt} 2 \mathrm{gs} 2} \\ &-\mathrm{q}_{\mathrm{r}. \mathrm{ws} 2 \mathrm{gs} 2}-\mathrm{q}_{\mathrm{r}. \mathrm{ws} 2 \mathrm{gs} 2}+\mathrm{q}_{\mathrm{Ab}} \end{aligned}$ (6)
where, $m_{w t 2}$ is water surface’s weight located in the upper part of the distillation unit, heat capacity is represented by $\mathrm{C}_{\mathrm{p} . \mathrm{wt} 2}$, fluid’s temperature in the bottom part is referred as $A_{g s 1}$, fluid surface area in the bottom part is $A_{w t 2}$, heat transfer from fluid surface in the upper part to glass cover in the bottom part is referred to as $\mathrm{q}_{\mathrm{c}. \mathrm{gs} 1 \mathrm{w}t2}$, and radiative/convective heat transfer from fluid surface to glass cover in the upper part of the distillation unit are referred to as $\mathrm{q}_{\mathrm{c.wt} 2 \mathrm{gs} 2} / \mathrm{q}_{\mathrm{r} . \mathrm{wt} 2 \mathrm{gs} 2} / \mathrm{q}_{\mathrm{r} . \mathrm{w} \mathrm{t} 2 \mathrm{g} \mathrm{s} 2}$, and heat transfer from heat absorber is referred to as $\mathrm{q}_{\mathrm{H}}$.
Eq. (7) represented energy balance for glass cover in the upper part of distillation unit.
$\begin{aligned} \mathrm{m}_{\mathrm{gs} 2} \mathrm{C}_{\mathrm{p.gs} 2} \frac{\mathrm{dT}_{\mathrm{gs} 2}}{\mathrm{dt}} &=\mathrm{I}(\mathrm{t}) \mathrm{A}_{\mathrm{gs} 2}+\mathrm{q}_{\mathrm{c.wt} 2 \mathrm{gs} 2}+\mathrm{q}_{\mathrm{r.wt} 2 \mathrm{gs} 2} \\ &+\mathrm{q}_{\mathrm{v}. \mathrm{wt} 2 \mathrm{gs} 2}-\mathrm{q}_{\mathrm{r}. \mathrm{gs} 2 \mathrm{atm}}-\mathrm{q}_{\mathrm{c}. \mathrm{gs} 2 \mathrm{atm}} \end{aligned}$ (7)
where, $m_{g s 2}$ represent the glass cover’s weight in the upper part of the distillation unit, glass's heat capacity is denoted as $\mathrm{C}_{\mathrm{p} . \mathrm{gs} 2},$ temperature recorded at the glass cover in the bottom part is represented by $\mathrm{T}_{\mathrm{gs} 2},$ glass cover's area at the bottom part is represented by $\mathrm{A}_{\mathrm{gs} 2},$ heat transfer from glass cover in the upper part of the distillation unit to fluid surface are represented by $\mathrm{q}_{\mathrm{c.wt} 2 \mathrm{gs} 2} / \mathrm{q}_{\mathrm{r} . \mathrm{ws} 2 \mathrm{gl} 2} / \mathrm{q}_{\mathrm{ev.ws} 2 \mathrm{gl} 2},$ radiation from transparent glass $\mathrm{q}_{\mathrm{r} . \mathrm{gl} 2 atm }$ is the heat transfer in radiation mode from glass screen in the upper stage to the atmosphere, and heat transfer in convective mode from glass screen in the upper section to the atmosphere.
$\frac{\mathrm{dm}_{\mathrm{d}}}{\mathrm{dt}}=\mathrm{h}_{\mathrm{e} . \mathrm{wt} 1 \mathrm{gs} 1}\left[\frac{\mathrm{T}_{\mathrm{wt} 1}-\mathrm{T}_{\mathrm{gs} 1}}{\mathrm{h}_{\mathrm{fg} @ \mathrm{T}_{\mathrm{wt} 1}}}\right]$
$+h_{\mathrm{e.wtzgs2}}\left[\frac{\mathrm{T}_{\mathrm{wt} 2}-\mathrm{T}_{\mathrm{gs} 2}}{\mathrm{h}_{\mathrm{fg} @ \mathrm{T}_{\mathrm{w} t2}}}\right]$ (8)
Eq. (8) illustrated the accumulation of distillation rate between both the upper and bottom section of the distillation Tunit where $m_{d}$ is the amount of accumulated distilled water produced over time, and the heat transfer coefficients are $\mathrm{h}_{\mathrm{e} . \mathrm{ws} 1 \mathrm{g} l1} / \mathrm{h}_{\mathrm{fg} @ \mathrm{T}_{\mathrm{ws} 1}} / \mathrm{h}_{\mathrm{fg} @ \mathrm{T}_{\mathrm{ws} 2}}$.
2.3 Transfer of heat inside the distillation unit
Low heat transfer efficiency is one of main problem associated with high operating cost and low distillation rate. Conduction and convection are obvious heat transfer mode responsible for the majority of energy delivery through the system. However, for solar-type distillation, heat transfer via radiation mode is also an essential process. Radiative heat wave can both penetrate through and reflected from glass cover into the fluid body inside the distillation compartment. Possible heat accumulation begins as sunlight collided with glass cover on top of the distillation unit. Radiation heat is partially stored inside the glass cover and partially passed through the glass cover reaching fluid inside the distillation compartment. In addition to radiation, convection heat transfer mode also cause heat to be transfer from the atmosphere, through the glass cover and into the fluid inside the distillation compartment. On the other hand, heat loss through ventilation system can occur during the release of distillate in vaporize form into the atmosphere.
2.4 Heat transfer calculation from heat absorber
Heat transfer toward heat absorber inside the distillation unit can be found by Eq. (9).
$\mathrm{q}_{A b}=\alpha\left(\mathrm{I}_{\mathrm{a}} \tau_{\mathrm{sa}}+\mathrm{I}_{\mathrm{s}} \tau_{\mathrm{ss}}\right)$ (9)
where, $\alpha$ is the radiative absorption coefficient, $I_{a}$ is the solar radiation measured from sunlight incidence per hour, $I_{s}$ is the distribution of solar radiation measured from sunlight incidence per hour, $\tau_{\mathrm{sa}}$ is the transfer of radiative heat through steam absorption, $\tau_{\mathrm{ss}}$ represents the transfer of radiative heat through steam scattering.
2.5 Efficiency calculation of solar distillation unit
Eq. (10) was used to calculate the efficiency (η) the distillation unit.
$\eta=\frac{\sum \dot{\mathrm{m}}_{\mathrm{d}} \mathrm{h}_{\mathrm{fg}}}{\sum \mathrm{I}}$ (10)
where, $\dot{m}_{d}$ is distillation rate, hfg is latent heat and I is solar radiation condensation.
2.6 Logical path for calculating efficiency
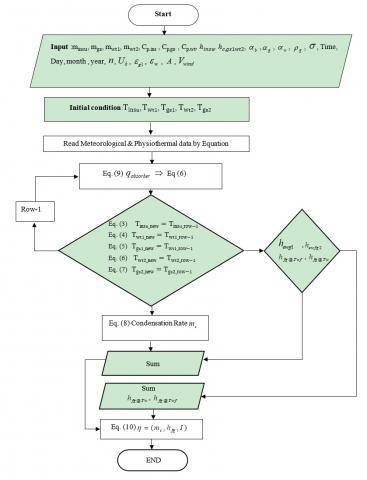
Engineering equation solver (EES) computer software is a platform that is used to calculated efficiency from experimental data monitored during the research. Solar radiation demonstrated in Eq. (3) to Eq. (8) were calculated based on different input variations such as temperature monitored at various location inside the distillation unit including, temperature of the atmosphere, temperature of the insulator, temperature of glass cover (upper /bottom part), and temperature of water medium (upper/bottom part) as shown in Figure 1. Distillation properties, such as latent heat of fluid in the upper and bottom part, were plugged into the EES software to calculate the efficiency of the distillation unit according to Eq. (10). Other input parameters are shown in the Table 1 below.
Table 1. Parameters for operating the double slanted-glass distillation unit [20]
|
Operating conditions |
Abrev. |
Value |
|
Glass emissivity |
εg |
0.88 |
|
Water emissivity |
$\varepsilon_{w}$ |
0.96 |
|
Radiation absorption of glass |
αg |
0.0475 |
|
Radiation absorption of water |
αw |
0.05 |
|
Reflectivity of glass |
ρg |
0.0735 kg cm-3 |
|
Overall heat transfer coefficient |
Ub |
14 W/m2·K |
|
Heat coefficient insulator |
hins |
135 W/m2·K |
|
Convection coefficient |
hc.gl1ws2 |
25 W/m2·K |
|
Wind velocity |
Vwind |
3 m/s |
|
Thermal conductivity coefficient |
k |
0.04 W/m·K |
Figure 1. Using Engineering Equation Solver (EES) to find efficiency of the distillation unit [11, 12]
3.1 Distillation unit design
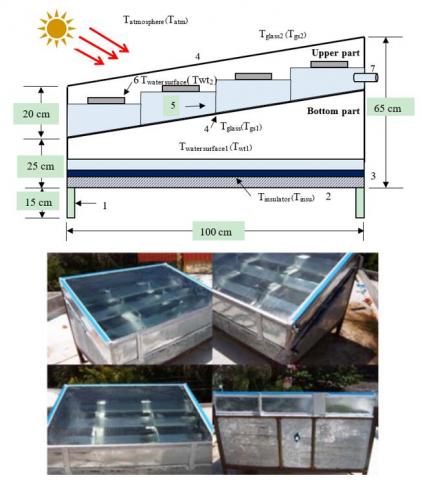
Water treatment was performed in a slanted double-slope solar distillation unit (SDSD) as illustrated in Figure 2. The distillation unit is 150 cm long and 100 cm wide. Water level was usually adjusted to be controlled at 20 cm. The SDSD unit was design to contain the upper and bottom part of the unit. Each section also contained water channels which are used collected the condensed treatment water. The slope of the distllation unit was set at 14o in order to maximize the distillation rate as shown in Figure 3.
Temepature sensors were installed in different spots inside the distllation unit to measured temperature of the insulator (Tinsu), temperature of water surface in the bottom section (Twt1), temperature of glass cover in the bottom compartment (Tgs1), temperture part of water surface in the upper(Tws2) and temperature of glass cover in the upper section(Tgs2). Before each experimental trail, the bottom part of the dstillation uni was filed with 75 liters of water, while the upper part was filled with 24 liters of water. The distillate collector used to store treated water contain a measuring scale, which was used to find the volume of the treated unclean water. Experiments on the distillation unit were conducted to monitor the solar intensity per hour, amount of distillation per day performed by each section of the unit and temperature variations inside the distillation unit. These quantities are then employed to determine the efficiency of the distillation unit using different size heat absorber from 10% to 90% of the size of water surface in the bottom section of the unit.
Figure 2. Prototype model of the slanted double-slope solar distillation unit. 1. Distillation leg stand, 2. Bottom wall, 3. Insulator, 4. Glass cover, 5. Upper gutter, 6. Heat absorber and 7. Inlet water [11, 12]
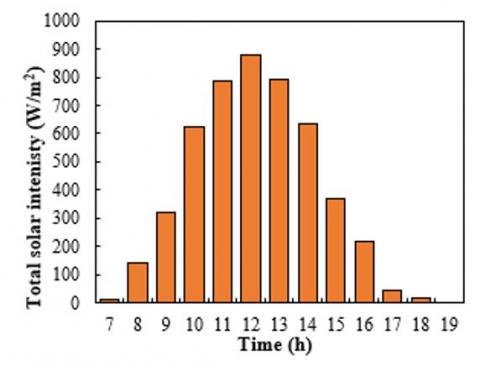
Figure 3. Monitoring solar intensity at the installation site from 7:00 AM. to 19:00 PM
4.1 Solar intensity measurement
This research employed distillation method to purify untreated water. Variables investigated included the material type used for heat absorber and size of the heat absorber, which range from 10% to 90% of the water’s surface area inside the distillation compartment. The efficiency of the distillation unit was calculated by using the EES platform. One of the important parameters that have to be plugged into the software is solar intensity of the installation location. For this experiment, solar intensity was monitored from March to June 2020, which is the hottest period of the year in Thailand. According to the collected data, the average solar intensity was 542.2 W/m2 and the maximum total solar intensity recorded during the hottest time of the day was 873.8 W/m2.
4.2 Distribution of temperature inside the distillation unit
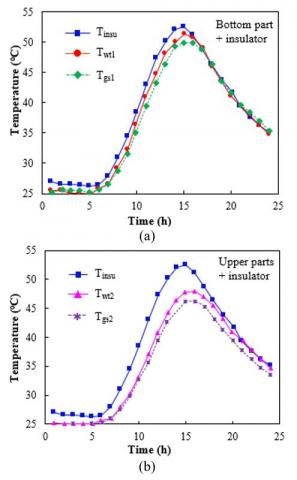
Temperature measurement inside the distillation unit at 15:00 were illustrated in Figure 4a and 4b. The highest temperature (53oC) was measured at the insulator located below the bottom part of the distillation unit. On the other hand, the lowest temperature was recorded at the glass cover in the upper part of the distillation unit. Fluid temperature recorded in the upper and bottom part of the distillation unit was significantly different due to the transfer of heat from the upper part to be accumulated in the bottom part of the distillation unit. Additionally, results suggested that temperature difference between water medium and glass cover in the upper part was clearly higher that of the bottom part. This temperature difference was more obvious for data that was recorded after 13:00. The increase in temperature difference created temperature gradient that support heat accumulation inside the distillation unit. Maximum temperature difference for the upper part and bottom part of the distillation unit were 1.67oC. and 1.23oC.
Figure 4. Recorded temperature of the insulator, water medium and glass cover at the bottom part (a) and upper part of the distillation unit with 10% black gasket plate as heat absorbers (b)
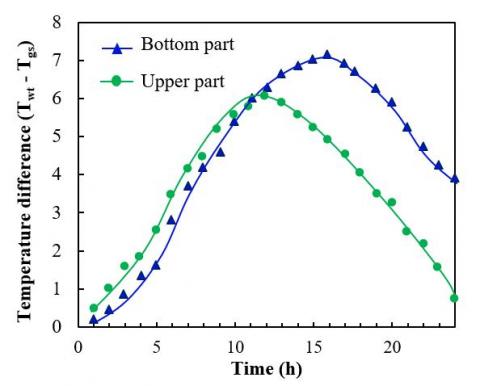
4.3 Recorded temperature difference glass cover and water medium
Temperature difference between glass cover and water medium inside the distillation unit is depicted in Figure 5. Measurement data were collected from 7:00 in the morning to 24:00 at night. Temperature difference in the upper and bottom part were observed to be very close from 7:00 to 11:00. However, after 11:00 temperature difference measured in the upper part of the distillation unit was found to be significantly higher than temperature difference in the bottom part. The highest temperature difference in both upper and bottom part of the distillation unit were 7.9oC and 6.2oC.
Figure 5. Recorded temperature difference between water surface and glass cover in the bottom and upper part of the distillation unit.
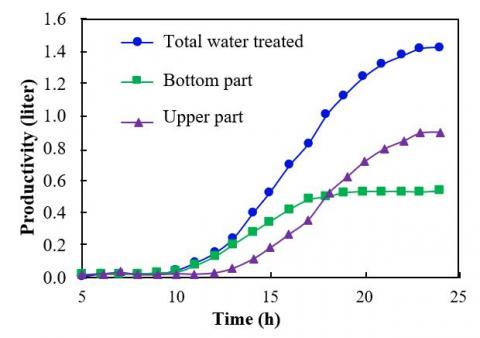
4.4 Distillation rate and productivity of the distillation unit
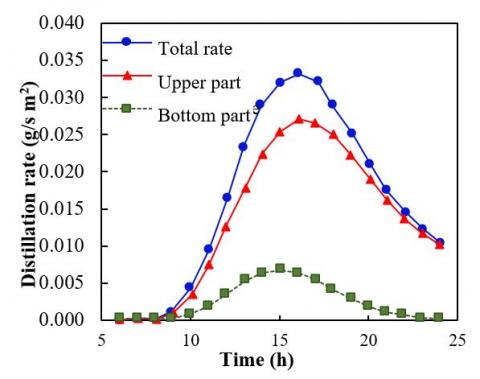
The amount of distilled water produced during the period after 10:00 to 24:00 is shown in Figure 6. Over this period, the total amount of treated water collected was 1.4 liters. According to the collected data, productivity increase rapidly during the period from 10:00 to 16:00 in the evening. Productivity of upper part of the distillation unit was found to increase even after 17:00. The total collection of treated distilled water reached 1.4 litres over the period of the experiment. Productivity increased at an accelerated rate from 10:00 in the morning to 16:00 in the evening. It is interesting to note that productivity in the upper part of the distillation increase even after 17:00 in the evening. However, productivity in the bottom part reached a steady stage after 17:00. As shown in Figure 7, distillation rate peaked at 15:00 in both the upper part (0.026 g/s m2) and bottom part (0.007 g/s m2) of the distillation system. Distillation rate can be neglected before 9:00 in the morning due to low energy which was lower than the threshold latent heat.
A polynomial form of mathematical equation was established in order to find productivity during each period of time throughout the day. As shown in Eq. (11), productivity can be predicted by plugging in the operating time of the distillation unit. Comparison between experimental data and productivity calculated by the polynomial equation produced R2 very close to 1 which suggested that these predictions were accurate [21, 22].
Productivit=4x10⁻⁷to6–3x10⁻⁵to5+0.0008to4-0.0096to3 + 0.0528to2-0.1245to+.1111 (11)
where, to is the operating time of the distillation unit.
Figure 6. Productivity calculated from the amount of clean distilled water production from 8:00 to 24:00 produced by distillation unit using 10% in size black gasket as heat absorber
Figure 7. Distillation rate from 8:00 to 24:00 in the upper and bottom part of the distillation unit
4.5 Influence of distillation conditions on clean water production rate
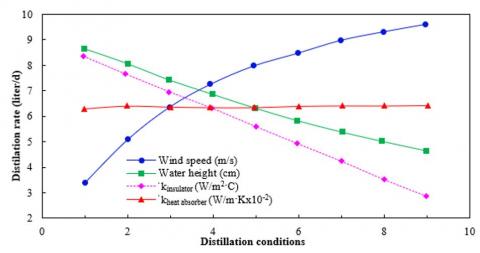
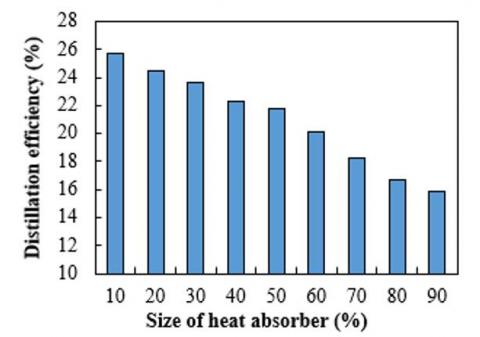
Effect of different distillation conditions on the distillation rate were shown in Figure 8. These distillation conditions included, heat absorber’s conductivity, thermal conductivity of the insulator and the height of water in the distillation compartment. An increase in wind speed from 1 to 10 m/s during distillation caused the distillation rate to increase. Wind speed have been observed to enhance the convective coefficient which results in higher heat transfer capability. Water height in the upper part of the distillation unit was found to be inversely proportional to the distillation rate. The reason distillation rate decrease is because water behaved as a shield which prevent sunlight from fully reaching the heat absorber causing a reduction in the accumulation of heat. Distillation rate was also observed to decrease as the thermal conductivity of insulator (kinsulator) increased. On the other hand, distillation rate increases with the thermal conductivity of heat absorber (kheat absorber). An increase in the size of heat absorber was found to reduce the efficiency of the distillation unit, as shown in Figure 9.
In addition to the mathematical model for predicting productivity, another polynomial model (fourth order) was proposed for calculating efficiency using the size of heat absorber, as shown in Eq. (12). The R2 of 0.9973 suggested that the equation for predicting efficiency as a function of the size of heat absorber (Ah,o) is accurate compared with the experimental data.
Efficiency (%) = 9x10⁻⁷(Ah,o)4 – 0.0002 (Ah,o) 3 + 0.0106(Ah,o)2 – 0.3492(Ah,o) + 28.359 (12)
Figure 8. Effect of distillation conditions such as water height, wind speed, thermal conductivity of insulator (kinsulator)and thermal conductivity of heat absorber (kheat absorber) on the distillation rate
Figure 9. Effect of the size of heat absorber on the distillation efficiency of the system
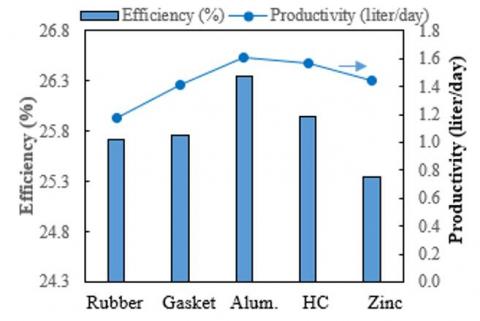
Figure 10. Evaluation of different type of material used as heat absorbers based on distillation efficiency and productivity (Alum. = Aluminum, HC = High carbon steel)
Different types of material used for heat absorber included black rubber, black gasket, aluminum, high carbon steel and zinc. Evaluation of these materials based on distillation efficiency and productivity are shown in Figure 10. The highest distillation efficiency was observed for aluminum-type heat absorber followed by high carbon steel-type heat absorber. Black rubber and black gasket demonstrated similar distillation efficiency and productivity.
This research demonstrated the effect of material as heat absorber, distillation conditions and size of heat absorber on distillation rate and efficiency. The increase in size of heat absorber was found to have negative effect on the outcome of the distillation process. Maximum productivity resulted in the production of 1.2 liter of clean distilled water collected from the distillation unit per day. The amount of product collected from distillation unit with 10% by size heat absorber indicated an efficiency level of as high as 24.9%. The lowest efficiency of 22.5% was demonstrated for the distillation unit with 90% by size heat absorber. The period of time that produced the highest distillation rate of 0.026 g/s·m2 was at 15:00. Distillation rate was observed to increase significantly with wind speed. An increase in water height and insulator’s thermal conductivity was found to decrease distillation rate significantly. Two polynomial equations were proposed for predicting productivity and distillation efficiency by plugging in operating time and the size of the heat absorber. These two models can be used to accurately calculate the performance of the distillation unit. Aluminum-type material resulted in the highest efficiency and distillation productivity compared with other types of material. This research successfully offers a distillation prototype for the production of clean water using solar-based technology.
The authors gratefully acknowledge the support of Thailand Science Research and Innovation (TSRI) and Thailand Government Budget Grant for providing financial support for this work. This research appreciates the support of Faculty of Engineering, Thammasat University. Authors would also like to thank Kriengkrai Nabudda’s research group for assisting with the experiment and data collections.
|
$m_{g}$ |
Glass cover weight, kg |
|
$m_{b}$ |
Insulator weight, kg |
|
$C_{p g}$ |
Heat capacity for glass material, J/kg°C |
|
$C_{p w}$ |
Heat capacity for water, J/kg°C |
|
$\mathcal{E}_{\mathcal{g}}$ |
Glass emissivity |
|
$\mathcal{E}_{W}$ |
Water emissivity |
|
$\alpha_{g}$ |
Radiation absorbed by the glass screen |
|
$\alpha_{w}$ |
Radiation absorbed |
|
$\rho_{g}$ |
Glass reflectivity, kg/cm3 |
|
$U_{b}$ |
Overall heat transfer coefficient, W/m2K |
|
Tinsu Tgs1 |
Temperature for the insulator, °C Temperature for the glass screen in the bottom layer, °C |
|
Tgs2 |
Temperature for the glass screen in the upper layer, °C |
|
Twt1 |
Temperature for water surface in the bottom layer, °C |
|
Twt2 |
Temperature for water surface in the upper layer, °C |
[1] Progress on Drinking-Water and Sanitation – 2014 Update. (2014). Un-water global analysis and assessment of sanitation and drinking-water.
[2] Van Esch, M.M.E., Looman, R.H.J., de Bruin-Hordijk, G.J. (2012). The effects of urban and building design parameters on solar access to the urban canyon and the potential for direct passive solar heating strategies. Energy and Buildings, 47: 189-200. https://doi.org/10.1016/j.enbuild.2011.11.042
[3] Soticha, K., Jareeya, Y., Sudjit, K., Prapat, P. (2014). Assessing water quality of rural water supply in Thailand. Journal of Clean Energy Technologies, 2(3): 226-228. https://doi.org/10.1016/j.enbuild.2011.11.042
[4] Sarralde, J.J., Quinn, D.J., Wiesmann, D., Steemers, K. (2015). Solar energy and urban morphology: Scenarios for increasing the renewable energy potential of neighbourhoods in London. Renewable Energy, 73: 10-17. https://doi.org/10.1016/j.renene.2014.06.028
[5] Global Solar Atlas. (2016). Solar resource and PV power potential maps and GIS data. https://globalsolaratlas.info/downloads/thailand
[6] Mohajeri, N., Gudmundsson, A., Kunckler, T., Upadhyay, G., Assouline, D., Kämpf, J.H., Scartezzini, J.L. (2019). A solar-based sustainable urban design: The effects of city-scale street-canyon geometry on solar access in Geneva, Switzerland. Applied Energy, 240: 173-190. https://doi.org/10.1016/j.apenergy.2019.02.014
[7] Mohajeri, N., Upadhyay, G., Gudmundsson, A., Assouline, D., Kämpf, J., Scartezzini, J.L. (2016). Effects of urban compactness on solar energy potential. Renewable Energy, 93: 469-482. https://doi.org/10.1016/j.renene.2016.02.053
[8] Akash, B.A., Mohsen, M.S., Osta, O., Elayan, Y. (1998). Experimental evaluation of a single-basin solar still using different absorbing materials. Renewable Energy, 14(1-4): 307-310. https://doi.org/10.1016/S0960-1481(98)00082-2
[9] Prakash, P., Velmurugan, V. (2015). Parameters influencing the productivity of solar stills–A review. Renewable and Sustainable Energy Reviews, 49: 585-609. https://doi.org/10.1016/j.rser.2015.04.136
[10] Rajvanshi, A.K. (1981). Effect of various dyes on solar distillation. Solar Energy, 27(1): 51-65. https://doi.org/10.1016/0038-092X(81)90020-7
[11] Pannucharoenwong, N., Rattanadecho, P., Timchenko, V., Echaroj, S., Nabudda, K. (2019). Application of aluminum and black rubber heat absorber for solar-base distillation with double slanted-glassed configuration. Asia-Pacific Journal of Science and Technology, 24(3): 1-15. https://doi.org/10.14456/apst.2019.22
[12] Pannucharoenwong, N., Rattanadecho, P., Timchenko, V., Echaroj, S., Nabudda, K. (2019). Investigation of double slope solar distillation efficiency using heat absorber made from Zinc. Science & Technology Asia, 70-82. https://doi.org/10.14456/scitechasia.2019.28
[13] Velmurugan, V., Srithar, K. (2007). Solar stills integrated with a mini solar pond—analytical simulation and experimental validation. Desalination, 216(1-3): 232-241. https://doi.org/10.1016/j.desal.2006.12.012
[14] Kumar, B.S., Kumar, S., Jayaprakash, R. (2008). Performance analysis of a “V” type solar still using a charcoal absorber and a boosting mirror. Desalination, 229(1-3): 217-230. https://doi.org/10.1016/j.desal.2007.09.009
[15] Velmurugan, V., Pandiarajan, S., Guruparan, P., Subramanian, L.H., Prabaharan, C.D., Srithar, K. (2009). Integrated performance of stepped and single basin solar stills with mini solar pond. Desalination, 249(3): 902-909. https://doi.org/10.1016/j.desal.2009.06.070
[16] Kumar, K.V., Bai, R.K. (2008). Performance study on solar still with enhanced condensation. Desalination, 230(1-3): 51-61. https://doi.org/10.1016/j.desal.2007.11.015
[17] Srithar, K. (2010). Performance analysis of vapour adsorption solar still integrated with mini-solar pond for effluent treatment. International Journal of Chemical Engineering and Applications, 1(4): 336-341. https://doi.org/10.1016/j.energy.2009.04.029
[18] Al-Hamadani, A.A.F., Shukla, S.K. (2011). Water distillation using solar energy system with lauric acid as storage medium. International Journal of Energy Engineering, 1(1): 1-8. https://doi.org/10.5923/j.ijee.20110101.01
[19] Moungar, H., Azzi, A., Sahli, Y., Hieda, A. (2017). Immersed fins influence on the double slope solar still production in south Algeria climatic condition. International Journal of Heat and Technology, 35(4): 1065-1071. https://doi.org/10.18280/ijht.350444
[20] Cengel, Y.A., Boles, M.A. (2009). Thermodynamics an engineering approach sixth edition. Beijing: Publishing House of Electronics Industry, 200-238.
[21] Echaroj, S., Santikunaporn, M., Chavadej, S. (2015). Micro-kinetic modeling of the catalytic dehydration of 1-decanol over precipitated γ-Al2O3. Reaction Kinetics, Mechanisms and Catalysis, 114(1): 75-91. https://doi.org/10.1007/s11144-014-0782-3
[22] Techopittayakul, T., Echaroj, S., Santikunaporn, M., Asavatesanupap, C., Chen, Y.H., Yuan, M.H. (2019). Kinetic modeling of 1-decene oligomerization to synthetic fuels and base oil over tungstated-zirconia catalyst. Reaction Kinetics, Mechanisms and Catalysis, 126(1): 529-546. https://doi.org/10.1007/s11144-018-1485-y