Hongliang Liu
© 2019 IIETA. This article is published by IIETA and is licensed under the CC BY 4.0 license (http://creativecommons.org/licenses/by/4.0/).
OPEN ACCESS
The coalbed methane (CBM) exists as a gas-liquid two-phase flow in the production well. However, the common bubble detector cannot identify bubbles in real time during the motion of the CBM gas-liquid two-phase flow. To solve the problem, this paper designs a real-time bubble shape detector for gas-liquid two-phase flow in CBM development wells using optical sensors. The detector design is based on the difference between gas and liquid in reflective index of light. With a STM32 processor, the light signals were converted to electricity signals, such that the light intensities are represented as electrical levels. The bubble velocity was calculated based on the distance between the probes of two sensors and the time for the bubble to pass through that distance. To obtain the bubble volume, the bubble diameter was firstly computed from the time the bubble takes to pass through the detection range of the sensor, and then coupled with the bubble velocity. The two time periods were determined by the high electrical levels outputted by sensor(s). Simulation shows that our detector measures the real-time bubble velocity and volume accurately under the CBM working conditions, while the traditional detectors can only identify the basic forms of bubble on the surface of media; moreover, our detector uses sapphire, a dampproof material, to mitigate the negative impact of humidity on detection accuracy. In addition, the probe does not react chemically with liquid, eliminating probe corrosion.
coalbed methane (CBM), gas-liquid two-phase flow, optical sensor, bubble velocity, bubble volume
Coalbed methane (CBM) is a form of natural gas extracted from coal beds. With methane as the main component, the CBM mainly exists in adsorbed form on coal matrix particles, partial free form within pores of coal beds, or dissolved form in the water of coal beds. To produce the CBM, wells are drilled into the coal beds, bringing groundwater to the surface. During discharge and decompression, gas-liquid two-phase flow is generated in the wellbore [1-5]. To effectively manage CBM production, it is necessary to monitor and control the gas-liquid two-phase flow of wellbore annulus [6]. The most direct way to determine the law of gas-liquid two-phase flow in CBM production wells lies in the real-time detection of bubble shape.
Many bubble detection devices have been developed for the gas-liquid two-phase flow in CBM production wells. For example, Wang et al. [7-12] designed a bubble detector based on light scattering imagining, which irradiates a laser beam into water, uses charge-coupled device (CCD) cameras to capture the lights scattered by bubbles, and processes the captured images on computer to obtain bubble speed, volume and local gas volume; the theoretical basis of the detector is that the laser beam can be scattered into lights of different intensities moving towards different directions, depending on the form of the bubbles. Zhang et al. [13-15] put forward a bubble detector based on the principle of ultrasonic attenuation: the ultrasonic signals attenuate differently after passing through different media. Considering ultrasound features and impedance difference between bubble and liquid, the detector sends ultrasonic signals of a certain frequency and power from one side of a tank, receives the signals on the other side of the tank, and analyzes the signal attenuation on software to get bubble velocity and volume. The above two bubble detectors can identify the basic forms of bubble on the surface of media, but cannot detect bubble shape in the gas-liquid two-phase flow in CBM production. To solve the problem, Wu et al. [16-18] created a real-time CBM bubble detector in the light of the conductivity difference between gas and liquid; with this detector, the bubble shape can be determined accurately in real time by the obvious difference in conductivity between media. Nevertheless, the DC electrodes of the device are easily eroded by the liquid in the gas-liquid two-phase flow, and the conductive materials of the electrodes are often dampened, both of which lowers the accuracy of the detected results.
To overcome the defects of the existing bubble detectors, this paper proposes a real-time detector of CBM bubble shape using optical sensors. The detector design is based on the difference between gas and liquid in reflective index of light. After detailing the detection methods, the author verified the detector performance through a simulation of the gas-liquid two-phase flow in a CBM production well.
2.1 Theoretical basis
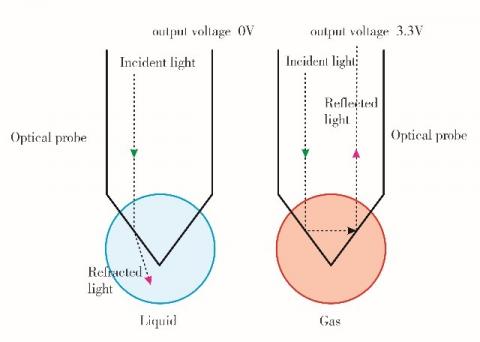
An optical sensor was designed based on the difference between liquid and gas phases in refractive index (1.35 vs. 1) [19]. As shown in Figure 1, the output power and electrical level are small when the probe contacts the liquid phase, and large when the probe contacts the gas phase. The different results are attributable to the difference in refractive index between the two phases. Therefore, the output power and electrical level of the received light can be used to judge whether the phase contacted by the probe is liquid or gas.
Figure 1. Working principle of optical sensor
2.2 Sensor design
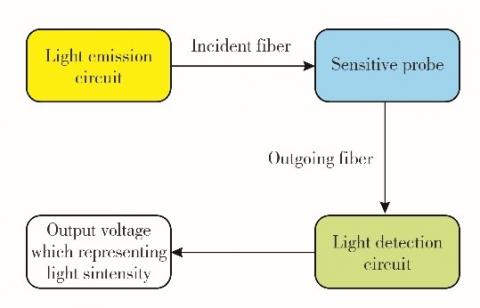
As shown in Figure 2, each optical sensor consists of a light emission circuit, a high-sensitivity probe, and a light detection circuit. Specifically, the light emission circuit generates a visible light (wavelength: 400~600nm) on a high brightness light-emitting diode (LED), and then transmits the light to the high-sensitivity probe via the incident fiber; the high-sensitivity probe (diameter: 400μm; tip angle: 20~30°) is made of sapphire, a dampproof material, to mitigate the negative impact of humidity on detection accuracy; the light detection circuit receives the light reflected by the emergent fiber, converts the light signals into electric signals with a photodiode, and amplifies the voltage of electric signals (corresponding to the intensity of light signals) via an amplifier.
Figure 2. Structure of optical sensor
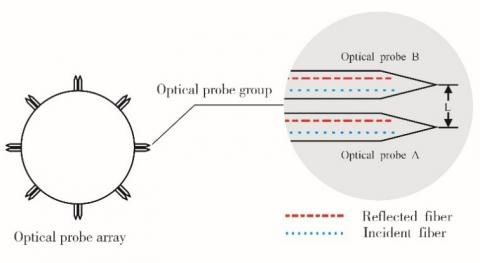
Our bubble shape detector measures the volume and velocity of bubbles in CBM production wells according to the intensity of reflected light signals in the gas-liquid two-phase flow. The structure of the detector is illustrated in Figure 3.
Figure 3. Structure of the bubble shape detector
Before use, the pup joint of the detector was connected to the tubing. To ensure the detection accuracy, eight sensor groups were arranged on the tubing at equal intervals along the circumference of the pup joint, forming an optical sensor array.
Each sensor group contains two optical sensors, denoted as A and B. The two sensors were installed in a stainless-steel sleeve. The end of incident fiber of one sensor was connected to the end of emergent fiber of the other sensor, and the probes of the two sensors were separated by a distance of L. Then, the sleeve was attached to the tubing.
3.1 Detection of bubble velocity
The bubble velocity was detected based on the data collected by both sensors A and B. Taking the probe tip of sensor B as the start point and the probe tip of sensor A as the end point, the moment the probe of sensor B contacted with bubble was defined as time t0, the moment the probe of sensor A contacted with bubble as time t1, the moment the probe of sensor B detected liquid as time t2, and the moment the bubble went out of the detection range of sensor A as t3.
Then, the four time points could be determined based on the electrical levels outputted by the circuits of the two sensors: the circuit of sensor B outputs a high electrical level at t0 and from t0 to t1, and a low electrical level at t2; the circuit of sensor A outputs a high electrical level at t1, and a low electrical level at t3.
Figure 4 presents the theoretical waveforms outputted by sensors A and B during the detection of bubble velocity.
Figure 4. The theoretical waveforms outputted by sensors A and B during the detection of bubble velocity
The theoretical bubble velocity can be calculated by:
V=L/∆t (1)
where, ∆t=t1-t0 is the time for the bubble to ascend by the distance of L.
3.2 Detection of bubble volume
The bubble volume was detected using the data collected by one of the two sensors. Taking the data of sensor, A for example, the moment the ascending bubble reached the probe of sensor A was defined as time t1, and the moment the bubble went out of touch with the probe as time t3. The circuit of sensor A outputs a high electrical level at t1 and a low electrical level at t3 (the light signals are weak due to the lack of contact).
Thus, the duration from t1 to t3 is the period, denoted as t4, in which the bubble was detected by the sensor. The two time points were captured and the value of t4 was computed automatically by the STM32 microprocessor. On this basis, the bubble diameter could be derived by D=V*t4. Assuming that the bubble is spherical, the bubble volume S can be expressed as:
$S=4 \pi r^{3} / 3$ (2)
where, r=D/2 is the radius of the bubble.
3.3 Determination of distance L
The distance L is of critical importance to the detection of bubble velocity and volume. If L is too small, the bubble will quickly pass from the probe of sensor A to that of sensor B. The short duration △t, coupled with noises, will cause error to the data captured by the STM32, leading to inaccurate calculation of bubble velocity; If L is too large, many bubbles may pass between the two probes at the same time, inducing errors in the detected velocity.
Chabot et al. [20-21] carried out multiple experiments with the L values of 10.3, 9.5, 4.5, 2.0 and 1.0mm, respectively. The experimental results show that L=10.3, 9.5 and 4.5mm are too large, and that L=1.0 is too small. Inspired by their research and repeated experiments, the L value is selected as 2mm for our research.
4.1 Simulation system
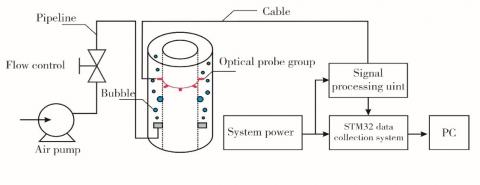
Figure 5 shows the simulation system of real-time bubble shape detection in the gas-liquid two-phase flow of CBM production wells. During the experiment, the bubbles were created by an air pump, and transmitted via a pipe into a flow control valve. The valve regulated the size and velocity of the bubbles. Then, the regulated bubbles moved along a pipe into a simulator of wellbore annulus of CBM production well, and started to ascend in the simulator. The ascending bubbles were detected by the optical sensor array, and the △t value was obtained by the STM32 microprocessor. The captured data were filtered, denoised, and computed. The final results were transmitted to a personal computer, and displayed as bubble velocity and volume.
Figure 5. The simulation system
4.2 Simulation steps
The liquid in the wellbore annulus of CBM production well was simulated as 25℃ clean water. The simulation was carried out in the following steps:
Step 1: Connect the air pump to the power supply and adjust the flow control valve, creating bubbles of different velocities and volumes.
Step 2: Connect the simulation system to the power supply, and initialize the STM32 microprocessor and the optical sensor detector.
Step 3: Take images of bubble motion with the standard bubble parameters acquisition device in the multiphase flow test system, and obtain the standard volume and velocity of each bubble using the image processing algorithm.
Step 4: Obtain the error between the bubble parameters measured by the proposed detector and the standard data acquired by the multiphase flow test system.
4.3 Results analysis
When the bubble has the same speed, if the bubble is small, the high-level time of the optical probe output signal is short; if the bubble is too large, the high-time time of the optical probe output signal is long.
4.3.1 Analysis on the data of a single sensor
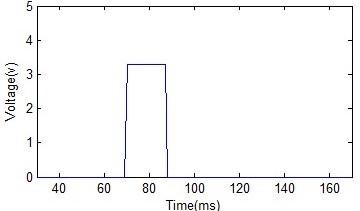
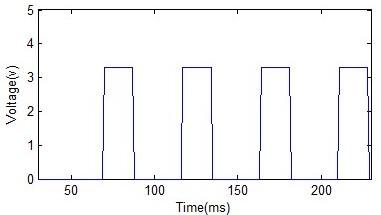
The data collected by a single sensor are plotted as the curves in Figure 6, where the two subgraphs respectively depict a single bubble and successive bubbles.
If the bubble velocity remains the same, the duration of high electrical level outputted by the sensor is positively correlated with the bubble volume.
In ideal conditions, the amplitude of the output signals is proportional to the intensity of the outputted light. To eliminate environmental interference, the output voltage was filtered, amplified and controlled within a set threshold, yielding a standard pulse waveform with an amplitude of 3.3V.
As shown in Figure 6, the amplitude of output signals was 0 when no bubble passed through the detection range, and was 3.3V when one or more bubbles passed through the detection range. Different modes of bubble motions displayed vastly different amplitudes, revealing that the optical sensor could effectively monitor the reflections of different media, and differentiate between gas phase and liquid phase.
(1) Single bubble
(2) Successive bubbles
Figure 6. The simulation curve of a single sensor
4.3.2 Analysis on the data of two sensors
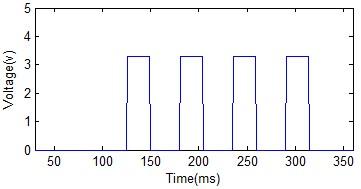
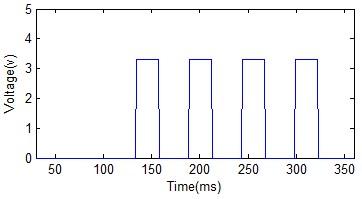
Under the bubble velocity of 0.261m/s and bubble volume of 113.81mm3 (both were measured by our detector), the data collected by two sensors are plotted as the curves in Figure 7, where the two subgraphs respectively depict the successive bubble curves of sensor B and sensor A.
It can be seen from Figure 7 that, for the same successive bubbles, sensor B detected the bubbles earlier than sensor A; for the same single bubble, the values of t0 and t1 could be obtained from the x-axis time differences of sensors A and B, and used to derive the volume and velocity of each bubble by formulas (1) and (2). The results show that the designed detector can measure bubble volume and velocity accurately.
(1) Successive bubble curve of sensor B;
(2) Successive bubble curve of sensor A
Figure 7. The simulation curves of two sensors
4.3.3 Comparative analysis
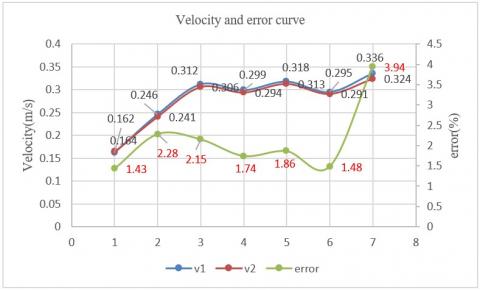
The bubble velocities and volumes obtained by our detector through the simulation were compared with those acquired by the standard bubble parameters acquisition device. Some of the comparative data are presented as Figure 8, where V1 and V2 are the bubble velocities captured by our detector and the standard device, respectively, and Volume 1 and Volume 2 are the bubble volumes acquired by our detector and the standard device, respectively.
Figure 8. Comparison of the bubble velocities and volumes obtained by our detector and the standard device
The comparison shows that, when applied to the CBM production well, our detector can measure the real-time bubble velocity with an accuracy of ±4% and the real-time bubble volume with an accuracy of ±8%. The volume error was slighter higher than the velocity error, because the volume is derived by formula (2) based on the velocity. Any error in velocity will induce an even larger error in volume. In addition, when a bubble becomes larger, it will pass through the detection range more rapidly. In this case, the velocity measurement will become less accurate, leading to a larger error in volume computation.
Our detector measures the real-time bubble velocity with an accuracy of ±4% and the real-time bubble volume with an accuracy of ±8%. While the traditional detectors can only identify the basic forms of bubble on the surface of media, our detector is able to work in <30mm annulus of CBM production wells.
Compared with the conductivity-based detector, our detector uses sapphire, a dampproof material, to mitigate the negative impact of humidity on detection accuracy. In addition, the probe does not react chemically with liquid, eliminating probe corrosion.
The future research will try to improve the measuring accuracy of bubble volume and velocity in the gas-liquid two-phase flow. A possible strategy is to process the data collected by the sensor array by the adaptive weighted mean filtering algorithm.
t0 ——time of probe B starts to reach bubble,unit is ms
t1——time of probe A starts to reach bubble, unit is ms
t2——time of bubble leave probe B, unit is ms
t3——time of bubble leave probe A, unit is ms
t4——time of bubble passes through probe, unit is ms
∆t ——time of bubble travel distance between apex of probe A and B, unit is ms
V——speed of bubble, unit is m/s
L——distance between probe A and B, unit is mm
S——bubble volume, unit is mm3
D——bubble diameter, unit is mm
R——bubble radius, unit is mm
[1] Vince, M., Breed, H., Krycuk, G., Lahey Jr, R.T. (1982). Optical probe for high-temperature local void fraction determination. Applied Optics, 21(5): 886-892. http://www.opticsinfobase.org/abstract.cfm?URI=ao-21-5-886
[2] Chabot, J., Lee, S.L.P., Soria, A., de Lasa, H.I. (1992). Interaction between bubbles and fiber optic probes in a bubble column. Canadian Journal of Chemical Engineering, 70(1): 61-68. https://doi.org/10.1002/cjce.5450700110
[3] Cartellier, A., Achard, J.L. (1991). Local phase detection probes in fluid/fluid two-phase flows. Review of Scientific Instruments, 62(2): 279-303. https://doi.org/10.1063/1.1142117
[4] Luo, X.B., Zhu, D.Y., Qiao, W., Shi, L.M. (2008). Wettability of high surface energy solid and its surface tension calculation. Journal of Materials Science & Engineering, 26(6): 932-936.
[5] Yin, J.Y., Jiang, H.W., Li, L., Zhu, L., Wu, J., Yan, W., Jiang, H.X. (2014). Bubbles formation from the bottom region of borehole and their initial average diameter calculation. Science Technology and Engineering, (19): 30-33.
[6] Clarkson, C.R., Jordan, C.L., Llk, D., Blasingame, T.A. (2012). Rate-transient analysis of 2-phase(gas+water) CBM wells. Journal of Natural Gas Science and Engineering, 8: 106-120. https://doi.org/10.1016/j.jngse.2012.01.006
[7] Wu, C., Wu, X.M., Wen, G.J., Li, R., Zhang, F., Xu, J., Han, L. (2015). Real-time detection on CBM bubble based on electrical conductivity. Journal of China Coal Society, 40(9): 2137-2143. https://doi.org/10.13225/j.cnki.jccs.2014.1743
[8] Jahanbani, A., Shadizadeh, S.R. (2009). Determination of inflow performance relationship by well testing. Society of Petroleum Engineers, 6(6): 1-11.
[9] Rotramel, J., Bell, M. (2011). A pilot test of continuous bottom hole pressure monitoring for production optimization of coalbed methane in the Raton Basin. SPE Production and Operations Symposium. Society of Petroleum Engineers.
[10] Leifer, I., de Leeuw, G., Cohen, L.H. (2003). Optical measurement of bubbles: System design and application. Journal of Atmospheric and Ocean Technology, 20(9): 1317-1332. https://doi.org/10.1175/1520-0426(2003)020<1317:omobsd>2.0.co;2
[11] Xu, L.J., Chen, G., Shao, J.B., Xue, Y. (2012). Numerical simulation of motion behavior of single bubble rising in still water. Journal of Shenyang Agricultural University, 43(3): 357-361. https://doi.org/10.3969/j.issn.1001-5485.2011.09.004
[12] Meng, Z.P., Liu, C.L., Ji, Y.M. (2013). Geological conditions of coal-bed methane and shale gas exploitation and their comparison analysis. Journal of China Coal Society, 38(5): 729-735. https://doi.org/10.1093/ecam/nep072
[13] Li, G.B., Li, G.F. (2012). Study on the differences and main controlling factors of the coal-bed methane wells between single layer and multilayer drainage. Journal of China Coal Society, 37(8): 1353-1358.
[14] Duong, A.N. (2010). Inflow performance relationships for oil wells with rate dependent shin. Society of Petroleum Engineers, 57(6): 1-10. https://doi.org/10.2118/86-37-37
[15] Li, R., Wu, X.M., Li, J. (2014). Multi-parameter detection of two-phase fluid in coal-bed methane wells. Journal of China Coal Society, 39(9): 1862-1867.
[16] Julia, J.E., Harteveld, W.K., Mudde, R.F., Van den Akker, H.E.A. (2005). On the accuracy of the void fraction measurements using optical probes in bubbly flows. Review of Scientific Instruments, 76: 035103/1-035103/13. https://doi.org/10.1063/1.1862192
[17] Xue, J.L., Al-Dahhan, M., Dudukovic, M.P., Mudde, R.F. (2008). Bubble velocity, size, and interfacial area measurement in bubble columns by four-point optical probe. American Institute of Chemical Engineers, 54(2): 350-363. https://doi.org/10.1002/aic
[18] Guet, S., Fortunati, R.V., Mudde, R.F., Ooms, G. (2003). Bubble velocity and size measurement with a four-point optical fiber probe. Particle & Particle Systems Characterization, 20(3): 219-230. https://doi.org/10.1002/ppsc.200390028
[19] Luther, S., Rensen, J., Guet, S. (2004). Bubble aspect ratio and velocity measurements using a four-point fiber-optical probe. Experiments in Fluids, 36: 326-333. https://doi.org/10.1007/soo348-003-0725-7
[20] Chabot, J., Lee, S.L.P., Soria, A., de Lasa, H.I. (1992). Interaction between bubbles and fiber optic probes in a bubble column. The Canadian Journal of Chemical Engineering, 70(1): 61-68. https://doi.org/10.1002/cjce.5450700110
[21] Xue, J.L., Al-Dahhan, M., Dudukovic, M.P., Mudde, R.F. (2008). Four-point optical probe fou measurement of bubble dynamics: Validation of the technique. Flow Measurement and Instrumentation, 19(5): 293-300. https://doi.org/10.1016/j.flowmeasinst.2007.10.004