OPEN ACCESS
Building insulation is commonly realized using materials obtained from petrochemicals or from natural sources processed with high energy consumptions, causing significant harmful effects on the environment. The “sustainability” applied to building design has encouraged many researches to develop thermal and acoustic insulating materials using natural or recycled materials. Many natural materials were already used in ancient times to thermally insulate the dwellings and to give resistance: straw and reed are some representative examples. Aim of this paper is to evaluate the influence of reed stems and straw on the thermal and mechanical performances of cement. To reach this, several types of mixes were prepared: a specimen as reference mix without any addition of fibers and some more specimens with reed only, with straw only, and finally the combination between straw and reed in different percentage. The tests were performed to determine the thermal conductivity, the compressive and flexural strength of the cement mortar panels. The results showed that straw, if combined with reed stems, could be considered as a valid reinforcement in a cementitious matrix characterized by enhanced thermal insulation and good mechanical properties. ENEA researchers have also applied a statistical method to the obtained test results in order to develop a predictive model of compression and flexural behavior of fiber-reinforced specimens with different percentages of organic fibers in the mixture cementitious.
cement mortar, natural organic fiber, thermal and mechanical characterization, predictive model, statistical analysis
It is known that in the recent past the production and transport of raw materials required large amounts of CO2 emissions, with obvious repercussions on the environment [1].
To decrease this high impact recent development strategies of the construction sector have meant that sustainability was an essential element in all phases of the building process, from design to construction and renovation of the property [2].
In this situation, the natural materials of organic origin (NM) and those from recycling and reuse operations [3] have taken a good importance even more pronounced considering that they tried to reduce costs and emissions related to transport, emphasizing local materials, their performance and their use in the construction of buildings that, for this reason, have taken on the definition of “green buildings” [4].
The researchers are increasingly engaged in the study and characterization of NM, widespread and easily available: their behavior with respect to thermal stresses, their strength and durability within cementitious composite materials as fibers, are being investigated to allow use improving the behavior and mechanical energy as a result of external stresses [5].
The easiest application of natural fibers in the form of fibers is as reinforcement in concrete [6], both because they improve the mechanical performance of composite both because they have a low environmental impact. Furthermore natural fibers are cheap (the cost is very little when compared with the total cost of the composite) and locally available in abundance in many countries.
Natural fibers are present in a large scale in many parts of the world and are easily available.
In many cases they are byproducts of the agriculture industry and their production techniques are less dependent on nonrenewable energy sources, producing less pollutants and green-house gas emissions. In this way organic natural fibers may be considered environmental friendly if compared to synthetic or steel fiber reinforced materials [7].
Organic natural fibers can be used as reinforcement either in cement matrix or polymer composites.
This paper has studied their performance as discontinuous and randomly distributed fibers in a cementitious matrix of thin prefabricated wall panels as a good substitute of conventional materials [8], both for the improvement of the mechanical performance both for the increase of thermal insulation.
Among all organic natural fibers, this paper has considered reed and straw as reinforcement of cement mortars and presents some early results on their thermal and mechanical properties [9].
The bibliography regarding these two organic natural fibers is not particularly rich but their potential as successful substitutes of inorganic and artificial elements in the field of construction is very high considering the advantages of environmental efficiency, light weight, low cost and good insulating properties [10].
The results of this research are a first step on a path of exploitation of natural resources with low energy and environmental impact made from the materials research group of ENEA Trisaia Research Center.
The main materials used for the preparation of specimens have been:
(1)Common reed (Arundo Donax-AD). It is a perennial rhizomatous grass that grows plenty and naturally in all the temperate areas of Europe (mainly in the countries of the Mediterranean area) and can be easily adapted to different climatic conditions.
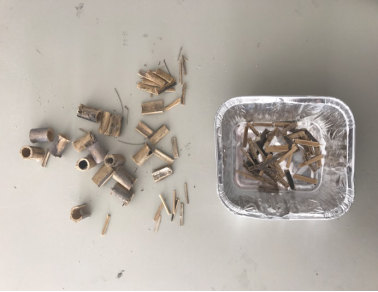
Thanks to its high growth rate (up to 5 cm per day under optimum conditions), it represents an invasive and aggressive species with almost no economic value, so its disposal is difficult [11]. The common reed has been utilized by man since ancient times, thanks to its world-wide dominance. It is often cheap and readily available as a raw material. Reed stems can be used to produce insulation material for walls and roofs. It is a poor conductor of heat but also a good conductor of humidity, so it allows a good indoor climate in both winter and summer [12]. In this work we have used fibers obtained from plants of Arundo Donax, cut in the middle of 2014, then naturally dried for about 1 year in non-air-conditioned environment and finally stored in pieces of about 40 cm, reduced for this application by scissors as small strips (about 5 mm width and 20 mm length) (Figure 1).
Figure 1. Arundo Donax before and after cutting
(2)Straw. The material used for this research has been obtained from plants of durum wheat (Triticum durum Desf.), characterized by medium height and late production.
Despite an its widespread historical use as a building material, at present a large amount of straw is not sufficiently and reasonably used. Straw is a very good and renewable thermal insulation material [13]. It is cheap and easy to obtain. For all these reasons, the straw has focused an important new interest from the world of research both public and private to achieve sustainable development [14].
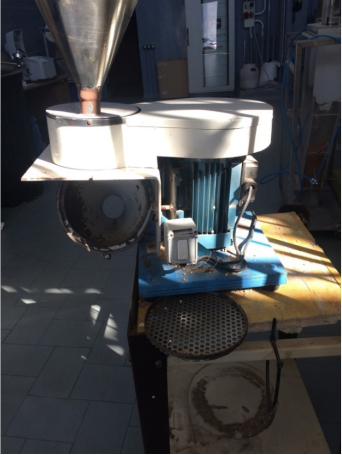
The straw used in this research has been produced at the end of June 2015, in the form of compacted bales of approximate dimensions, stored in a dry environment, not air-conditioned, cut for the final use by a knife mill with a 10 mm grid (Figure 2, Figure 3).
Figure 2. Knife mill
Figure 3. Cut straw
(3)Mortar. A commercial premixed mortar (PM) with a particle size < 1.5 mm and a compressive strength of about 10 MPa (EN 1015-11:2007) has been used. The data sheet provides that the water for the mix is about 200 g /1 kg of premix.
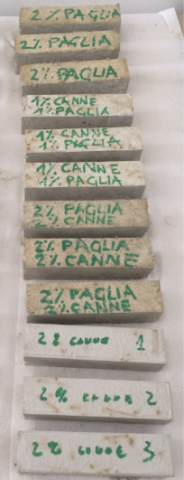
For thermal and mechanical tests, five typologies of specimens have been manufactured, each of one characterized by different percentages of components (reed, straw, PM and water). One of these typologies has been assumed as reference (REF) without any percentage of fibers as showed in the next table 1.
Table 1. Component percentage by type of mixture
|
|
REF g |
2C g |
2P g |
1C1P g |
2C2P g |
|
PM |
5432 |
5432 |
5432 |
5432 |
5432 |
|
Reeds |
- |
108 |
- |
54 |
108 |
|
Straw |
- |
- |
108 |
54 |
108 |
|
Water |
1358 |
1358 |
1358 |
1358 |
1458 |
For simplicity of reasoning and referring to scientific literature, the amount of fibers was calculated as a percentage on the amount of dry material. Regarding the symbology: 2C contains 2 % of reeds on PM; 2P contains 2 % of straw on PM; 1C1P contains 1 % of reeds and 1 % of straw on PM; 2C2P contains 2 % of reeds and 2 % of straw on PM.
The water content has been set to a value of 1358 g in order to ensure a water/cement ratio of 0.25. After some preliminary tests, researchers have noted that a water/cement ratio of 0.25 made possible to get a good workability of cement mixture except in the case of the specimen with 2 % reed and 2 % straw where it was necessary to increase the programmed quantity of water of 100 g, in order to better ensure the workability of the mix, greatly deteriorated due to the insertion of ever-increasing percentage of natural fibers.
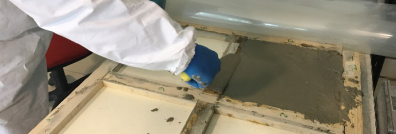
Figure 4. Wooden rectangular formworks
The materials were added to the mixture in a sequential and gradual way, and then mixed with a concrete mixer impeller (800 rpm for 10 minutes).
For each kind of mixture, several specimens were realized.
The specimens used for thermal test were aged in wooden formworks in the form of rectangular panels for 28 days (Figure 4), while test specimens for flexural and compressive strength according to EN 1015-11 were aged in special moulds.
In detail we realized:
(1)two specimens for thermal conductivity tests according to EN 12664:2002 (300x300x20mm) (Figure 5);
(2)three specimens for mechanical strength tests according to EN 1015-11:2007 (160x40x40mm) (Figure 6).
The next table 2 shows the average density of all the kind of specimens, according to EN 1015-10.
Table 2. Determination of density
|
Mixture |
Density |
|
[kg/m³] |
|
|
REF |
1646.36 |
|
2C |
1606.64 |
|
2P |
1512.50 |
|
1C1P |
1476.95 |
|
2C2P |
1508.59 |
Figure 5. Specimens for thermal conductivity tests
Figure 6. Specimens for mechanical strength tests
Experimental tests were performed to investigate thermal and mechanical properties of manufactured specimens containing different percentages of fibers.
3.1 Thermal properties
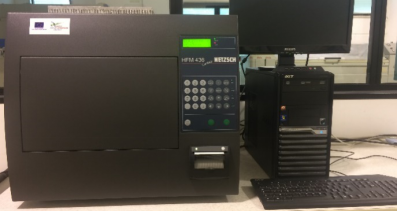
The apparatus used for thermal conductivity measurements was an heat flow meter in “single sample in a double configuration”, placed in a conditioned laboratory at a temperature of 23 ± 2 °C and relative humidity 50 ± 5 %, to ensure observance of the test conditions required by the standard EN 12664:2002 “Thermal performance of building and products – Determination of thermal resistance by means of guarded hot plate and heat flow meter methods – Dry and moist products of medium and low thermal resistance” (Figure 7).
Figure 7. NETZSCH heat flow meter HFM 436/0/1
The specimen is placed between two plates placed at two different temperatures (ΔT).
The heat flux (q) which passes through the specimen is measured by heat flux transducers: with the achievement of thermal equilibrium the test ends. For the purpose of the analysis is considered only a central portion (100x100mm).
Being l the thermal conductivity of the specimen, d the specimen thickness, ΔT the temperature difference between the two faces of the test and A the area through which the heat passes, the relation between these parameters to achieve balance heat is expressed by the Fourier equation:
$\Phi \,=\,\lambda \cdot A\cdot \frac{\Delta T}{d}$ (1)
The two transducers measure the heat flow through the specimen. The signal from a transducer (expressed in Volts (V)) is proportional to the heat flow through the transducer.
In the heat flow meter, the transducer area is the area through which passes the heat and is constant for all the specimens, then:
Φ = N · V (2)
where N is the calibration factor that relates the potential difference of the transducers to heat flow through the specimen. Resolving isolating l, thermal conductivity is given by following relation:
$\lambda \,=\,\frac{N\cdot V\cdot d}{\Delta T\cdot A}$ (3)
Average temperature of equilibrium of tests was set to 10 °C and the ΔT between the plates is 20 °C. The following Table 1 shows the average λ values obtained for all kind of tested specimens.
The analysis of obtained results highlights that the decrease of conductivity, if compared with that one of reference specimen (REF), is 27.0 % in 2C2P, 10.4 % in 1C1P and it seems irrelevant in 2C and 2P.
3.2 Mechanical properties
To investigate the mechanical properties of mortar containing natural organic fibers, three samples (dimension 160x40x40 mm) for each mixture were prepared for flexural and compressive strength tests, according to EN 1015-11 “Methods of test for mortar for masonry – Determination of flexural and compressive strength of hardened mortar”.
The test apparatus used for mechanical tests was a frame Dual Column for both flexural and compressive strength.
Regarding flexural tests, the instrumentation applies the load at a rate specified in UNI 1015-11 standard; in this phase load rate was set to 50 N/s since for these plaster mortars a low resistance is expected.
For each specimen the maximum load applied (F) was recorded and expressed in Newton, then flexural strength (f) was calculated in N/mm2, to the nearest 0.05 N/mm2 using the following equation:
$f=\,1.5\cdot \frac{Fl}{b{{d}^{2}}}$ (4)
where:
b = width of specimen (mm).
d = depth of the specimen (mm).
The average flexural strength was calculated to the nearest 0.1 N/mm2.
The next Table 2 shows average flexural strength according to EN 1015-11 for each kind of mixture:
Table 4. Results of flexural tests
|
Specimen |
Flexural strength [MPa] |
(f - fREF) / fREF [%] |
|
REF |
2.84 |
-- |
|
2C |
2.61 |
-8.2% |
|
2P |
1.38 |
-51.4% |
|
1C1P |
1.82 |
-36.0% |
|
2C2P |
1.90 |
-33.1% |
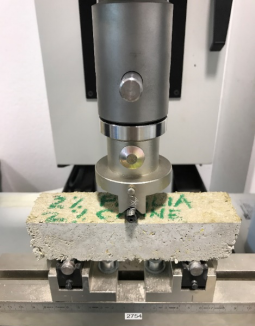
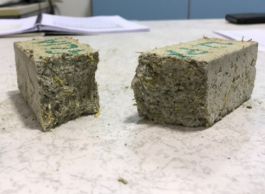
Comparing the flexural strength values with respect to the specimen REF, the specimen 2P (only straw) has a reduction of 51.4 %, the reduction for the specimen 1C1P and 2C2P (straw and reed in different percentage) is around 35 %. The best relative results is for the specimen 2C (only reed), totally in accordance with individual material properties (Figure 7, Figure 8, Figure 9).
Figure 8. Three point flexural test on 2C2P specimen
Figure 9. Section after breaking of 2P specimen
In compression tests the load rate was set around to 300N/s, according to EN 1015-11.
For each specimen the maximum load applied (N) was recorded and expressed in Newton; the compressive strength (σ) was calculated to the nearest 0.05 N/mm2 as the maximum load carried by the specimen divided by its cross-sectional area.
For all realized mixtures, average of compressive strength has been calculated to the nearest 0.1 N/mm2.
Following Table 3 shows average values of compressive strength according to EN 1015-11.
Table 3. Results of thermal conductivity tests
|
Specimen |
straw fiber [%] |
reed fiber [%] |
Thermal conductivity λ [W/(mK)] |
(λ- λ REF) / λ REF [%] |
|
REF |
0 |
0 |
0.278 |
-- |
|
2C |
0 |
2 |
0.291 |
4.7 % |
|
2P |
2 |
0 |
0.270 |
-2.9 % |
|
1C1P |
1 |
1 |
0.249 |
-10.4 % |
|
2C2P |
2 |
2 |
0.203 |
-27.0 % |
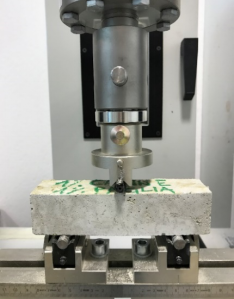
Figure 10. Breaking surface of 1C1P specimen
Table 5. Results of compressive tests
|
Specimen |
Compressive strength [MPa] |
(σ - σ REF) / σ REF [%] |
|
REF |
7.35 |
-- |
|
2C |
6.73 |
-8.4% |
|
2P |
2.78 |
-62.2% |
|
1C1P |
4.59 |
-37.5% |
|
2C2P |
4.99 |
-32.1% |
Comparing the compression strength values with respect to the specimen REF, the specimen 2P has a reduction of 62.2 %, the reduction for the specimens 1C1P and 2C2P is around 35 %. The best relative results is for the specimen 2C (only reed), totally in accordance with individual material properties (Figure 9).
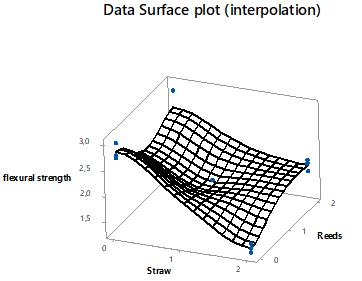
Figure 11. Interpolated surface for flexural strength
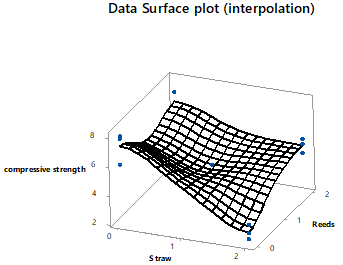
Figure 12. Interpolated surface for compressive strength
The experimental data collected (compression, flexure, conductivity) were processed according to statistical methods with the Minitab software.
The DOE analysis was aimed to investigate the influence of different percentages of the reed and straw on the mechanical characteristics and the thermal conductivity of the specimens.
For the flexure strength test were acquired data of three tests for each type of specimens while the data acquired for the compression strength test were the average of tests on the two parts obtained from the specimens after the flexure strength test. The Minitab software, starting from the acquired data, allowed to obtain the interpolated surfaces relative to the flexural (Figure 10) and compressive strength (Figure 11), shown in the graphs below with an indication of the performed measurements.
As shown, the response for flexural and compressive strength have practically similar trend.
The statistical analysis showed the existence of a strong correlation between the data of flexure strength and compression strength: the Pearson index, variable between -1 and 1, and with much higher absolute value the greater the degree of correlation, is equal to 0.990 with a p-value of 0.001.
The same analysis excludes the correlation between conductivity and flexure strength and between conductivity and compression strength.
Thanks to simple calculations it can be established that the ratio σ max/f max is approximately 2.5 ÷ 2.6 for almost all values obtained.
Due to strong correlation, the analysis of experimental plan was made only on conductivity and compression strength and the resulting observations on compression strength were then also extended to flexural strength.
The analysis of the compression surface, using a “Full Quadratic” model with a confidence level of 95%, has provided an estimate of the coefficients of the quadratic model. Therefore the regression model that best describes the fit of the data is:
σ = 7.988 – 2.740C – 2.604P + 1.055C2 + 0.891CP (5)
where C and P are respectively the percentages of reed and straw.
Due to a strong multicollinearity (predictors coefficients correlated between them) it was not possible to estimate the coefficient P2 which is therefore not considered in the exposed model.
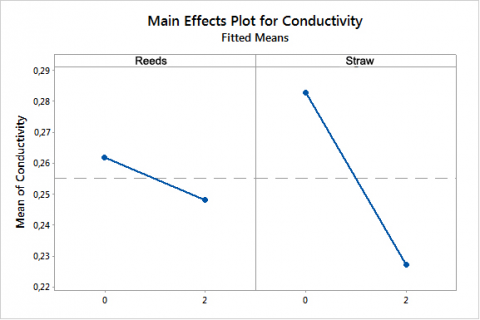
The graph of the main effects (Figure 12) indicating the overall effect of the variation of a factor, shows that the straw has a high effect on the response variable; increasing the percentage of straw in the composite the compressive strength decreases drastically.
On the other hand the behavior of the compression strength of the composite reinforced with straw has not a linear trend.
Increasing the percentage of reeds the shape of the curve is negative up to the value 0.8 % beyond which the resistance tends to increase.
Figure 13. Main effect plot for compressive strength
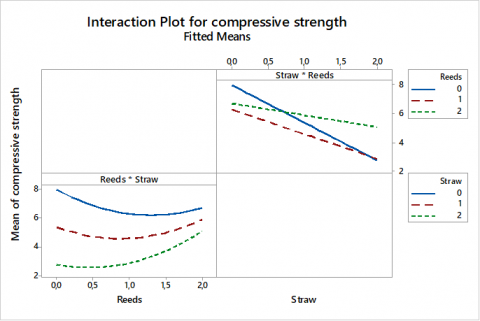
The study of interaction effects (Figure 13) is very interesting, i.e. the effects that the percentage variation of a factor has on the investigated characteristic, for a given percentage of the other factor.
Regarding the reeds, their contribution to the change in compression strength is not very dependent on the percentage of the straw, with beneficial effects much more evident as higher is the percentage of straw.
Figure 14. Interaction plot for compressive strength
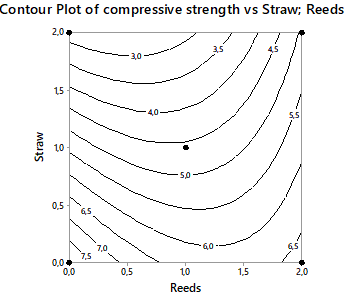
Figure 15. Contour plot of compressive strength
Figure 16. Contour plot of flexural strength
The contribution to the variation of resistance to compression given by the straw depends greatly on the percentage of reeds present in the mixture, at least in the range of variability of the factors.
In any case, an increase in the percentage of straw leads to a decrease of the compressive strength.
From the previous graphics is therefore possible to state that the addition of straw to the mixture does not give positive effects to the strength, while the addition of reeds has a dual behavior depending on whether we are above or below a threshold that depends from straw percentage.
The described trend is clearly evident in the next two contour plot (Figure 14, Figure 15).
With the same approach, but with methods of factorial design, data on the thermal conductivity were analyzed.
The analysis of residues and the adequacy of the model led to the conclusion that a representative model of the trend of this characteristic is a linear model.
Figure 17. Main effect plot for thermal conductivity
The limited number of tests does not allow in-depth analysis. However, it is possible to highlight that the reeds have a main effect going from “high” value to “low” of -0.014, while the straw the main effect is - 0.055.
The straw addition involves reductions in thermal conductivity in a way much higher with respect to the reeds (Figure 16).
From the above, it is therefore possible to write the regression model of conductivity
l = 0.2909 – 0.0070 C – 0.0275 P (6)
where C is the percentage of reed and P is that of the straw.
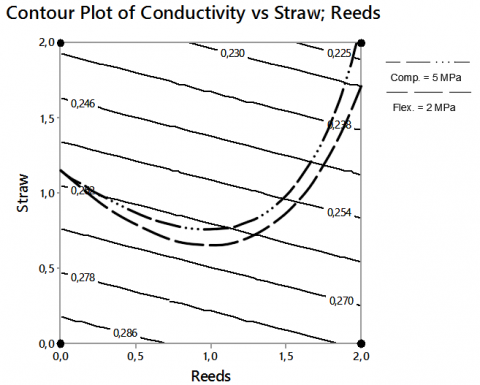
The following graph (Figure 17) shows the contour plot of the conductivity reeds VS straw, where also two limits are overlapped: the compression strength curve of a mortar classified as M5, equal to 5 MPa (dash 3 dots) and the flexural strenght curve of 2 MPa (dashed), both of acceptable values for the types of mortars used in this work.
The 5 MPa value comes from having conducted tests on specimens produced from mortar classified as Class M10, using a constant amount of water for all specimens and higher than that specified by the manufacturer in order to obtain a better workability of the mix, choice also made in order to eliminate different resistance variations due to different quantities of water.
This choice has resulted in the loss of the M10 feature on the specimen REF and therefore it is considered suitable a strength corresponding to the class M5.
The method of overlay of the response surface shows that adding reeds and/or straw generally decreases the mechanical strength of the material while the thermal conductivity of the material decreases, reaching values of λ up to 0.222 W/(mK) (with a reduction of 27 % compared to REF specimen) to which correspond percentages of reeds and straw of about 2 % each.
The contour plot also shows that the isocurve in the right part of the graph which corresponds to a compressive strength of 5 MPa, takes on a roughly vertical slope, so it is not excluded that in a subsequent scheduling of additional tests can be investigated the region in the neighborhood of previously identified point in order to ensure the possibility of further improving the thermal conductivity while maintaining the desired mechanical properties.
Figure 18. Contour plot of conductivity
This research establishes a strong correlation between the compressive strength and flexural strength in the case of adding reeds and straw inside the cementitious mix.
The straw tends to decrease the mechanical characteristics if added to the mortar and the amount of reduction depends on the percentage of reeds present in the mix; also its addition reduces the thermal conductivity.
The reeds normally contribute to increase the mechanical resistance of the mortar, but they have an effect of reduction up to a certain threshold, an average of 0.8%, beyond which the resistance returns to increase; the reeds then act as a reinforcing element in a material with low mechanical characteristics. The effect on the conductivity is still positive, although lower than the straw.
By overlapping the response surfaces it is possible to identify a percentages variation region of reeds and straw maintaining the mechanical characteristics within acceptable limits and to connect this value to the thermal conductivity.
In the case of study we have identified the area with a reed and straw percentages equal to 2 % in which the flexural strength is equal to 2 MPa and the higher compression is 5MPa with a conductivity equal to 0.203 W/(mK).
In a future development, considered range of values of straw and reeds equal to 2 %, 3 %, the developed regression models indicate a compressive strength in the central point, equal to 6.8 MPa and l equal to 0.205 W/(mK).
|
N |
calibration factor, dimensionless potential difference of the transducers, V |
|
V |
maximum load applied, N |
|
F |
flexural strength, N.mm-2 |
|
f |
distance between the axes of the support |
|
l |
rollers, mm |
|
b |
width of specimen, mm |
|
d |
depth of the specimen, mm |
|
Greek symbols |
|
|
l |
thermal conductivity, W.m-1. K-1 |
|
ΔT |
temperature difference between the two faces of the test, K |
|
Φ |
heat flux, W |
|
σ |
compressive tension, MPa |
|
ε |
deformation, dimensionless |
[1] Mirandola A., Lorenzini E. (2016). Energy, environment and climate: From the past to the future, International Journal of Heat and Technology, Vol. 34, No. 2, pp. 159-164. DOI: 10.18280/ijht.340201
[2] Sandrolini F., Franzani E. (2009). Embodies energy of building materials: A new parameter for sustainable architectural design, International Journal of Heat and Technology, Vol. 27, No. 1, pp. 163-167. DOI: 10.18280/ijht.270123
[3] Claramunt J., Ardanuy M. Garcia-Hortal J.A, Filho R.D.T. (2011). The hornification of vegetable fibers to improve the durability of cement mortar composites, Cement and Concrete Composites. Vol. 33, No. 5, pp. 586- 595. DOI: 10.1016/j.cemconcomp.2011.03.003
[4] Pittaluga I., Schenone C., Borelli D. (2011). Sound absorption of different green roof systems, Journal of the Acoustical Society of America, Vol. 130, No. 4, p. 2317.
[5] Boulaoued I., Amara I., Mhimid A. (2016). Experimental Determination of themal conductivity and diffusivity of new building insulating materials, International Journal of Heat and Technology, Vol. 34, No. 2, pp. 325-331. DOI: 10.18280/ijht.34024
[6] Di Bella G., Fiore V., Galtieri G., Borsellino C., Valenza A. (2014). Effects of natural fibers reinforcement in lime plasters (kenaf and sisal vs. Polypropylene), Construction and building materials, Vol. 58, pp. 159-165. DOI: 10.1016/j.conbuildmat.2014.02.026
[7] Joshia S.V., Drzalb L.T., Mohantyb A.K., Arorac S. (2004). Are natural fiber composites environmentally superior to glass fiber reinforced composites, Composites Part A: Applied Science and Manufacturing publishes, Vol. 35, pp. 371-376. DOI: 10.1016/j.compositesa.2003.09.016
[8] Aymerich F., Fenu L., Francesconi L., Meloni P. (2016). Fracture behaviour of a fiber reinforced earthen material under static and impact flexural loading, Construction and Building Materials, Vol. 109, pp. 109-119. DOI: 10.1016/j.combuildmat.2016.01.046
[9] Grădinaru C.M., Bărbuță M., Șerbănoiu A.A., Babor D. (2016). Investigations on the mechanical properties of concrete with sheep wool fibers and fly ash, Bulletin of the Transilvania University of Braşov, Vol. 9, No. 58, pp. 73-80.
[10] Selcuk S., Lamanna A.J. (2007). Feasibility investigation of oriented straw cable cement composites, Composites Part A: Applied Science and Manufacturing publishes, Vol. 38, No.9, pp. 1965-1974. DOI: 10.1016/j.compositesa.2007.05.009
[11] Fiore V., Scalici T., Valenza A. (2014). Characterization of a new natural fiber from Arundo donax L. as potential reinforcement of polymer composites, Carbohydrate Polymers, Vol. 106, pp. 77-83. DOI: 10.1016/j.carbpol.2014.02.016
[12] Köbbing J.F., Thevs N., Zerbe S. (2013). The utilisation of reed (Phragmites australis): A review, Mires and Peat, Vol. 13, No. 01, pp. 1-14.
[13] Liu J., Zhou H., Ouyang P. (2013). Effect of straw mixing amount on mechanical properties of admixture-adding hollow block, Journal of Wuhan University of Technology-Mater. Sci., Vol. 28, No. 3, pp. 508-513. DOI: 508-513.10.1007/s11595-013-0722-5
[14] Mansour A., Srebric J., Burley B.J. (2007). Development of straw-cement composite sustainable building material for low-cost housing in Egypt, Journal of Applied Sciences Research, Vol. 3, No. 11, pp. 571-580.