OPEN ACCESS
The San Martino University Hospital is the largest medical facility in the city of Genova. Internal electric power distribution takes place via a 15 kV Medium Voltage grid, connected to the ENEL distribution network via two Points of Delivery (PoD). Two co-generators were installed for a total of 3 MW generation capacity. Loads add up to a total of 4 MW. The network has a ring configuration and it is composed of 14 MV/LV cabins working in an in-out configuration. The San Martino hospital has implemented a real time energy monitoring system. The system is used as a tool to supervise energy demand at every MV/LV cabin and to support the management policies of buildings and technical facilities, in order to optimize energy consumption by pursuing energy saving opportunities. This paper presents how the real time monitoring system was implemented interfacing directly the MV protections. It presents the process of assessing the consumption profiles of the hospital facilities, in order to highlight issues and identify the actions to reduce energy waste. A specific case study is developed and conclusions drawn as to how a monitoring system can supply its users with a tool to improve efficiency and reduce costs.
energy efficiency, energy monitoring system, hospital facilities, demand side management, energy consumption optimization
Despite the economic crisis and the consequent reduction of energy demand in Italy, electric energy consumption in the tertiary sector (or services sector) has continued to grow over time. Health care facilities are among those presenting higher requirements for electric energy, to ensure delivery of all services and comfort conditions for patients, visitors and working personnel.
The hospital is a structure with significant electric and thermal energy requirements over the 24 hours for 365 days a year. The complexity of the energy system for each facility may differ from hospital to hospital, depending on several factors such as:
- type and volume of the building;
- health care services offered;
- geographical location;
- technological plants (type, number and size).
Electricity consumption in hospitals is mainly related to: air conditioning systems, lighting, electromedical devices, safety systems, ICT, treatment.
In recent years, the theme of energy efficiency has been gaining increasing popularity, especially in anticipation of the European objectives in the field of reduction of energy consumption placed for 2020 and 2030.
It is therefore important to identify the least efficient energy systems and to improve their performance through specific energy diagnoses. The legislation on energy efficiency focuses much of its attention on the measurements of energy consumption on the part of the network operator; the development of energy audit activities and the efficiency of production processes instead impose an extension of the monitoring systems within the energy production systems. Not to be neglected is ultimately the framework of the monitoring systems in the field of active demand management, as a common resource for dispatching and system security [1].
For these reasons, especially in the case of relevant energy-consuming facilities such as hospitals, it is very important to be able to rely on a tool for real time energy monitoring [2]. This article presents the implementation of a real time energy monitoring system for the San Martino University Hospital in Genova. In the first section of the paper the internal power distribution system of the hospital is presented, successively the monitoring system and its implementation is described. Finally, a brief case study regarding the application of the energy monitoring platform to some energy intensive buildings part of the San Martino hospital district is provided.
In order to improve the energy performance of a building it is necessary to define a set of proper energy management policies and related actions. Energy management is the proactive, organized and systematic coordination of energy procurement, energy conversion, energy distribution and use to meet the requirements, taking into account environmental and economic objectives.
For these reasons, the ISO 50001 standard was drawn up as a European standard. This standard specifies requirements to create, start, maintain and improve an energy management system. The standard defines the requirements applicable to the use and consumption of energy, including measurement, documentation and reporting, design and purchasing for equipment, processes and personnel that contribute to the definition of energy performance. The standard frames the responsibility of management to appoint and support a delegate for energy saving and defining an energy policy. It also identifies guidelines for the main elements of the energy plan, specifying how it should subsequently be implemented and finally verified.
With respect to energy analysis, the standard, among other things, requires the organization to:
- analyze the use and consumption of energy based on measurements or other data (evaluation of current and historical consumption);
- identify areas of significant use of energy based on an analysis of the measured data, identifying the infrastructure or the processes that significantly affect energy consumption;
- identify the other important variables that influence energy consumption;
- identify the reference consumption levels;
- Identify Energy Performance Indicators (EnPIs).
For each energy use, monitoring the consumption trend over time allows to study in detail the methods of use and to quantify the requirements. In other words, to form the basis of the information necessary to evaluate the proper use of energy, commensurate with the real needs coming from the type of application served. Energy consumption depends on user systems and external factors, such as the usage schedule, environmental conditions, machinery load, occupation of buildings etc. These factors can be very variable and their relationship with energy consumption can be complex, especially in cases where the system in question involves a relevant number and type of users and / or a relevant number and type of sites. Under these circumstances, proper evaluation and verification of activities can’t make do without a specific measuring system, as well as a detailed analysis in order to develop a satisfactory relationship between energy consumption and the variables that affect them [3].
Load management is known as one of the tools to improve efficiency and reduce energy consumption of an electrical system; such is, for instance, the practice of modulating with different methodologies electricity demand on the part of end users. The term used internationally to identify such practice is Demand Side Management (DSM). DSM can be briefly described as the deliberate variation of energy consumption, by means of of load shedding or load modulation, by the end user.
The San Martino University Hospital is one of the largest and most important hospital complexes in Europe, with a total area of 340.000 m² and with over 4.500 employees. The San Martino Hospital is a center of excellence for highly specialized cardiology, cardiac surgery, 2nd level emergency, hematology, neurosurgery, neurology and transplants.
The hospital is also affiliated with the University of Genoa and helps with Academic departments to train students of the Faculty of Medicine and the health care professionals. Through this collaboration, students can carry out the entire degree course, taking advantage of the facilities provided by the hospital.
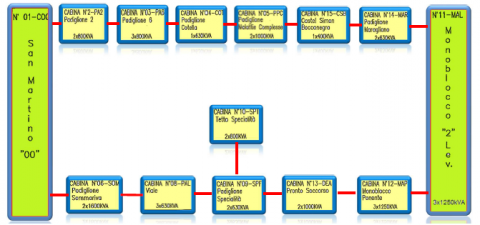
Figure 1. San Martino’s MV distribution ring
The hospital's electric energy distribution is obtained through a 15 kV Medium Voltage (MV) network, which extends for 3,7 km. The internal MV grid is connected to the national distribution network through two Points of Delivery (PoD) and provides energy to a total installed load of 4.000 kW. The internal distribution presents a ring configuration, but it is normally operated radially; in fact, there are two sectionalizers that determine the ring opening at two different points, effectively creating two radial networks. It is composed of 14 cabins with an in-out configuration, including 13 MV/LV transformers (a substation is exclusively dedicated to the connection to the national grid).
In the following Figure 1 the ring structure, the connections in medium voltage and the two delivery points are highlighted.
The different cabins are generally composed of the arrival and departure cabinets, the lift bars and the transformers. Cabins are located and identified as follows:
A tri-generation system has been implemented and put into service in 2012, with two combustion engines running on natural gas, for the combined production of thermal energy (both heat and cold) and electricity, in order to meet the needs of the installed utilities.
The system, also known as CHP (Combined Heat and Power), consists of a prime mover, an alternator, a heat recovery system consisting of heat exchangers, a refrigeration unit and electrical interconnections. The engine is used to convert methane gas withdrawn from the network into mechanical energy, the alternator, mounted on the motor shaft, converts mechanical energy into electrical energy, while the heat recovery system through the heat exchangers collects and converts the thermal energy contained in the exhaust fumes, in the coolant and in the oil of lubrication of the engine and converts it into thermal energy to be used for the heating and cooling of environments, for production of sanitary hot water, and production of chilled water for summer air conditioning, consequently making efficient use of the primary energy resource.
The San Martino plant consists of 2 co-generation groups fueled by natural gas. The heat exchangers recover the heat from the engine cooling circuit and by the exhaust fumes and essentially consist of:
- a plate heat exchanger for heat recovery from the engine cooling circuits and the lubricating oil;
- a plate heat exchanger for heat recovery from the engine cooling jackets;
- a smoke tubes exchanger for the recovery of heat from the engine exhaust gases.
The main characteristics of the San Martino tri-generation Plant are as follows:
- electric power of 3,200 to kWe alternator terminals;
- thermal power of 3,600 kWt (of which 955 kW intended for cold generation).
The system performance data is briefly reported in the following Table 1:
Table 1. Tri-Generation system features
|
Feature |
Unit Of Measurement |
Total Value |
|
Input power |
kW |
7.532 |
|
Gas flow rate |
m3/h |
786 |
|
Electrical power |
kW |
3.200 |
|
Exhaust gas temperature |
°C |
440 |
|
Exhaust gas thermal recovery (120°C water) |
kW |
450 |
|
Exhaust gas thermal recovery (440°C steam) |
kW |
1.200 |
|
Electrical efficiency |
% |
38 |
|
Thermal efficiency |
% |
41 |
|
Absorber efficiency |
% |
6 |
|
Total efficiency |
% |
85 |
Real time electric energy monitoring has been implemented in the San Martino hospital by means of a software platform called ESOS (Energy Smart Optimization System) accessible via a web-service, so that the data can be displayed at any time on any type of device, desktop or mobile. ESOS is a multi client, multi user and multi site software platform to monitor real time energy consumption and perform analyses on the recorded data. Field data is collected and transmitted to the central server, where it is stored into a database and made available to the processing logic. All the platform features are accessible to users, according to their own privileges, through a web browser application. The interface layout is designed to provide easy shortcuts to frequently used charts, tables and analyses for each individual element monitored, selectable by the operator from a hierarchical tree diagram.
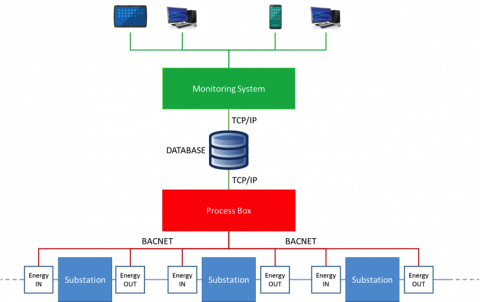
Implementation of the San Martino monitoring platform has been completed without installing any energy meter in the field. Instead, a Remote Terminal Unit (RTU) queries via BACnet protocol the installed instrumentation on the inbound and outbound protections of the electrical substations belonging to the MV ring. The recorded energy data is then sent every 15 minutes via FTP on a server and the energy consumption at every MV cabin is calculated by the system logic. The architecture of the energy monitoring system is shown in Figure 2.
BACnet was designed to allow communication of building automation and control systems for applications such as heating, ventilation, and air-conditioning control (HVAC), lighting control, access control, and fire detection systems and their associated equipment. The BACnet protocol provides mechanisms for computerized building automation devices to exchange information, regardless of the particular building service they perform [4].
The BACnet protocol defines a number of services that are used to communicate between building devices. The protocol services include Who-Is, I-Am, Who-Has, I-Have, which are used for Device and Object discovery. Services such as Read-Property and Write-Property are used for data sharing. As of ANSI/ASHRAE 135-2016, the BACnet protocol defines 59 object types that are acted upon by the services.
The BACnet approach includes possibilities to measure and control the energy consumption of single nodes and to include “a standard object type to allow a standard means for providing external control over load shedding” as summarized in the rational of ANSI/ASHRAE Standard. The BACnet protocol defines a number of data link / physical layers, including ARCNET, Ethernet, BACnet/IP, BACnet/IPv6, Point-To-Point over RS-232, Master-Slave/Token-Passing over RS-485, ZigBee, and LonTalk.
In practice, for the San Martino application the BACnet protocol has proven a very powerful tool to implement real time monitoring by interfacing different platforms (the monitoring platform and the MV ring protection platform) performing different tasks, coming from different suppliers and implemented at different times: a detailed study of the network configuration and the BACnet object name table has made it possible to exchange data between the two platforms and to define a calculation model of the electrical power and energy in real time. The following Figures 3 to 5 visualize different output data from the ESOS platform, in particular:
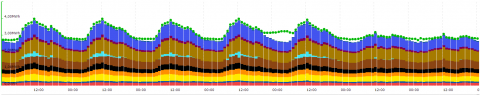
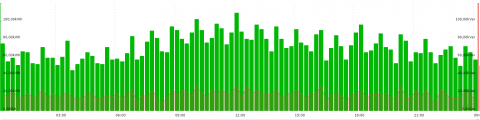
Figure 3 shows the stacked histogram of all pavilions’ hourly energy consumption;
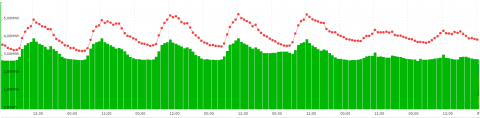
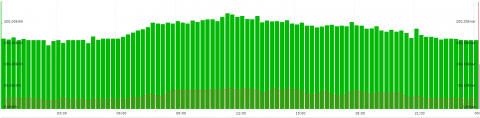
Figure 4 shows a comparison between hourly energy consumption in winter (green bar) and summer (red line;
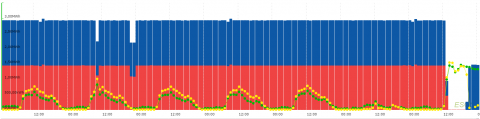
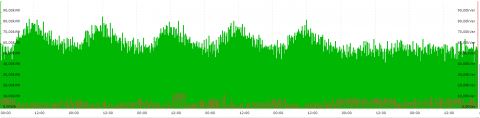
- Figure 5 shows the typical hourly energy production of the tri-generator over 1 week.
Figure 2. Architecture of the energy monitoring system
Figure 3. Typical hourly energy consumption over 1 week (CW 11): all pavilions
Figure 4. Season comparison of hourly consumption over 1 week: Winter (green bar) and summer (red line)
Figure 5. Typical hourly energy production of tri-generator over 1 week (CW 11)
The energy monitoring system allows real time visualization of the energy behavior of the entire San Martino Hospital. Figure 3 shows the hourly trend of energy consumption in a typical week (referred to calendar week 11). The histogram represents the aggregate of the individual pavilions consumption, while the green line is obtained by summing the energy production of the tri-generator with the absorption of electric energy from the national grid via the MV PoD’s.
As previously reported in literature [5] [6] [7], it is possible to see how energy consumption modulates very little between night and day, which is typical for an health care facility offering different and highly specialized services such as the San Martino hospital, including an extensive emergency room working 24/7 every day of the year
It is also possible to detect that the most energy consuming facilities are:
- Complex diseases
- Eastern Monoblock
- DEA (Emergency and Acceptance Department)
It is also evident that energy consumption over the weekend is lower than on weekdays, particularly in buildings where office or outpatient activities are present.
In Figure 4 a comparison between hourly consumption in a typical winter week (green bar) and in a summer week (red line) is shown. It is possible to notice the influence of air conditioning and refrigeration during summer, accounting for about 25% of the entire hospital consumption [8-9]. Figure 5 shows the hourly electric energy production of the tri-generator in a typical week, where:
- blue bars represent the energy production of one gas engine;
- red bars represent the energy production of the other gas engine;
- the green line represent the energy absorbed from the national distribution grid via the western MV/LV substation (Terralba)
- the yellow line represent the energy absorbed from the national distribution grid via the eastern MV/LV substation (Borgoratti).
What comes evident is how energy absorption from the distribution grid is close to zero at night time and how in some periods the electric energy production of the tri-generator exceeds the internal energy request.
The tri-generator operates continuously, except during maintenance periods, when electric energy comes fully from the national grid.
The intended uses of the different buildings influence energy consumption. For example, in
Figure 6 it is shown the energy consumption every 15 minutes in a typical working day for the MV/LV substation relative to the eastern monoblock. This is a large building built in 1979 mainly destined to hospital stays. It has 14 floors and 900 beds, it extends for over 3000 m2, is 50 m high and 180 m wide. Energy consumption is quite steady, where night absorption is comparable to the one recorded during the day.
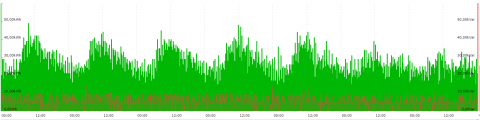
On the contrary, Figure 7 shows how energy consumption of the specialty pavilion, where in addition to the hospital stays are present ambulatory, day surgery, radiology and neurology activities, is characterized by an irregular pattern, with different peaks. The presence of such peaks even during night hours, where energy demand should be confined to the basic requirements of hospitalized stays, might indicate inefficient use of energy, which should be appropriately investigated. In Figure 6 and in Figure 7 the green bar represents active energy every 15 minutes and the red area represents reactive energy every 15 minutes.
Figure 6. Typical day energy consumption, eastern monoblock (15 minutes samples) (data referred to 23 March, 2017)
Figure 7. Typical day energy consumption, speciality pavilion (15 minutes samples) (data referred to 23 March, 2017)
Figure 8. Typical quarter hourly energy consumption over 1 week (CW 11): Maragliano pavilion
Figure 9. Typical quarter hourly energy consumption over 1 week (CW 11): Sommariva pavilion
A similar behaviour has been detected in other pavilions, for example in the Maragliano pavilion, headquarter of the Rehabilitation and Functional Reeducation Operative Unit, a structure born to host the integration of the former neurologic clinic activities with the pre-existent rehabilitation activities of the pavilion.
This unit (30 beds) is characterized by a high level of specialization in health-care procedures, in diagnostics and therapeutics in the field of neurological diseases by central damage (cerebral stroke, medullary injuries, Parkinson's disease and other disorders) and peripheral damage (neuropathy, radiculopathy, etc.). Moreover, the Maragliano unit hosts complex rehabilitation activities for patients in need of rehabilitation and functional re-education.
In Figure 8 the energy consumption every 15 minutes in a typical week for the Maragliano pavilion is reported. It is possible to detect the presence of peaks during both day and night, reaching at times almost twice the baseload consumption value. Also, a recurrent energy consumption peak taking place during mornings is highlighted by the analysis. [10]
Similar issues are present in the consumption profile of the Sommariva pavilion, as shown in the following Figure 9. The Sommariva pavilion hosts the Department of Nuclear Medicine, where scintigraphy examinations, positron emission tomography and PET activities are performed. The massive use of energy-intensive electromedical devices justifies the high consumption of this facility, especially during the working days of the week. The peaks presented by the load profile can also be explained due to the electromedical machinery usage. However, a similar scenario of high energy demand and peaks during nights and weekends is less likely, when associated to the services offered by the facility and the work schedule, providing a subject for further investigation and drill down analysis.
The implementation of the real time monitoring platform provides the San Martino hospital with a very powerful tool to keep electric energy consumption, electric energy production and power flows along the distribution network under control. The first months of data acquisition highlighted several consumption scenarios that need to be analyzed in detail to as they can possibly disclose energy saving opportunities. The activities described in this paper represent only the enabling steps for energy auditing and energy management activities, possibly extending real time monitoring to thermal energy and to a finer detail of electric energy as future developments, since the platform is already setup to acquire different types and number of measures.
This paper presented the implementation of an energy monitoring platform on the San Martino University Hospital in Genova. A brief example of how the monitoring data is used for energy diagnosis was also provided.
A description of the hospital, with specific references to the electric energy distribution ring and the tri-generator was given, as well as a description of the architecture and software-only implementation of the real time energy monitoring system.
The first months of data acquisition led to a first analysis of the hospital electric demand, with respect to the estimated energy consumption for air conditioning and refrigeration in summer, to the electric energy production and the general operation of the tri-generator plant. Some of the most energy-consuming pavilions of the hospital were also examined, revealing that while some pavilions are in line with what is expected and described in literature for health-care facilities, others show some unexpected behavior and possible opportunities to improve energy efficiency.
The future steps will be to examine in detail such anomalies with specific measurement campaigns encompassing the most critical facilities, possibly extending real time monitoring by installing energy meters on specific loads needing continuous attention.
Also, extension of the energy monitoring platform to thermal loads and thermal energy production of the tri-generator is currently under examination, which would provide the hospital with a tool to calculate energy balance in real time.
[1] Jovanović B., Filipović J. (2015). ISO 50001 standard-based energy management maturity model-proposal and validation in industry, Journal of Cleaner Production, Vol. 112, pp. 2744-2755.
[2] Singer B.C., Tschudi W.F. (2009). High performance healthcare buildings: A roadmap to improved energy efficiency, Berkeley, CA: Lawrence Berkeley National Laboratory.
[3] Ahmad M.W., Mourshed M., Mundow D., Sisinni M., Rezgui Y. (2016). Building energy metering and environmental monitoring-a state-of-the-art review and directions for future research, Energy and Buildings, Vol. 120, pp. 85-102.
[4] Hong S.H., Kim S.H., Kim G.M., Kim H.L. (2014). Experimental evaluation of BZ-GW (BACnet-ZigBee smart grid gateway) for demand response in buildings, Energy, Vol. 65, No. 2, pp. 62-70.
[5] Chung M., Park H. (2015). Comparison of building energy demand for hotels, hospitals, and offices in Korea, Energy, Vol. 92, pp. 383-393.
[6] Pantong K., Chirarattananon S., Chaiwiwatworakul P. (2011). Development of energy conservation programs for commercial buildings based on assessed energy saving potentials, Energy Procedia, Vol. 9, pp. 70-83.
[7] Bagnasco A., Fresi F., Saviozzi M., Silvestro F., Vinci A. (2015). Electrical consumption forecasting in hospital facilities: An application case, Energy and Buildings, Vol. 103, pp. 261-270.
[8] Huang J.H., Gurney K.R. (2016). The variation of climate change impact on building energy consumption to building type and spatiotemporal scale, Energy, Vol. 111, pp. 137-153.
[9] Christiansen N., Kaltschmitt M., Dzukowski F. (2016). Electrical energy consumption and utilization time analysis of hospital departments and large scale medical equipment, Energy and Buildings, Vol. 131, pp. 172-183.
[10] Delmasreo C., Mutani G., Perassi S. (2016). In use monitoring of public buildings. Case study in North Italy, International Journal of Heat and Technology, Vol. 34, No. 2, pp. S266-S276. DOI: 10.18280/ijht.34Sp0212