OPEN ACCESS
Oranges represent one of the most relevant fruits in the global market and nearly 70% of them is used in industrial processes to produce juices, jams and other products, returning huge quantities of residues known as Orange Peel Waste (OPW). Currently, many possible uses have been proposed for its management, one of the most promising options is methane production through the anaerobic digestion process; however, each valorisation proposal must consider that oranges production, and so the OPW one, is strictly influenced by the fruit seasonal spread. For this reason, this paper analyses at lab scale the effects of a form of storage, the ensiling, generally used for fodders, on the bio-methane production from anaerobic digestion processes. Different samples of OPW have been ensiled for increasingly long periods, then bio-methane production (BMP) tests were carried out and the results have been compared with those of fresh OPW. The results have been evaluated also in terms of global balance of the whole process (ensiling and anaerobic digestion). The results have shown that OPW ensiled for longer periods has the most promising methane production. However, the same sample has also shown the highest volatile solids reduction during ensiling and thus the highest potential reduction of bio-methane production
anaerobic digestion process, biogas, ensiling, methane, orange peel waste
Oranges represent one of the most relevant fruits in the global market and, according to official data, they are the most cultivated fruit in the world. In 2013, more than 71 Mt were produced, a number which represents the 8.5% of the global fruit production. Brazil has the leading role as the major producer, in fact it detains a quarter of the global production, followed by United States, India, China, Mexico, Spain, Egypt and Italy. The last one has a production of oranges of about 1.8 Mt per year [1].
About 70% of the oranges produced are used in many industrial processes for the production of juices, jams and other products, returning huge quantities of residues that, for juice production, represent about 50-60% of the processed fruit [2]. These residues are known as Orange Peel Waste (OPW), which is composed by seeds (0-9%), peels (60-75%) and membrane residues (23-33%). In particular, peels and membrane residues contain water (75-85%), mono and disaccharides (especially glucose, fructose and sucrose, 6-8%), polysaccharides (pectin, cellulose and hemicellulose, 1.5-3%), organic acids (citric and malic, 0.5-1.5%). OPW is also characterized by a very low pH (3–5), a content of water of over 80%, and a significant presence of essential oil, mainly composed of D-limonene. Currently, many possible uses have been proposed for its management, fresh or after processing.
It is used fresh especially as cattle feed [3], while the processed OPW can be used to produce fertilizers, pectin, ethanol, essential oils, etc. [4]. However, its uses depend on many factors, as the high content of water, the fruit seasonal spread, the costs of transport and storage, which influence the economic sustainability of the management.
One of the most promising options is the use of OPW as a substrate for methane production through the anaerobic digestion process [5-16]. This is a biochemical process which consists in the decomposition of complex organic substances, contained in the biomass, into a gas, basically composed of methane and carbon dioxide, and used as a biofuel. The other product of the digestion is the digestate, which is rich of nutrients, so it can be used as a fertilizer. The anaerobic digestion has a positive role also in waste management: biodegradable organic materials are used in digestion processes instead of being landfilled producing uncontrolled methane emissions in the atmosphere.
However, as already mentioned, OPW could be used only during the production period, due to its seasonal spread. For this reason, it has become common to preserve it through the ensiling process to increase its availability during the year [17-18]. Ensiling is a process generally used for fodders, and it is based on the acidification of the vegetal biomass, which ensures the conservation of the product. The absence of oxygen in the ensiled mass leads to a lactic fermentation provoking a reduction of pH and so to the inhibition of some enzymes which are responsible of the degradative process. The conservation through acidification, in particular, is easily performed in OPW because of its initial acidity, its high content of carbohydrates and its consistence, which reduce air permeability [19].
Scope of this paper is to analyse at lab scale the influence of ensiling on the bio-methane production from anaerobic digestion processes. Different samples of OPW have been ensiled for increasingly long periods (0, 7, 14, 21 and 37 days); then batch bio-methane production (BMP) tests were carried out, in mesophilic condition, measuring the biochemical methane potential after 30 days (BMP30). The results for ensiled samples have been compared with those of fresh OPW.
The results have been evaluated also in terms of global balance of the whole process (ensiling and anaerobic digestion), measuring the CO2 and the biogas produced.
2.1 Substrates
Table 1. Characteristics of OPW and inoculum
|
Parameter |
Fresh OPW |
Inoculum |
|
Humidity (%) |
83.0 |
95.2 |
|
Total solids (TS) (%) |
17.0 |
4.8 |
|
Volatile solids (VS) (%) |
96.8 |
67.4 |
|
pH |
3.5 |
8.4 |
The OPW used during the experiments was an industrial one, coming from a Sicilian plant. It was characterized in terms of total solids (TS) and volatile solids (VS), according to conventional standard methods (Table 1). Then, in order to obtain uniform characteristics in the biomass during the experiment, it was frozen. To carry out bio-methanization tests, an inoculum, represented by a mixture of sludges taken from a digester fed on bio-wastes, was used. The sludge was firstly sieved, to remove large fibrous materials, and then kept in an oven at 35°C, in anaerobic conditions for about 7 days, until the beginning of the experiment, to reduce non-specific biogas generation.
2.2 Analytical measurement of biogas production from OPW
The first part of the experiment was carried out in order to determine ensiling effects on OPW. Approximately 350 g of OPW, with an initial pH of 3.63, were put inside a reactor and kept in anaerobic conditions, periodically withdrawing the biogas and a sample, to measure TS and VS. The gas withdrawal was carried out thanks to a graduated syringe, and repeated three times a week. Then, a global balance of the whole process was carried out, considering CO2 as the only biogas component during ensiling.
2.3 Biochemical methane potential (BMP) tests
OPW samples were used for BMP test, to determine methane production. Tests were carried out using five sets of 3 glass bottles of 1 L volume, hermetically closed, placed in a thermostatic cabinet at 35 ± 0.5°C, and mixed with a magnetic stir bar. In each reactor, it was put a quantity of 2 g of bicarbonate, to increase the buffering capacity, together with 200 ml of sludges and a variable quantity of substrate, such to keep almost constant, at 0.3, the ratio VSsubstrate/VSinoculum. Tests were all carried out for a period of 30 days. Table 2 summarizes the experimental program (experiments with blanks are not reported).
The biogas produced then passed through a NaOH solution (3 M), for CO2 adsorption. Methane flows through a liquid-displacement measuring unit. Other measurements were carried out on the inoculum (blank), composed as said before by a mixture of sludges, in duplicate, in order to obtain the net biogas and methane production.
The specific biochemical methane production was calculated as follows:
$B M P_{30}\left[\frac{N m l C H_{4}}{g V S}\right]$$=\frac{\left(V_{C H_{4}, s}-V_{C H_{4}, b l a n k}\right)\left[N m l C H_{4}\right]}{V S_{s}\left[g \frac{V S}{l}\right] * V_{s}[l]}$
where the difference represents the net methane, production measured at the end of the test; VSs is instead the concentration of volatile solids from OPW in the bottle at the beginning of the test, and Vs is the overall test volume.
Table 2. Experimental program
|
Fresh/Ensiled OPW |
Fresh OPW |
7 days |
14 days |
21 days |
37 days |
||||||||||||||
|
N. Batch |
2 |
3 |
4 |
5 |
6 |
7 |
8 |
9 |
10 |
11 |
12 |
13 |
14 |
15 |
16 |
||||
|
OPW mass (g) |
12 |
12 |
12 |
13.3 |
13.3 |
13.6 |
15.9 |
15.7 |
15.4 |
15 |
14.1 |
14.4 |
16.5 |
16.6 |
15.9 |
||||
|
OPW TS (g) |
2.04 |
2.04 |
2.04 |
2.24 |
2.24 |
2.29 |
2.24 |
2.22 |
2.17 |
2.28 |
2.15 |
2.19 2.11 |
2.20 |
2.21 |
2.12 |
||||
|
OPW VS (g) |
1.97 |
1.97 |
1.97 |
2.16 |
2.16 |
2.21 |
2.15 |
2.13 |
2.08 |
2.20 |
2.06 |
2.11 |
2.12 |
2.03 |
|||||
|
TSsub/TSinoc |
0.21 |
0.21 |
0.21 |
0.23 |
0.23 |
0.24 |
0.23 |
0.23 |
0.23 |
0.24 |
0.22 |
0.23 |
0.23 |
0.23 |
0.22 |
||||
|
VSsub/VSinoc |
0.31 |
0.31 |
0.31 |
0.34 |
0.34 |
0.34 |
0.33 |
0.33 |
0.32 |
0.34 |
0.32 |
0.33 |
0.33 |
0.33 |
0.32 |
||||
|
pHinitial |
7.76 |
7.78 |
7.78 |
7.80 |
7.75 |
7.71 |
7.72 |
7.70 |
7.70 |
7.69 |
7.57 |
7.62 |
7.61 |
7.56 |
7.58 |
||||
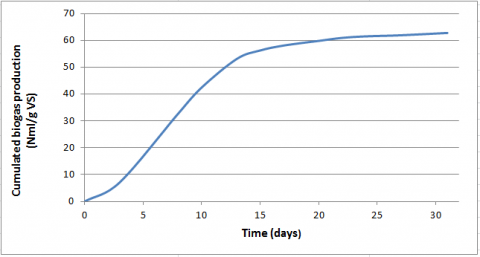
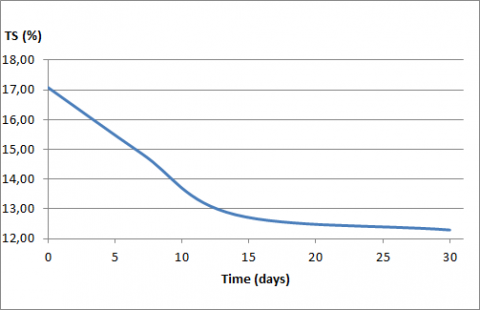
Figure 1 shows the specific cumulated biogas production from OPW during ensiling. A higher production occurred during the first 15 days, while at 30 days the biomass can be considered stable, reaching a cumulated value of approximately 60 Nml/g VS. In Table 3 there is a summary of the results of measurements, while in Figure 2 and 3 is shown the trend of total solids and volatile solids, during the ensiling period.
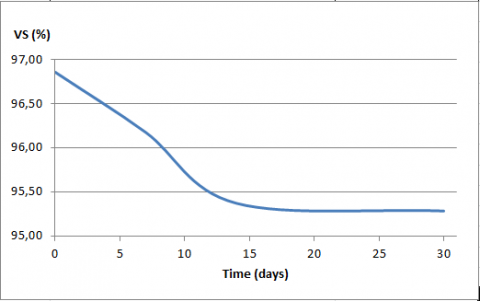
From Figures 2 and 3 it can be seen that both total solids and volatile solids decrease with an increasing ensiling time. In particular, total solids start from a maximum of 17% referring to fresh OPW, and reduce down to the value of 12.29% after 30 days.
Volatile solids suffer a reduction too, even though lower than TS. It is shown a global VS loss of 0.68% after 7 days, of 1.5% after 14 days and of 1.6% after 30 days.
Table 4 shows OPW characteristics as a function of the ensiling period.
Figure 1. Biogas production during ensiling
Table 3. TS and VS variations during ensiling
|
Ensiling period(days) |
Total solids (%) |
Volatile solids (%) |
|
0 |
17.08 |
96.86 |
|
7 |
14.86 |
96.18 |
|
14 |
12.80 |
95.37 |
|
30 |
12.29 |
95.29 |
Figure 2. Total solids trend during ensiling
Figure 3. Volatile solids trend during ensiling
Referring to pH, it is clear how it reduces its value of about 13%, with an increasing ensiling period. In fact, it starts from a value of 3.5 for fresh OPW, down to 3.06 for OPW ensiled for 37 days.
Then, measuring pH before and after the digestion process, it has been noticed that it keeps a high value, thanks to the presence of sodium bicarbonate in the mixture inoculum/substrates during the experiment, which has avoided the inhibition of the digestion process. In particular, for samples ensiled for 0, 7 and 14 days, a light reduction of the initial pH value occurs, while a small increase is present for samples ensiled for 21 and 37 days.
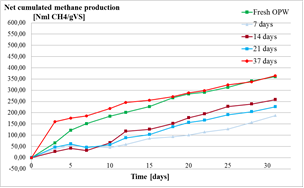
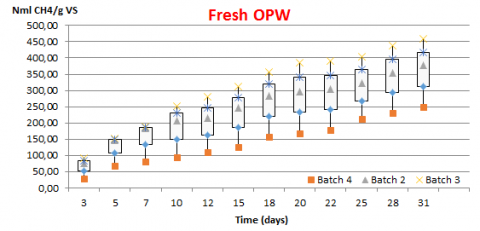
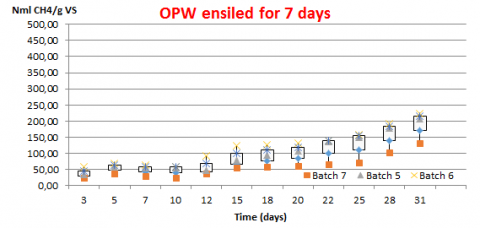
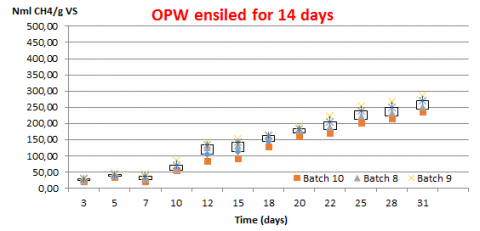
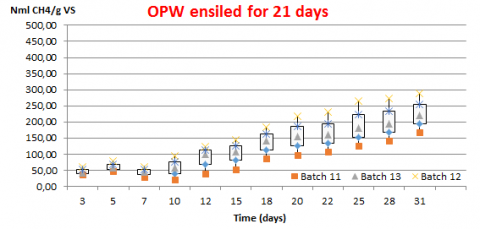
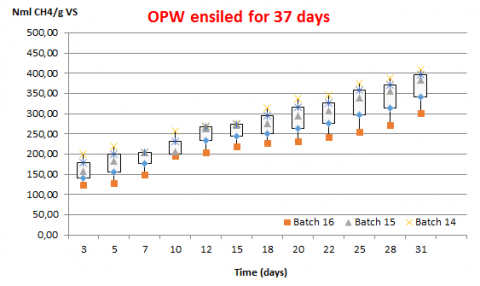
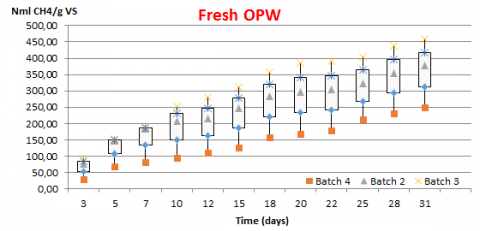
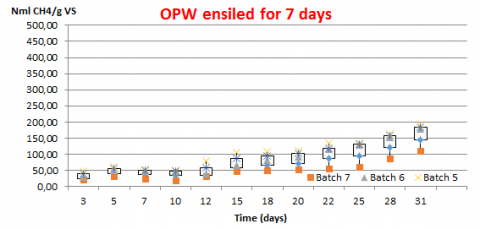
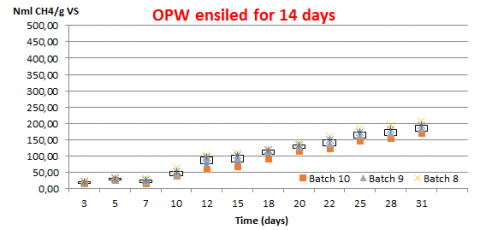
About BMP tests, Figure 4 shows the global trend of the net specific cumulated methane production with different ensiling periods.
Table 4. Ensiled OPW characteristics as a function of ensiling time
|
Material |
Humidity (%) |
Total solids (%) |
Volatile solids (%) |
pH |
|
Fresh OPW |
83.0 |
17.0 |
96.8 |
3.5 |
|
OPW ensiled 7 days |
83.2 |
16.8 |
96.5 |
3.24 |
|
OPW ensiled 14 days |
85.9 |
14.1 |
95.9 |
3.14 |
|
OPW ensiled 21 days |
84.8 |
15.2 |
96.2 |
3.10 |
|
OPW ensiled 37 days |
86.7 |
13.3 |
95.9 |
3.06 |
Figure 4. Net specific cumulated methane production for each batch
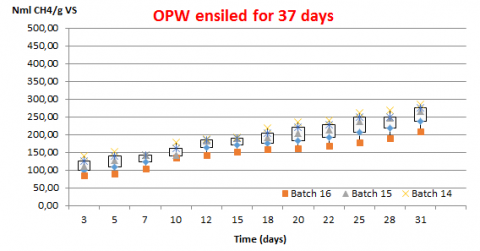
Comparing fresh OPW methane production, equal to 360 Nml CH4/g VS, with ensiled OPW, it can be seen that only OPW ensiled for 37 days produced a similar methane quantity, with a value of 365 Nml CH4/g VS. Instead, other samples show a lower methane production. However, the production of all the batches describes a growing curve, with higher gradients in the first days and lower at the end of the process. In particular, at the beginning of the process, low methane percentages have been registered (15-20%), especially for OPW ensiled for 7 days; subsequently, the percentage increases, reaching values of 60-70% in correspondence of the 20th day of digestion. During the last days of the experiment, cumulated methane production grows slowly, due probably to the reduction of the available substrate [20-21]. Figure 5 shows the same results of Figure 4, underlining the differences among bottles of different groups, with sometimes pronounced differences even within the same group. Initially, methane production deviations reached values of even 15-20%, as in the case of OPW ensiled for 14 and 21 days; then, these variations reduced, with a minimum in correspondence of fresh OPW (2% of deviation) and a maximum of 5.7% for OPW ensiled for 21 days.
But, during ensiling, a reduction in terms of volatile solids occurs. For this reason, net specific methane production was measured for each batch, referring to the initial volatile solids presents in the ensiled mass at day 0 (Figure 6). Global mass balances were considered, showing VS percentages reductions of 14.6% after 7 ensiling days, up to 30.6% after 37 days, leading to a significant reduction of the net speficic methane production during ensiling.
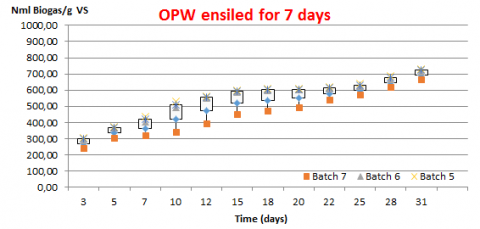
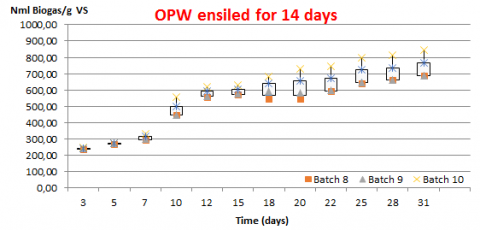
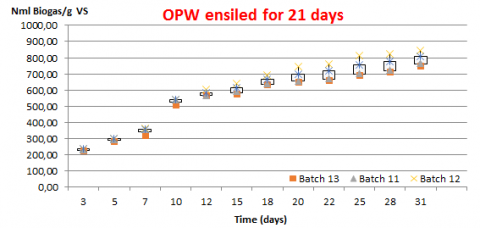
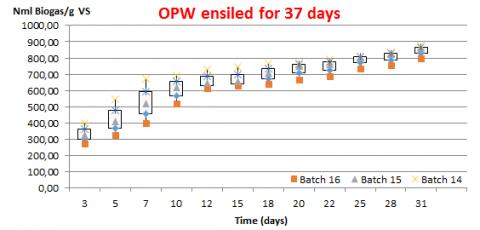
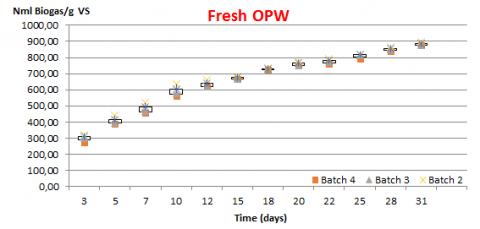
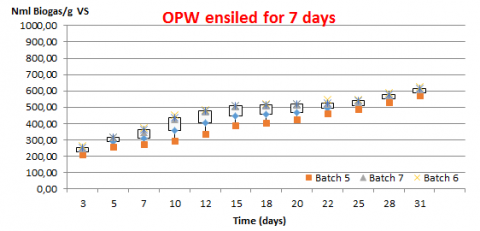
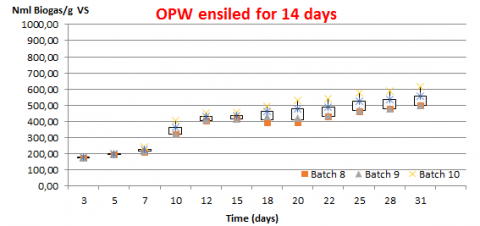
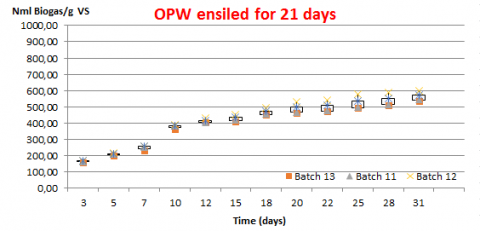
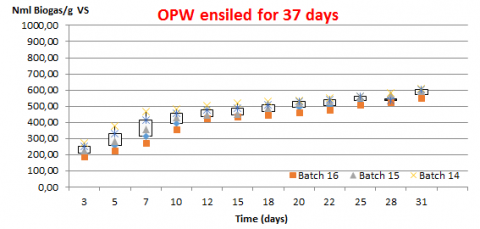
Together with methane production, biogas one was evaluated, both referring to volatile solids presents inside the reactor (Figure 7) and to the initial ones (Figure 8).
The biogas trend, conversely to methane one, is more regular for almost all the samples, with a peak generally during the first week, higher, sometimes, than 800 ml. Reactors containing fresh OPW are the ones which show the highest cumulated biogas production, with similar behaviour for samples of OPW ensiled for 37 days.
Figure 5: Net specific cumulated methane production for each batch
Figure 6. Net specific cumulated methane production for each batch, referring to initial volatile solids
Figure 7. Net specific cumulated biogas production for each batch
Figure 8. Net specific cumulated biogas production for each batch, referring to initial volatile solids
All the bottles belonging to the same group present similar productions, with small differences among them in terms of percentages (Figure 7), contrary to what is shown referring to their methane production.
In the end, from Figure 8 it is possible to appreciate that fresh OPW has a higher biogas production respect the ensiled samples. In particular, the worst case is referred to OPW ensiled for 37 days, with a decrease from 878.1 Nml Biogas/g VS for fresh OPW to 609.5 Nml Biogas/g VS.
According to the results shown, it can be affirmed that the combined use of ensiling and the digestion processes represents a possible solution for OPW management, in order to allow its use during the whole year. However, ensiling has a certain influence on the final bio-methane production. Though, in fact, the best results for ensiled OPW are referred to 37 ensiling days, in correspondence of that there is the highest reduction of potential methane production, equal to 30.6% and referred to initial volatile solids.
Conversely, the net specific productions referred to 7, 14 and 21 ensiling days do not give satisfactory results, either in terms of biogas and methane, with lower quantities compared to fresh OPW.
The use of this technique, combined with the presence of digestion processes plants for methane production, could bring on one hand to higher costs, linked with the storage of OPW in appropriate structures, which must be insulated to guarantee anaerobic conditions, without the presence of oxygen. At the same time, with such a conservation technique, it could be solved the disposal problem for a product which has been for long time considered just as a waste. Ensiled OPW, in fact, could be used in periods different from the production ones, and its conversion into methane is benefical.
So, the costs linked with ensiling would be balanced by the energetic surplus generated by the biomass, using bio-methane for energy production.
Further developments will be aimed at carrying out biomethanization tests on inocula with already acclimatised bacteria, to evaluate if the methane production increases.
[1] FAOSTAT (2014). Statistical Database of the Food and Agriculture Organization of the United Nations. http://faostat.fao.org
[2] Martin A., Lopez J.A.S. (2010). Biomethanization of orange peel waste, Bioresource Tecnology, Vol. 101, No. 23, pp. 8993-8999. DOI: 10.1016/j.biortech.2010.06.133
[3] Caparra P., Foti F., Scerra M. (2007). Solar-dried citrus pulp as an alternative energy source in lamb diets: Effects on growth and carcass and meat quality, Small Ruminant Research, Vol. 68, No. 3, pp. 303-311. DOI: 10.1016/j.smallrumres.2005.11.015
[4] Ylitervo P. (2008). Production of ethanol and biomass from orange peel waste by Mucor indicus, M.S. thesis, Boras University, Sweden.
[5] H Bouallagui., Touhami Y., Ben Cheikh R., Hamdi M. (2005). Bioreactor performance in anaerobic digestion of fruit and vegetable wastes, ChemInform. DOI: 10.1002/chin.200519288
[6] Elaiyaraju P., Partha N. (2011). Biogas production from co-digestion of orange peel waste and jatropha de-oiled cake in an anaerobic batch reactor, African Journal of Biotechnology, Vol. 11, No. 14, pp. 3339-3345. DOI: 10.5897/AJB11.2622
[7] Interlandi S. (2014). Biogas production from citrus fruits processed wastes, Alma Mater Studiorum, Bologna University.
[8] Kaparaju P.L.N., Rintala J.A. (2006). Thermophilic anaerobic digestion of industrial orange waste, Environmental Technology, Vol. 27, No. 6, pp. 623-633. DOI: 10.1080/09593332708618676
[9] Khalid A., Arshad M., Anjum M., Mahmood T., Dawson L. (2011). The anaerobic digestion of solid organic waste, Waste Management, Elsevier. DOI: 10.1016/j.wasman.2011.03.021
[10] Koppar A., Pullammanappallil P. (2013). Anaerobic digestion of peel waste and wastewater for onsite energy generation in a citrus processing facility, Energy, Vol. 60, pp. 62-68. DOI: 10.1016/j.energy.2013.08.007
[11] Nguyen H. (2012). Biogas production from solvent pretreated orange peel, M.S. thesis, Department of Chemical and Biological Engineering, Chalmers University of Technology, Goteborg, Sweden.
[12] Romero-Guiza M.S., Vila J., Mata-Alvarez J., Chimenos J.M., Astals S. (2015). The role of additives on anaerobic digestion: A review, Science Direct, Elsevier. DOI: 10.1016/j.rser.2015.12.094
[13] Ruiz B., Flotats X. (2014). Citrus essential oils and their influence on the anaerobic digestion process: an overview, Waste Management, Vol. 34, No. 11, pp. 2063-2079. DOI: 10.1016/j.wasman.2014.06.026
[14] Srilatha H.R., Krishna N., Bada K.S., Madhukara K. (1995). Fungal pretreatment of orange processing waste by solid state fermentation for improved production of methane, Process Biochem. DOI: 10.1016/0032-9592(95)87041-5
[15] Wikandari R., Nguyen H., Millati R., Niklasson C., Taherzadeh M.J. (2014). Improvement of biogas production from orange peel waste by leaching of limonene, Hindawi Publishing Corporation. BioMed Research International, Vol. 2015. DOI: 10.1155/2015/494182
[16] Carotenuto C., Guarino G., Minale M., Morrone P. (2016). Biogas production from anaerobic digestion of manure at different operative conditions, International Journal of Heat and Technology, Vol. 34, No. 4, pp. 623-629. DOI: 10.18280/ijht.340411
[17] Itavo L.C.V., Dos Santos G.T., Jobim C.C., Voltolini T.V., Bortolassi J.R., Brandao Ferreira C.C. (2000). Conservation of fresh orange peel by ensilage process using additives, Revista Brasileira de Zootecnia, Vol. 29, No. 5. DOI: 10.1590/S1516-35982000000500028
[18] Ashbell G., Weinberg Z.G. (1988). Orange peels: The effect of blanching and calcium hydroxide addition on ensiling losses, Biological Wastes, Vol. 23, No. 1, pp. 73-77. DOI: 10.1016/0269-7483(88)92246-8
[19] Tamburino V., Zema D.A. (2009). By-products of the transformation industry: The orange peel waste, ResearchGate, pp. 459-470.
[20] CalabròP.S., Pontoni L., Porqueddu I., Greco R., Pirozzi F., Malpei F. (2015). Effect of the concentration of essential oil on orange peel waste biomethanization: Preliminary batch results, Waste Management, Elsevier, Vol. 48, pp. 440-447. DOI: 10.1016/j.wasman.2015.10.032
[21] Bourgou S., Rahali F.Z., Ourghemmi I., Tounsi M.S. (2011). Changes of peel essential oil composition of four Tunisian citrus during fruit maturation, The Scientific World Journal, Vol. 2012. DOI: 10.1100/2012/528593