OPEN ACCESS
Analysis of the IR spectra of weathered films exposed at different periods of the year reveals that, the main regions of the IR spectrum affected by solar irradiation and temperature variation are the complex carbonyls and unsaturations composite absorption bands. Their respective kinetics vary in different manner according to the period at which the exposure is started. Curve fitting has been performed to refine the analysis of the IR spectra and to identify all the chemical species constituting the complex absorption bands. The analysis of the results let appears that whatever the exposure period of the year is, it does not affect the type of developing products, but it has strong effect on their kinetic rate of formation. The warm season is the more effective in terms of carbonyl formation and crystallinity index. This indicates that the Norrish type I (NI) process is very important in this season and it adds to the Norrish type II (NII) process. Both contribute to the carbonyl and vinyl groups formation via chain scission reactions; however the NII process is active during all the period of the year.
low density polyethylene, photooxidation, ftir, sun radiation, dsc, crystallinity index
The most widely used material for greenhouse covering is Low-density polyethylene (LDPE), because of its good physicochemical, mechanical, optical properties, its cheapness and ease of processing. This makes it the leader material in the agricultural field [1].
It is very sensitive towards most of the climatic parameters such as, solar radiations (ultraviolet rays), temperature, atmospheric oxygen, humidity, rain, sand wind, pollutants; and so on. These environmental factors affect adversely the mechanical, chemical and optical properties [2 -4].
As a matter of fact, solar irradiation in the UV range [290 -400 nm] is certainly the most aggressive parameter interacting with the mechanical and physical properties lowering. [1], [5-7].
Temperature closely related to the solar energy are other significant climatic factors acting on the degradation process, since they are found to contribute to drastically increase the formation rate of the photo-oxidation products [8-11].
The environmental pollution and/or the use of agrochemicals products inside the greenhouses can also reduce the service lifetime of the films, because of the possible interaction with the weakest sites of the macromolecular chains [5], [3], [12].
Wind forces can also be the occurrence of periodical mechanical stresses, leading to the weakening of the material structure by fatigue [13].
The combination of all these environmental factors contributes to rapidly degrade the films which become excessively brittle in a relatively short period of time.
Therefore, at an advanced ageing stage, pieces of the material can easily be torn off from the greenhouse by wind, to be then thrown in nature, acting adversely on the environment.
Ageing is mainly due to polymer chain degradation, characterized by the oxidation of the macromolecules accompanied by morphological changes [13-15]. As such, FTIR spectroscopy can be regarded as a powerful technique to identify the different oxidation products developing during ageing and allowing also to quantify their concentration changes upon time. Due to the complexity of the oxidation mechanism, an exhaustive analysis of the evolution of all the spectrum regions could highlight the respective contribution of most of the different chemical species [16-17].
It remains still difficult to distinctly identify the different chemical species constituting most of the complex absorption bands, because of the close vicinity of their respective signals which often overlap. This makes necessary to refine the spectra analysis by means of mathematical data processing [18-19].
Another aspect of ageing seldom discussed by others is the effect of the exposure period on the formation and growing of the carbonyl species and unsaturations.
In France, Verdu [8] has studied the effect of three different exposure periods on the film degradation.
It is why, in this work it has been tried to assess the effects of the exposure period (solar energy and temperature) by means of seven different ageing protocols in a Sub Saharan region which displays a more aggressive environment.
The crystallinity index has been used as a comparative indicator to highlight the effect of the period on the degradation process.
2.1 Material
The raw material used in this study is a sample of low density polyethylene (LDPE pellets, 2100 T N00W) supplied by the Saudi Basic Industries corporation (Sabic).The films are produced by the Sofi-Plast Company at Sétif , (Algeria). This polymer is a neat grade free of stabilizing agents. The LDPE was melt extruded at about 1750C and blown in a continuous process characterized by a bubble diameter of 4.4 m and a drawing speed of 15 cm/s. The thickness of the film was 180 μm.
2.2 Weathering protocols and sampling
Films were mounted on metallic frames facing south according to the ISO 4607 standard. Exposure to solar radiation has been performed at Laghouat (33°48’ N, 20°56’E), Algeria. Seven ageing protocols have been started at different periods of the year (Table 1). The average duration of a protocol is seven months. For each protocol monthly sampling is done.
Table 1. The aging protocols
|
Protocol Number |
Beginning of the protocol |
End of the protocol |
|
1 |
Jan |
Jul |
|
2 |
Feb |
Aug |
|
3 |
Mar |
Sept |
|
4 |
Apr |
oct |
|
5 |
May |
Nov |
|
6 |
Jun |
Dec |
|
7 |
Jul |
Jan |
2.3 Climatic data
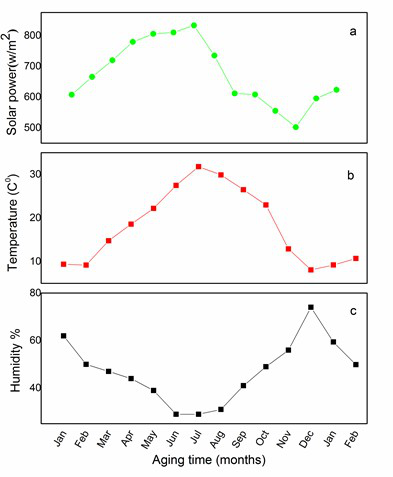
The climatic data have been provided by the national meteorological station of Laghouat. The climatic parameters got from the station are, the solar power (± 0 , 40 w/m2), temperature (± 0 , 150C), Humidity (± 0 , 2 %).
It can be still observed that the temperature and solar power are maximum in July. While insulation is maximum in June since the duration of the day is the longer. Moisture is minimum during this period corresponding to the peak summer season. This suggests that the interaction of the environment with the exposed material could be higher (Fig 1).
Figure 1. Climatic data for the whole duration of the protocols, a) Solar power (w/m2), b) Temperatures (°C); c) Humidity
2.4 Fourier transforms infrared spectroscopy (FTIR)
An FTIR spectrometer, (Spectrum Two) Perkin Elmer, was used for the infrared analysis. The infrared spectra were collected in transmission mode over the range from 4000-400 cm-1 at a 4 cm-1 optical resolution and using 32 scan repetitions. In this study, the representation of the spectra using the absorbance mode is more suitable to calculate the optical density of all the chemical species developing during ageing, and to highlight their kinetic evolution [17], [20].
2.4.1 Mathematical curve - fitting
In order to identify the species constituting the complex absorption bands in the different regions of the FTIR spectrum, a mathematical curve fitting was performed to identify the entire initial existing products and those evolving during exposure. The curve fitting was performed using the second derivative method in the Origin Pro software package (version 8.6).The second order derivatives FTIR spectra were obtained using the Savitzkye Golay algorithm (9-point smoothing), and the fourth derivative has been used to strengthen the analysis.
The curve fitting method has been described in details in a previous work [19].
For polymers, the simplest way to follow the evolution ofthe chemical species during ageing is to measure their absorbance at different exposure times.
2.5 Differential scanning calorimeter (DSC)
The calorimetric curves were obtained by using a DSC (Perkin Elmer DSC 7). The degree of crystallinity of the samples was calculated from the peaks of these curves. For the analysis the weight of samples was kept around (10 mg), and a heating rate was set to 100C/min. The heat of fusion,$\Delta \mathrm{H}_{\mathrm{f}}$was determined after relevant elimination of the base line. The degree of crystallinity was calculated with respect to the heat of fusion of 100% crystallized polyethylene ( $\mathrm{H}^{0} \quad \mathrm{f}=285$ J/g) [21-22]. Through the relationship:
$\mathrm{X}_{\mathrm{C}}^{\mathrm{o}} / \mathrm{o}=\frac{\Delta \mathrm{H}_{\mathrm{f}}}{\Delta \mathrm{H}_{\mathrm{f}}^{0}} \times 100$
The reproducibility of the crystallinity index for all the protocols was $\pm 1.15-2.50 \%$
3.1 Ageing characterization by FTIR
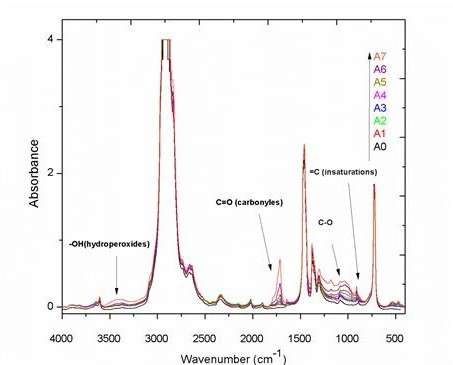
Fig.2 reports the FTIR spectra of unexposed and exposed films from January to July (protocol 1). For clarity the samples have been named A0 (unexposed film), and A1 to A7 for the exposed films where the number from1 to 7 refer to the duration of exposure (months).
The aging process of the exposed film is governed by a complex mechanism of chemical reactions. This is reflected by the growth and disappearance of absorption bands. The most affected spectral regions are those of the hydroperoxides (3700-3300 cm-1), carbonyl groups (1800-1680 cm-1), (C-O) groups (1220-1000 cm-1), and unsaturations (985-880 cm-1). Curve fitting was performed to carbonyl and unsaturation regions for the most aged sample (A7) since this two spectrum regions are the most sensitive to the microstructural changes.
Figure 2. Full FTIR spectra of LDPE films for different aging time (A0-A7).
3.1.1 Carbonyls region (1800 – 1680 cm-1)
The most indicative absorption band of ageing is that of carbonyls. While absent in the unexposed sample, it significantly increases with ageing and shows a massive absorption band pointing at 1713 cm-1 (Fig. 2). It is bordered by many shoulders on its left side, thus revealing the presence of many species.
In fact, curve fitting with further analysis (fourth derivative) has allowed detecting the presence of 15 different products. The peak positions and their corresponding chemical structures are reported in (Table 2).
3.1.2 Unsaturation groups Region (985 – 880cm-1)
These types of chemical species are visible in the spectral regions [985-880cm-1]. In this case the curve fitting did not reveal the presence of further absorption bands. The peak positions and their corresponding chemical structures are reported in (Table 3).
Table 2. Peak position and assignment of carbonyl species after curve fitting [17-19].
|
Component no |
Peak position (cm-1) |
Assignment |
|
1 |
1686 |
Keton, acide α, β unsaturated |
|
2 |
1697 |
γketoacide, ketogroups |
|
3 |
1702 |
Conjugated ketones |
|
4 |
1709 |
γ ketoacide, ketogroups |
|
5 |
1713 |
Carboxylic acid (associated) |
|
6 |
1722 |
Ketones |
|
7 |
1734 |
Aldehydes |
|
8 |
1739 |
Esters |
|
9 |
1750 |
Peracides |
|
10 |
1756 |
Carboxylic acid (free) |
|
11
|
1761 |
not identified |
|
12 |
1767 |
Carboxylic acid (isolated) |
|
13 |
1777 |
Peresters |
|
14 |
1785 |
γ –Lactones |
|
15 |
1790 |
not identified
|
Table 3. Peak position and assignment of the unsaturations [18], [23-26].
|
Component no |
Peak position (cm-1) |
Assignment |
|
1 |
888 |
Vinylidene |
|
2 |
909 |
vinyl |
|
3 |
965 |
t-vinylene |
3.2 Effect of the exposition period on the kinetics of formation or consumption of the chemical species
3.2.1 Kinetics of the carbonyl species formation
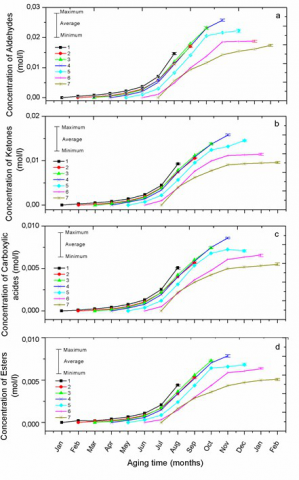
Natural weathering is the occurrence of the formation of a variety of photooxidation products (Table 2). However, the most important ones in terms of concentration are the aldehydes, the ketones, the carboxylic acids and the esters. The representation of their kinetic formation, according to the different protocols gives a good insight on the period effect (Fig.3). It can be observed that the period affects the variation of carbonyl species concentration as a function of exposure time. Moreover, the induction time was found to be maximum for the protocol started in the cold season (i.e. protocol 1and 2), and to progressively decrease until to practically disappear in the case of protocol 7 (started in July). The protocol 4 (started in April) displays a particular behavior. Because, after a very short induction time, their formation become auto-accelerated to be slightly saturated at the end with the higher concentration comparatively to the others (rapid degradation). This clearly means that the protocols started in Springer are more harmful in term of oxidation than the others.
For each experimental run, the curves of chemical species concentration were plotted with the maximum and the minimum values achieved at the end of aging process (Fig.3-4). The reproducibility of all the other experimental points is in the same range.
Figure 3. Variation of the concentration of carbonyl groups for different protocols, a) Aldehydes; b) Ketones; c) Carboxylic acids; d) Esters.
3.2.2 Kinetics of formation or consumption of unsaturated groups
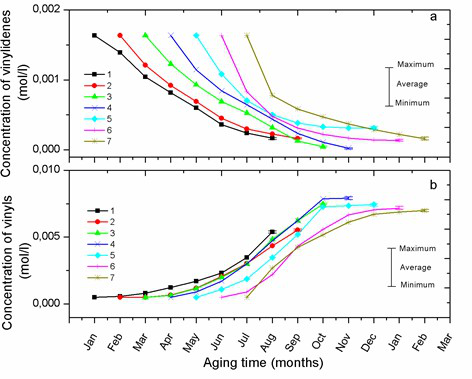
Figure 4.The absorbance variation for the different protocols of the unsaturations a)Vinylidenes (888 cm-1), b) vinyl (909 cm-1).
The variation of the unsaturation concentration of the vinylidenes and the vinyls is reported in Fig.4.
Vinylidene groups are present with a noticeable concentration at the beginning of exposure, then they are progressively consumed until their total disappearance. However, the rate of consumption is somewhat different from one protocol to another.
The drop of the curve at the beginning of exposure becomes progressively more abrupt as the protocols shift from winter toward summer. Since, they are found to be totally consumed in the protocol 4 (Fig.4a).
Vinyl groups, showing a small initial concentration grow rapidly with ageing time. Their kinetics deeply differ from one protocol to another (Fig.4b). Their s-shaped curves show an induction time decreasing from the protocol started in winter to that of summer (i.e. protocol 1 and 7) as observed for the curves of the carbonyls species.
3.3 Thermal analysis and crystallinity determination
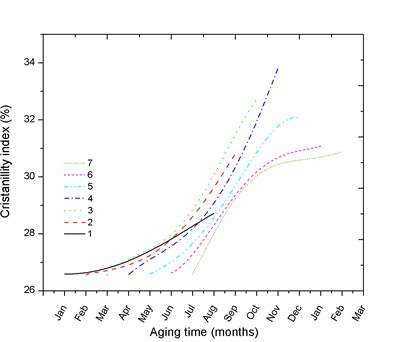
The variation of the crystallinity index determined by DSC for all the ageing protocols is represented in Fig.5. The exposure period affects markedly its progression since it can be observed that it is very low when started in the cold season and becomes faster when the protocols shift toward the hot season. For the protocols starting in January and February the curves look like linear. When, the exposure starts in summer the curves become progressively more and more saturated with lower concentrations at the end of the protocols compared to the previous ones. In protocol 4 the curve looks somewhat singular, because it starts auto-accelerated and speed-up just after July, showing the highest crystallinity index in comparison to the other protocols.
Figure 5. Variation of the crystallinity ratio for the different protocols.
3.4 Discussion
The photo-oxidation of polyethylene is known a complex oxidation process where chain-scission and crosslinking reactions are in competition. The impact of such chemical reactions changes the original polymer molecular structure and morphology.
The incidence of the exposure period revealed a difference in the kinetic and rate of the production and consumption of the different chemical species. For all the ageing protocols, curve fitting of the FTIR spectra shows that the chemical species are practically the same, but their rate and final concentration are dramatically different. It has also been revealed that the dominant carbonyl species are aldehydes followed by ketones, acids and esters respectively. Also, the photo-oxidation rate is highly related to the exposure period, depending on temperature and solar energy [11-12], [23] [27-28].
Indeed, among all the ageing periods in this exposure site the one starting in April is certainly the most harmful since the carbonyl and vinyl concentrations as well as the crystallinity index are the highest. April being followed by summer one can expect that this hottest period of the year contributes to increase the degradation rate. Moreover, compared to the other protocols starting in the cold season the material shows a shorter induction time, which seems to promote the growth of the different chemical species (Fig.3). The polymer is therefore more oxidized and the chain scissions seem to be the more relevant feature according to the concentration of vinyl groups (Fig.4b). Crystallinity increases as well, consequently to the diffusion of the short chain segments towards the existing crystalline lamellae. It is well known that chain scissions are responsible for the loss of mechanical properties, while crystallinity makes the material more brittle and stiffer [15-16], [20].
Inversely, protocol 1 seems to be less deleterious in terms of final concentration of photo-oxidation products [12] (Fig.3 and 4b).
A comparison between the oxidation kinetic curves and those of the crystallinity index shows that their variation are somewhat related. Therefore, oxidation followed by chain scissions leads to the reinforcement of the crystallinity degree (Fig.5) via a chemo-crystallization process [29].
Among all the oxidation products, the highest concentration is that of the aldehydes, whatever the protocol of ageing is. Many routes exist to produce different oxidations products identified during ageing. However, the season at which the protocol starts can affect the way leading to the final products. According to the mechanism proposed
in Scheme 1, aldehydes and vinyls can be produced either by chain scission in the close vicinity of a macro-alkoxy (a) or by a b scission of a ketone via the NII process. The ketone itself comes from a cage reaction between the macro-alkoxy and a hydroxyl radical [18], [24-26], [30]. This ketone can be transformed into a keto radical and a macroradical via the N I process which is known to be possible when solar energy or temperature are relatively high. The keto radical can then react with a hydrogen atom to form aldehydes, beside to that, vinyls are formed by hydrogen abstraction from a macroradical. The keto radical can also recombine with a macroradical to form another ketone which itself can be cleaved in β position via the NII process, hence producing aldehydes and vinyl groups. It can be concluded that most of the routes in the mechanism lead essentially to the formation of these two kinds of chemical species which concentration are the highest in the aged material.
Scheme 1 shows the production of the different types of carbonyl groups (aldehydes, ketones, carboxylic acids and esters). Their formation is almost always followed by that of vinyls.
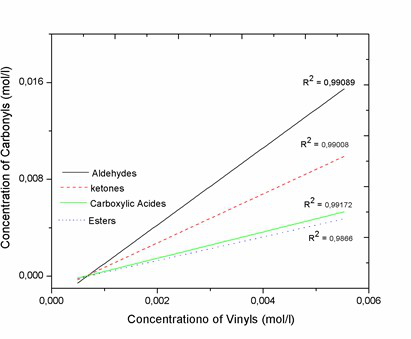
The graphical representation of the concentration of these four species as a function of that of the vinyls strengthens the mechanism described in Scheme 1. Indeed, all the regression curves are linear with a correlation coefficient (R2) close to one (Fig.6).
Scheme 1. Steps of mechanism reactions of chain scission in LDPE.
Scheme 2. Vinylidenes consumption by reaction with a secondary alkyl radical.
Another aspect of the solar radiation on unsaturations is the consumption of vinylidenes. It can be explained by their reaction with free radicals leading to crosslinking, known to contribute to the reinforcement of the mechanical properties at the beginning of the ageing protocols [16], [31] Scheme 2.
Figure 6. Variation of the concentration of carbonyls versus the concentration of vinyls (Protocol of January).
Solar energy is radiant light and heat delivered by sun. It is the most important factor affect the plastic films outdoor exposed. Such photonic energy can interact with the weakest sites of the macromolecular chains, leads to structural modifications mainly identified as oxidation, crosslinking and chain scissions. Additionally, to that, the overheating of the contact zone of plastic films with the greenhouse metallic support is another factor promote a rapid failure of the material.
A full analysis of the FTIR spectra has allowed the identification of most of the chemical species and to show how they are consumed or develop throughout ageing.
Curve fitting has been found to be a powerful tool for the identification of the chemical species constituting the complex and composite absorption bands of the carbonyls, and unsaturation. It revealed that the exposure of the films at different periods of the year does not affect the type of developing oxidation products but it is rather their kinetic which differ. It has also shown that aldehydes, carboxylic acids, ketones, and esters are the main oxidation products formed during ageing. A good correlation has been found between the just-mentioned carbonyl species and the vinyl groups. This feature seems to suggest that their formations are closely related and the mechanisms supposed to be common to these different species are the NI and NII process. Indeed, the kinetic formation of carbonyl groups is higher during the warm season and it is the same for the crystallinity degree. This argues for a higher chain scission activity which tends to follow the path of the oxidation mechanism passing essentially through the NII process, to which is added the contribution of the NI during this period.
[1] Lv Y., Huang Y., Yang J., Kong M., Yang H., Zhao J.,Li G. (2015). Outdoor and accelerated laboratory weathering of polypropylene: A comparison and correlation study, Polymer Degradation and Stability, Vol. 112, pp. 145-159. DOI:10.1016/j.polymdegradstab.2014.12.023
[2] Briassoulis D., Aristopoulou A., Bonora M., Verlodt I.(2004). Degradation and characterization of agricultural low-density polyethylene films, Bio System and Engineering, Vol. 88, No. 2, pp. 131-143. DOI:10.1016/j.biosystemseng.2004.02.01
[3] Smith J., VanNess H. (2001). Introduction to Chemical Engineering Thermodynamics, McGrawHill, New York, pp. 458-461.
[4] Mirandola A., Lorenzini E. (2016). Energy,environment and climate: from the past to the future,International Journal of Heat and Technology, Vol.34, No. 2, pp. 159-164. DOI: 10.18280/ijht.340201
[5] Briassoulis D. (2005). The effects of tensile stress and the agrochemical vapam on the ageing of low-density polyethylene (LDPE) agricultural films. Part I .Mechanical behavior, Polymer Degradation and Stability, Vol. 88, No. 3, pp. 4895. DOI:10.1016/j.polymdegradstab.2004.1111.021
[6] HolmanJ.P. (1988). Thermodynamics, McGraw-Hill,New York, pp. 500-525.
[7] Sonntage R.E., Borgnakke C. (2001). Introduction to Engineering Thermodynamics, Wiley, pp. 625-634.
[8] Verdu J. (1984). Vieillissement des Plastiques,AFNOR, Paris, pp. 232-235.
[9] Holman J.P. (1990). Heat Transfer, McGraw-Hill,New York, pp. 101-129.
[10] Bejan, A. (1993). Heat Transfer, Wiley, New York, pp.131-152.
[11] Pitts D.R., SissonL.E. (1998). Heat Transfer, Schaum’s Outline Series, McGraw-Hill, New York, pp.181-186.
[12] Songying Z., Chenchen, Naiyan Z. (2015). Research on the influences of insulation technology by plastic greenhouses on working temperature in aeration tanks in cold areas in winter, International Journal of Heat and Technology, Vol.33, No. 1, pp. 181-186. DOI:10.18280/ijht.330125
[13] Chabira F.S., Sebaa M., G'sell C. (2008). Influence of climatic ageing on the mechanical properties and the microstructure of low-density polyethylene films, Journal of Applied Polymer Science, Vol. 110, No. 4,pp. 2516-2524. DOI: 10.1002/app. 28823
[14] Wang Y., Huang D. (2017). Effect of heat treatment temperature on the structure and tribological properties of nanometer lanthanum borate, International Journal of Heat and Technology, Vol. 35, No. 1, pp. 53-58.DOI: 10.18280/ijht.350107
[15] Li X., Tang C., Wang Q., Li X., Hao J. (2017).Molecular simulation research on the micro effect mechanism of interfacial properties of nano SiO2/meta-aramid fiber, International Journal of Heat and Technology, Vol. 35, No. 1, pp. 123-129. DOI:10.18280/ijht.350117
[16] Tavares A.C., Gulmine J.V., Lepienski C.M., Akcelrud L. (2003). The effect of accelerated aging on the surface mechanical properties of polyethylene,Polymer Degradation and Stability, Vol. 81, No. 2, pp.367-373. DOI: 10.1016/S0141-3910(03)00108-3
[17] La Mantia F.P. (1984). Natural weathering of low density polyethylene — I: Structural modifications,Radiation Physic Chemistry 1977, Vol. 3, No. 6, pp.
699-702. DOI: 10.1016/0146 5724(84)900025-6260[18] Salvalaggio M., Bagatin R., Fornaroli M., Fanutti S.(2006). Multi-component analysis of low-density polyethylene oxidative: degradation, Polymer Degradation and Stability, Vol. 91, pp. 2775-2785.DOI: 10.1016/j.polymdegradstab.2006.03.024
[19] Yagoubi W., Abdelhafidi A., Sebaa M., Chabira S.F.(2015). Identification of carbonyl species of weathered LDPE films by curve fitting and derivative analysis of IR spectra, Polymer Testing, Vol. 44, pp. 37-48. DOI:10.1016/j.polymertesting.2015.03.008
[20] Chabira S.F., Sebaa M., G'sell C. (2012). Oxidation and crosslinking processes during thermal aging of low-density polyethylene films, Journal of Applied Polymer, Vol. 124, No. 6, pp. 5200-5208. DOI:10.1002/app. 34080
[21] Wunderlich B. (1973). Macromolecular Physics, Vol.1, Crystal Structure, Morphology, Defects, Academic Press, United States, pp. 170-192.
[22] Vasile C., Pascu M. (2005). Practical Guide to Polyethylene, iSmithers Rapra Publishing, United Kingdom, pp. 165-173.
[23] Dilara P.A., Briassoulis D. (1998). Standard testing methods for mechanical properties and degradation of low-density polyethylene (LDPE) films used as greenhouse covering materials: a critical evaluation,Polymer Testing, Vol. 17, No. 8, pp. 549-585. DOI:10.1016/S0142-9418 (97)00074-3
[24] Gardette M., Perthue A., Gardette J.L., Janecska T.,Földes E., Pukánszky B., Therias S. (2013). Photo-and thermal-oxidation of polyethylene: comparison of mechanisms and influence of unsaturation content,Polymer Degradation and Stability, Vol. 98, No. 11,pp. 2383-2380. DOI:10.1016/j.polymdegradstab.2013.07.017
[25] Tidjani A. (2000). Comparison of formation of oxidation products during photo-oxidation of linear low-density polyethylene under different natural and accelerated weathering conditions, Polymer Degradation and Stability, Vol. 68, No. 3, pp. 465-469. DOI: 10.1016/S0141-3910 (00)00039-2
[26] Roy P.K., Surekha P., Rajagopal C., Chatterjee S.N.,Choudhary V. (2007). Studies on the photo-oxidative degradation of LDPE films in the presence of oxidised polyethylene, Polymer Degradation and Stability, Vol.92, No. 6, pp. 1151-1160. DOI:10.1016/j.polymdegradstab. 2007.01.010
[27] Benítez A., Sánchez J.J., Arnal M.L., Müller A.J.,Rodríguez O., Morales G. (2013). Abiotic degradation of LDPE and LLDPE formulated with a pro-oxidant additive, Polymer Degradation and Stability, Vol. 98,No. 2, pp. 490-501. DOI:10.1016/j.polymdegradstab.2012.12.011
[28] Satoto R., Subowo W.S., Yusiasih R., Takane Y.,Watanabe Y., Hatakeyama T. (1997). Weathering of high-density polyethylene in different latitudes, Polymer Degradation and Stability, Vol. 56, No. 3, pp.275-279. DOI: 10.1016/S0141-3910(96)00213-3
[29] La Mantia F.P. (1984). Natural weathering of low density polyethylene-III: Mechanical properties, Euro Polymer Journal, Vol. 20, No. 10, pp. 993-995. DOI:10.1016/0014-3057 (84)90083-1
[30] Fernando S.S., Christensen P.A., Egerton T.A. White J.R. (2007). Carbon dioxide evolution and carbonyl group development during photo degradation of polyethylene and polypropylene, Polymer Degradation and Stability, Vol. 92, No. 12, pp. 2163-2172. DOI: 10.1016/j.polymdegradstab.2007.01.032
[31] Dintcheva N.T., La Mantia F.P., Acierno D., Maio L.D., Camino G., Trotta F., Paci M. (2001). Characterization and reprocessing of greenhouse films,Polymer Degradation and Stability, Vol. 72, No. 1, pp.141-146. DOI: 10.1016/S0141-3910 (01)00008-8