OPEN ACCESS
Product Sustainability assessment is becoming ever more critical in the global competition; this is particularly true for building sector. This paper faces the problem of the analysis of sensitivity of this task by referring to a Life Cycle Assessment (LCA) case of a PVC window for civil buildings applications. Sensitivity has been appreciated by referring to two functional units to evaluate the quality of the environmental impacts by relating it to the window features: per piece and per square meter of see-through surface. It resulted that the sustainability impact calculated per square meter changes considerably with the change of the type of window. This sensitivity analysis leads to propose a new criterion of the analysis to provide a reliable assessment approach to be used for the evaluation of the environmental performance of products. The difference between the values of thermal transmittance measured and calculated is inferior to 5%, which it is an absolutely optimal value.
Life Cycle Analysis, Window frames, Thermal performance, PVC.
Global demand for polyvinyl chloride (PVC) is expected to increase about 3.2% per year until 2021 [1]. PVC is a key product of the chemical industry and, along with polypropylene and polyethylene, one of the most widely produced plastics. Approximately 39.3 million tonnes of PVC were consumed globally in 2013.
Asia-Pacific has 56% of the global market share, making it the largest sales market. North American and Western European markets are back on a growth path following losses in previous years.
The construction industry is the prime sales market for PVC products. In China, while there has been slowing, construction in China is still growing at higher rates than in most other countries.
The United States suffered from weak domestic demand in recent years, but is seeing local demand for PVC products rise again, thanks to positive developments in the construction sector.
In Western Europe, the crisis-affected countries on the Mediterranean Sea seem to have touched bottom. It view markets in Germany, France, and the United Kingdom as comparatively stable. Overall Western European consumption of PVC is projected to rise again by approximately 1% in the coming years
Pipes and conduits are the most important PVC products. PVC is also used for plastic profiles and films/sheets. PVC is also used in cables and cable sheathing, floorings, automotive coatings, medical products such as infusion bags, and shoes.
This paper focuses on PVC window frames and considers the task of assessing their sustainability via life cycle environmental impacts. Assessing sustainability of products means to evaluate the impacts of the production, use and disposal phases and decision taken on the LCA study are critical to the final conclusions drawn. The sensitivity analysis here suggested is aimed at assessing how good is the standard LCA approach in determining the right product sustainability as a function of the different assumptions made in LCA analysis: namely, the functional units and the product features. The interest of the paper is tied to the type of application addressed, the PVC windows frame for civil buildings applications.
Windows are a significant component in sustainable buildings in both the impacts caused by their material life cycles and by their influence on the performance of a building over its service life [2]. As concern the use phase of windows, when to employing windows in buildings there are some aspects to evaluated, for examples: the visual contact between interior and exterior, use of daylight, minimizing thermal losses and optimizing thermal comfort, etc. In a word, LCA study should be complemented with an accurate on-field analysis of the product performance and efficiency, otherwise the conclusions drawn can be misleading.
The area of the windows in the building envelope is approximately the 20% of the total area envelope and the overall heat losses through the windows is even more than 4 times higher than for the insulated building walls. The heat losses can be suppressing through windows with the use of wooden shutter closed by night. For the present sensitivity analysis, with concern to experimental studies in the field of civil application for windows, we refer to the below reported. An experimental study to determine the overall heat transfer coefficient of the double-glazed window without low emission coating and the heat losses through window glazing that use roller blinds, as published in [3] an [4]. In [5] the study provides convective heat transfer models for natural convection, forced convection due to a ceiling slot diffuser, and forced convection due to a floor register. Results show that heat transfer is dependent on supply flow rate, blind angle, diffuser location and window configuration.
In [6] the paper presents a methodology for the parametric study of a window optimal dimension, based on the thermal performance of a reference room located in the climate region of Coimbra, Portugal. The thermal assessment is carried out by calculating the degree-hours of discomfort using dynamic simulation. In [7] two different two-dimensional frame/spacer heat transfer calculation methodologies used in North America and in Europe were compared. The [8] shows algebraically that the differences between the ISO and ASHRAE methods turn out to be due to the way the corner regions of the window frame and glazing are treated for the evaluation of the thermal transmittance by two-dimensional calculations.
In [9] the authors present the results of an energy study of different window frames and rolling-shutter boxes through the use of finite element methodology and experiments in situ; was studied six different types of windows frames (PVC, wood and wood-aluminum) and four different models of rolling shutters-boxes (all with structure made by expanded polystyrene EPS). The experimental analysis allowed the comparison between the thermal transmittance values calculated according to the UNI EN ISO 10077-1/2 and measured in accordance with ISO 9869.
There have been also several LCA studies of PVC windows frames. In [10] the authors assesse the environmental impact of wood window restoration versus replacement with the polyvinyl chloride (PVC) window and aluminum-clad wood window for the entire “cradle to grave” life cycle of the window assembly. In [11] the LCA studies were compared to evaluate the impacts of different framing materials with mixed results. LCA has also been used to estimate the environmental payback of higher manufacturing impacts from producing better performing windows. In [12] the paper have the focus on how the LCA can be used to support the selection of environmental criteria for GPP.
No LCA studies have been found so far in literature focusing on the sensitivity of the LCA study with respect to the main assumption, namely the size of the PVC windows and its on-field features.
LCA has been used as a tool to estimate the environmental impacts of window frames recycling following the ISO 14040/44 methodology ([13],[14]). According to this standard approach, there are four linked components of LCA:
The life cycle of a building window typically should include: raw material extraction, manufacture of raw materials, distribution of materials between extraction and assembly, assembly of materials into windows, utilization and maintenance of windows, window disposal.
Emissions and consumptions were translated into environmental effects, which were grouped and weighed. Carbon footprint was calculated with methodology IPCC 2001 GWP 100 [15].
While the most of the LCA analysis on windows refers to standard databases, it is clear that no one refers to real characteristics of the window as well as on on-field performances. These will form a different scenario to assess the sensitivity of the methodology in the rest of the paper.
2.1 Scope definition and boundaries definition
The Italian company addressed for the present paper is settled in South Italy and is voluntary committed for the evaluation of the environmental footprint. To this aim, the first objective of the analysis performed was to evaluate the amount of resources required to produce a PVC window and the correspondent emissions.
Establishing the boundaries for measuring a carbon footprint is a necessary to ensure the accuracy of a footprinting approach. This raises the issue of whether the measurement of a carbon footprint should include indirect emissions embodied in upstream production processes.
The main goal of the LCA calculation is to reduce the environmental impacts by guiding the decision-making process. The results of the LCAs can be used internally to help identify the key stages in the product life cycle—for example, where the largest sources of emissions and energy use over the device life cycle take place—and to take action to minimize these impacts. The company use life cycle assessment to monitor the development over time and assess many different environmental impacts beyond just emissions to avoid burden shifting ensuring to drive the development in the right direction.
A total of 4 products were analyzed according to the following settings: fixed window (1200x1200 mm equal see-through surface), two-wing window (900x1200 mm see-through surface), one-wing window (1300x1200 mm see-through surface) and three-wing window (1700x1200 mm see-through surface). It is suppose for the PVC window a life time of 30 years.
In Table 1 the calculation of the surfaces, with information relating to the thermal transmittance and the total weight, are reported.
Table 1. Characteristics of the windows
|
Typology |
Thermal transmittance U |
Visible area Ag |
Total weight P |
|
fixed window |
1.63 |
1.24 |
34.95 |
|
one-wing window |
1.62 |
0.9 |
33.89 |
|
two-wing window |
1.67 |
1.4 |
50.25 |
|
three-wing window |
1.69 |
1.79 |
70.07 |
This study, starting from the processes upstream from the company considers the whole life cycle until the use phase (of the window energy needs installed in a particular building). According to EN 15804, the study is a cradle to gate with options (A1, A2, A3, A4, A5, B1). In the system boundaries have been considered:
The end of life was excluded from the characterization of the impacts, because the company was not responsible for replacement of the frame building.
The selection of the boundaries of the system was consistent with the objective of the study.
The study refers to the entire year 2014 and therefore the primary data are relevant to that period. Secondary data came from the database contained in the LCA software, SimaPro 8.0.3 [16]. Using the most recent data available, however, by adopting as a selection criterion including qualitative aspects, choosing substances or processes as similar as possible to the reality under study.
As a representative location area of buildings, the city of Matera was considered for data input, where the company had the largest number of customers.
Upstream of the study was to define the following working hypothesis:
They are excluded from the study related environmental impacts:
2.2 Inventory analysis
Data quality has been adopted by splitting the information into:
For activities carried out within the production site, we were used specific data collected in the field and provided by the company. As for the processes of the life cycle upstream company, we were requested specific information to producers and in the case of difficulties in finding specific information, reference is made to data in the literature or in Ecoinvent database. Other general data do not exceed the 10% share on the impact category.
Activities and processes that together contribute less than 1% of the total weight window / doors are omitted from the inventory. For the cut-off was excluded the tape in the packaging phase. The allocation allows to assign to the quantity of the product defined in the function unit the correct amount of a specific input or output and consequently the relative impact to it connected. The use of the allocation systems is reserved only to waste component and electrical energy, respectively, depending on the weight of the sections and reinforcements in the first case and in function of product units in the second case.
Following is the composition of the product for each type.
Table 1. Compositions of the windows
|
Typology |
Steel |
Glass |
PVC |
Other |
||||
|
fixed window |
11% |
70% |
16% |
3% |
||||
|
one-wing window |
24% |
42% |
28% |
6% |
||||
|
two-wing window |
28% |
39% |
31% |
2% |
||||
|
three-wing window |
27% |
34% |
32% |
7% |
||||
In the calculations of the impacts related to the use phase, the main parameter considered was the thermal transmittance of the window frames and the solar energy transmittance of glass, which strongly influences the heat loss, while for the final analysis we considered the energy consumption. As stated above, this calculation are quite new and provide new hint to assess the sensitivity of the LCA result.
To estimate the energy consumption in the use phase a standard room for analysis has been considered with the window located on an exterior wall.
To simplify the analysis, it was assumed that the outer wall where the window was mounted was the only heat loss point. That means that there is no flow of energy through the interior walls, floor or even from ceiling.
As regards the use phase will then take into consideration the following factors:
• the technical performance of the material: its thermal resistance;
• the duration of the window frame, which coincides with the duration of the structure in which it is used.
For the use phase it was important to estimate the energy needs.
The assumption made concerning the insulation of the building was that it was proportional to the external climatic conditions and accordingly to the needs of indoor thermal comfort. Increasing in the thermal performance of the window corresponds to a decrease in the cost of heating and cooling. One of the methods to estimate the amount of energy required for heating and cooling, which has been used by many authors, is to calculate the number of degree-days [17,18]. The total number of heating and cooling degree-days (HDD and CDD) are calculated by:
$\mathrm{HDD}=\sum_{\mathrm{days}}\left(\mathrm{T}_{\mathrm{b}}-\mathrm{T}_{0}\right)^{+}$(1)
$\mathrm{CDD}=\sum_{\mathrm{days}}\left(\mathrm{T}_{\mathrm{p}}-\mathrm{T}_{\mathrm{b}}\right)^{+}$(2)
where Tb is the internal base temperature (in this study we used a value of 20°C in winter and of 25 °C in summer), To is the daily average outdoor air temperature and Tp is the perceived daily average temperature of the external environment.
The latter can be calculated with the following formula:
$\mathrm{T}_{\mathrm{p}}=\mathrm{T}_{\mathrm{o}}+\frac{5}{9}\left(6.11 \cdot \frac{\mathrm{RH}}{100} \cdot 10^{\frac{7.5 \cdot \mathrm{T}_{0}}{237.7 \cdot \mathrm{T}_{0}}}-10\right)$(3)
where RH is the relative humidity of external air.
The plus sign after the parenthesis indicates that only positive values are to be counted. We remember that the determination of Tb depends on various parameters such as climate conditions (e.g., temperature, humidity, precipitation and wind), building characteristics (e.g., thermal insulation, air leakage and solar gains) and personal preferences [19,20].
The winter load per unit area qH was determined using the heating degree days HDD:
$q_{H}=86400 \cdot H D D \cdot U-q_{S}$(4)
Instead the summer load qC per unit area was determined using the cooling degree-days CDD:
$q_{C}=86400 \cdot \mathrm{CDD} \cdot U+q_{S}$(5)
where qs is the energy solar per unit area transmitted through the glass.
The heating load EH can be calculated by dividing the efficiency of the heating system η:
$E_{H}=\frac{q_{H} \cdot A_{g}}{\eta}$(6)
Similarly, the cooling load EC can be determined by a similar expression, with EER, the coefficient of performance of the cooling system:
$E_{C}=\frac{q_{C} \cdot A_{g}}{\mathrm{EER}}$(7)
The calculation of the first term of (5) was neglected because CDD is near to zero for the climate of Matera, because of the minimum difference between Tp and Tb. The term qS can't be omitted and it is calculated with the next formula:
$q_{S}=\Phi_{S} \cdot g$(8)
where the value of g is 0,5 (value provided by the manufacturer of frame). In calculating the qS were excluded any type of shield, as this is not a technological feature of the window. The term ΦS is the sum of solar radiation in the vertical plane to the south (best exposure to optimize solar gains during the year) in the period of heating and cooling (UNI 10349).
The degree days for the municipality of Matera extracted from the DPR 412/93 are reported in Annex A [13].
The overall efficiency of the heating system fueled with natural gas is 0.9 (typical of a system with condensing boiler).
EER is 1.35 (typical of a refrigerating machine to air); value that takes into account the conversion of electricity into primary energy.
2.3 Experimental methodology for evaluation thermal transmittance
For the study of windows frame we applied a research methodology, validated from the authors in previous studies, based on finite element analysis (FEM) and experimental measures on site.
Using these it was possible to schematize the numerical model and calibrated the FEM.
In the research we have three main phases:
1. An experimental phase for the conductance measurement based on the standard prEN 15203;
2. Validation and calibration of the FEM schematize for the frame system and of the rolling-shutter box system;
3. Calculation of thermal transmittance according to the UNI EN ISO 10077-2.
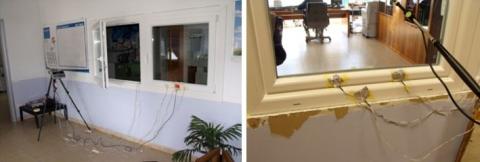
In the situ campaign, at the University of Basilicata- Matera, we measured the surface temperatures and heat flux on window frame system made in PVC. The system was mounted on a partition wall between two rooms, which were air-conditioned achieving a constant thermal difference of about 7 ° C, Figure 1.
Figure 1. Example of frame measured
With this value it was possible to operate with high output signals from the transducers, reducing the external disturbances. In fact the measuring instruments operate in ranges significantly greater than the minimum threshold of detection and the changes of the signals are significantly higher than the minimum resolution of the instruments.
The measurement campaign went on 20 days for a total of 1200 values. After 20 days we calculated the thermal conductance and the thermal transmittance with the method called “progressive average” or “moving average”.
So you calculate thermal conductance C from the sampled values of the two surface temperature T1 e T2 and heat flux j at time j with the following equation:
$C=\frac{\sum_{j=1}^{N} \varphi_{j}}{\sum_{j=1}^{N}\left(T_{1, j}-T_{2, j}\right)}$(9)
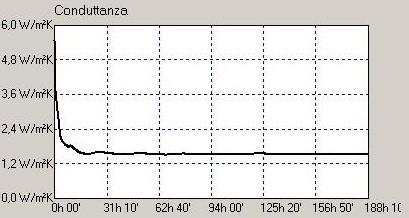
As N increases the ratio tends to converge to a stationary value not influenced by the thermal mass of the windows. This can easily be seen in Figure 2: the conductance converges with a maximum amplitude of about 0.05 W. m-2. °C.
For the calculation of the thermal transmittance, surface resistance according to norm is added to the value 1/ C (0.13 m2.°C.W-1).
Figure 2. Thermal conductance measured
For comparison the thermal transmittance of the windows with the numerical model FEM was calculated. In this way was possible to calculate the error respect the experimental analysis.
The results of measurements on the PVC window frame system were summarized in the following tables. The Table 2 shows the trasmittance measured in situ (prEN 15203) and calculated according to the UNI EN ISO 10077-2 through the application of the FEM method.
Table 2. Comparison between values of thermal transmittance
|
Typology |
Experimental method Thermal transmittance U |
Numerical method Thermal transmittance U |
Error % |
|
fixed window |
1.63 |
1.56 |
4.29 |
|
one-wing window |
1.62 |
1.54 |
4.94 |
|
two-wing window |
1.67 |
1.61 |
3.59 |
|
three-wing window |
1.69 |
1.62 |
4.14 |
The difference between the values of thermal transmittance measured and calculated is inferior to 5%. In calculations for the annual energy requirement the value of the measured Thermal Transmittance was used.
Instead, regard the coefficient of solar energy transmittance of glass g, we have used the value indicated of the manufacturing firm: 0.5.
2.4 Impact assessment
The Table 3 illustrates what are the impacts in terms of CF, kgCO2eq.
Table 3. Carbon Footprint results
|
Typology kgCO2eq/pz |
Fixed window |
One-wing window |
Two-wing window |
Three-wing window |
|
A1 |
90,28 |
100,38 |
146,99 |
210,26 |
|
A2 |
7,33 |
7 |
10,29 |
13,71 |
|
A3 |
3,09 |
6,19 |
12,38 |
18,34 |
|
A4 |
4,61 |
4,47 |
6,6 |
8,93 |
|
A5 |
6,7 |
5,93 |
6,96 |
8,07 |
|
B1 |
742,23 |
535,39 |
857,25 |
1107,66 |
|
Totale in kgCO2eq per UF |
854,24 |
659,36 |
1040,45 |
1371,9 |
|
Totale in kgCO2eq per m2 |
688,58 |
732,02 |
742,92 |
765,73 |
The results show that in the lifetime of the windows, excluding the use phase, the greatest impact on climate is due to the use of PVC and glass profiles.
Most of the data collected for the stage of production and transport are of good reliability.
2.5 A sensitivity analysis of the results
The sensitivity analysis was conducted by varying:
Table 4. Sensitivity analysis
|
Typology |
PVC profile input |
Climate class |
|
fixed window |
1.3 % |
19 % |
|
one-wing window |
5.6 % |
18.2 % |
|
two-wing window |
6.4 % |
18.4 % |
|
three-wing window |
8.1 % |
18.2 % |
The previous table shows the results, noting that the change of location for the use phase has a major impact on the final CF, so it is important to focus in the comparison between CF of two different studies on the production phase, rather than all the use phase.
The residential sector has been achieved in the last years more and more importance in the total energy consumption scenario by stimulating the research for solutions to promote energy efficiency and to raise awareness on energy consumption by end use [21].
In [22] the authors present the results of the energy performance of buildings based on different climatic conditions under dynamic conditions. A first conclusion is that the difference between the values of thermal transmittance measured and calculated is inferior to 5%, which it is an absolutely optimal value.
Then the results of this study suggest that savings of environmental impacts can be achieved by using recycled instead of virgin PVC for window frames.
The Carbon Footprint performed in this paper is based on a Life Cycle Assessment (LCA), where the choices taken can affect the conclusive results.
The per square meter results can be applied in other contexts with different dimensional characteristics with the appropriate limitations.
Which limitation will recalls that CF refers to a single impact category and cannot therefore never be used as the sole environmental performance synonymous. The CF is a single indicator and cannot represent alone the overall environmental impact of a product.
The difference between the results for m2 and that for piece highlights the delicacy with which the information in the report should be read and interpreted. In conclusion in the companies in which the process of collecting and data processing for the purposes of calculating the CF is at an advanced stage, it is possible to devote more and more attention to the environmental impact assessment of technological innovations and other changes to the production process.
The authors wish to acknowledge the Cooperativa Serramenti Coserplast srl company for the permission of disclosure of data utilized.
|
Ag C CDD EC EH EER g HDD N P qC qH qS RH Tb To Tp T1,j T2,j U |
visible area of window, m2 thermal conductance, W. m-2. °C-1 cooling degree-days, °C. days cooling load, J heating load, J coefficient of performance of the cooling system, dimensionless solar energy transmittance of the glass, dimensionless heating degree-days, °C. days total number of time steps, dimensionless weight of window, kg summer load per unit area, J. m-2 winter load per unit area, J. m-2 solar energy per unit area transmitted through the window, J. m-2 relative humidity, % internal base temperature, °C daily average outdoor air temperature, °C perceived daily average outdoor temperature, °C temperature of surface 1 at time step j, °C temperature of surface 2 at time step j, °C thermal transmittance, W. m-2. °C-1 |
|
Greek symbols |
|
|
$\eta$ $\varphi \mathrm{j}$ $\phi_{\mathrm{S}}$ |
efficiency of heating system, dimensionless heat flux at time step j , W. m-2 solar energy incident on the window, J. m-2 |
[1] T. Somheil, “Study: global PVC demand to grow 3.2% annually through 2021,” Resin Princing, Building Costruction, Agugust 25, 2014. Available: http://www.plasticstoday.com/study-global-pvc-demand-grow-32-annually-through-2021/196257501821043
[2] F. Intini, S. Kühtz, P. Milano and M. Dassisti, “Analysis of sustainability assessment of building windows for italian residential market: life cycle analysis and LEED,” Procedia Environmental Science, Engineering and Management, vol. 2, no. 4, pp 239-247, 2015.
[3] C. Oleskowicz-Popiel and M. Sobczak, “Effect of the roller blinds on heat losses through a double glazing window during heating season in Central Europe,” Energy and Buildings, vol. 73, pp. 48-58, 2014. DOI: 10.1016/j.enbuild.2013.12.032.
[4] H. Shahid and D. Naylor, “Energy performance assessment of a window with a horizontal Venetian blind,” Energy and Buildings, vol. 37, no. 8, pp. 836–843, 2005. DOI: 10.1016/j.enbuild.2004.11.008.
[5] Clarka J., Peetersb L. and Novoselac A., “Experimental study of convective heat transfer from windows with Venetian blinds,” Building and Environment, vol. 59, pp 690–700, 2013. DOI: 10.1016/j.buildenv.2012.09.010.
[6] Amarala A. R., Rodriguesa E., Gaspara R and Gomes A., “A thermal performance parametric study of window type, orientation, size and shadowing effect,” Sustainable Cities and Society, vol. 26, pp 456–465, 2016. DOI: 10.1016/j.scs.2016.05.014.
[7] I. Susorova, T. Meysam, R. Anisur, L. C. Herek and E. Mahjoub, “The effect of geometry factors on fenestration energy performance and energy savings in office buildings,” Energy and Buildings, vol. 57, pp. 6-13, 2013. DOI: 10.1016/j.enbuild.2012.10.035.
[8] P. Blanusa, W. P. Goss, R. Hartwig, P. Weitzmannn, C. F. Jensen, S. Svendsen and H. Elmahdy, “Comparison between ASHRAE and ISO thermal transmittance calculation methods,” Energy and Buildings, vol. 39, no. 3, pp. 374-384, 2007. DOI: 10.1016/j.enbuild.2006.09.007.
[9] N. Cardinale, G. Rospi and T. Cardinale, “Numerical and experimental thermal analysis for the improvement of various types of windows frames and rolling-shutter boxes,” in Proc of VIII Italian Conference AIGE, vol. 1, pp. 74-79, 2014.
[10]Switala-Elmhurst K. and Udo-Inyang P., “Life cycle assessment of residential windows: saving energy with window restoration,” 50th ASC Annual International Conference Proceedings, 2014.
[11] Salazar J., “21 – Life cycle assessment (LCA) of windows and window materials,” Eco-efficient Construction and Building Materials, pp. 502-527, 2014.
[12] Tarantini M., Dominici Loprieno A. and Porta P. L., “A life cycle approach to Green Public Procurement of building materials and elements: A case study on windows,” Energy, vol. 36, no. 5, pp. 2473-2482, May 2011.
[13] B. Milutinović, G. Stefanović, M. Dassisti, D. Marković, and G. Vučković, “Multi-criteria analysis as a tool for sustainability assessment of a waste management model,” Energy, vol. 74, pp. 190-201, 2014. DOI: 10.1016/j.energy.2014.05.056.
[14] Environmental management–Life cycle assessment–Principles and framework, ISO, EN. 14040, 2006.
[15] Sustainability of construction works – Core PCR related to Construction Product Regulation (CPR), EN 15804, 2012.
[16] SimaPro 8.0.3, PRé Consultants, 2014, available at: https://www.pre-sustainability.com/installation-file-simapro-803
[17] A. Bolatturk, “Determination of optimum insulation thickness for building walls with respect to various fuels and climate zones in Turkey,” Appl Therm Eng, vol. 26, no. 11-12, pp. 1301–1309, 2006. DOI: 10.1016/j.applthermaleng.2005.10.019.
[18] K. Papakostas, T. Mavromatis and N. Kyriakis, “Impact of the ambient temperature rise on the energy consumption for heating and cooling in residential
[19] buildings of Greece,” Renewable Energy, vol. 35, no. 7, pp. 1376–1379, 2010. DOI: 10.1016/j.renene.2009.11.012.
[20] M. Kadioglu, Z. Sen and L. M. Gultekin, “Variations and trends in Turkish seasonal heating and cooling degree-days,” Climate Change, vol. 49, pp. 209–223, 2001. DOI: 10.1023/A:1010637209766.
[21] O. Buyukalaca, H. Bulut and T. Yilmaz, “Analysis of variable-base heating and cooling degree-days for Turkey,” Appl. Energy, vol. 69, no. 4, pp. 269–283, 2001. DOI: 10.1016/S0306-2619(01)00017-4.
[22] G. Puglisi, F. Zanghirella, P. Ungaro, G. Cammarata, “A Methodology for the Generation of Energy Consumption Profiles in the Residential Sector”, International Journal of Heat and Technology, vol. 34, no. 3, pp. 491-497, September 2016. DOI: 10.18280/ijht.340320.
[23] A. Genco, A. Viggiano, G. Rospi, N. Cardinale and V. Magi, “Dynamic modeling and simulation of buildings energy performance based on different climatic conditions”, International Journal of Heat and Technology, vol.33, no.4, pp. 107-116, 2015. DOI: 10.18280/ijht.330414.