OPEN ACCESS
The cooling energy requirements are a key issue for office buildings in warm climates, but they have become considerable also in temperate climates, ‘cause the growing level of buildings thermal insulation.
This aspect is more critical in office blocks than in residential buildings, due to the higher value of thermal energy supplied by internal loads. Office buildings are usually equipped with cooling systems in order to guarantee thermal comfort conditions for the office workers.
The aim of this work is the evaluation of energy saving reachable in office blocks cooling requirements, using a water indirect free cooling operating procedure for the plant.
It is assumed that the HVAC plant is equipped with dry-coolers that work as coolers of the refrigeration equipment condensers or just as coolers of the water to be supplied to fan coils.
As the more solar radiation there is, the more cooling power is needed, dry-coolers, equipped with on-board photovoltaic panels, have been considered.
The cooling loads of the office block have been evaluated through Energy Plus hourly time-step simulations for different climate conditions. Finally, electrical consumption of dry-c and energy produced by PV panels in different climates and with different tilts have been evaluated and compared.
Dry cooler, Energy plus, Energy simulation, Fan coil, Free cooling.
The amount of technical studies regarding thermal comfort and indoor environment quality has been increasing for several decades. Often, a great energy amount is required to provide an acceptable environment that does not impair the health and performance of the occupants and the trend of the last years is to look for innovative solutions which allow a reduction in energy consumption and related CO2 emissions. The choice of strategies for the improvement of the energy efficiency and the saving of non-renewable energy sources is a priority objective for energy policies in most countries. A clear example is the European Energy Performance of Buildings Directive (EPBD) [3]. Especially important has been the intensification of energy consumption in HVAC systems. In the north and central part of Europe, the focus was, initially, the reduction of the thermal energy requirement so the buildings thermal insulation was been increased. In fact, the regulations of different countries imposed limits increasingly restrictive in thermal transmittance.
An improvement of the thermal insulation of the envelope may not be the best recommendation, for the summer season, especially in those locations where solar gains are significant, such as the Mediterranean climates. [1].
In these cases, the cooling energy required, mainly due to the internal and solar gains, could become more important than the heating energy required in winter season.
In last decades, several well working systems have been developed to shade buildings from the solar radiation and to reduce internal solar gains, but wasn’t taken the same care for limiting the internal gains and therefore their relative weight has been growing more.
In particular, in office buildings the heat loads, caused by computers, occupancy and lighting, could be very important and sometimes even during the winter in some zones of these buildings internal gains could be higher than the heat losses through building envelope.
If the external air temperature is low enough, the water exiting from the terminal units can be cooled using a Dry-Cooler, which is passed through by the external air.
When the external air conditions are not suitable to allow the use of the Dry-cooler in this way, dry-coolers works just as coolers of the refrigeration equipment condensers.
The cooling loads of the office block have been evaluated through Energy Plus hourly time-step simulations for different climate conditions.
The results of the simulations show that the energy saving is higher in climates typical of northern locations thanks to a lower external air temperature.
We are now modelling the building and the plant by means of TRNSYS to also take into account how the dry color affects performance of the chiller
A study about energy consumption in buildings and particularly related to HVAC systems shows that, within the commercial sector, office buildings are, together with retail, those with the biggest consumption and CO2 emissions [2].
The most office buildings are therefore equipped with an air conditioning system. Conventional AC systems need a refrigeration equipment (chiller) to produce cold water and air-cooled chiller systems are commonly used in office buildings because of their flexibility.
Office buildings are classified among the non residential buildings with the highest energy consumption. Their annual energy consumption in Europe varies from 100 to 1000 kWh/m2y of conditioned floor space [3], depending on construction, HVAC and lighting installations, and boundary conditions.
The tertiary sector (non-residential building and agriculture) is among the fastest growing energy demand sectors and is projected to be 26% higher in 2030 than it was in 2005, compared to a 12% growth for residential buildings [4]. This fact points out the importance of investigating the use of energy in this sector.
This fact points out the importance of investigating the use of energy in this sector.
If the external air temperature is low enough, the water exiting from the terminal units can be cooled using a Dry-Cooler, which is passed through by the external air.
When the external air conditions are not suitable to allow the use of the Dry-cooler in this way, dry-coolers works just as coolers of the refrigeration equipment condensers
The feasibility of this system depends on the external air temperature, the required cooling load and the energy performance of the Dry-Cooler.
In order to evaluate energy saving achievable using the cool external air to reduce heat loads other studies were developed. Cannistraro et al. [5] found that in a CED (center of processing data) energy saving for air conditioning is equal to 50%, 36% and 21% in Milan, Rome and Catania respectively.
The present paper investigates the energy saving achievable by adding a link between the evaporator chiller side of a water system and the Dry-Cooler on the condenser side. In this way, when the climate conditions are suitable, the chiller can be by-passed, the Dry-Cooler operates in indirect free-cooling and the cooling energy requirements can be reduced. Energy savings have been evaluated for different weather conditions corresponding to locations in north, central and south Europe.
The advantage of an indirect free-cooling system has been investigated by authors [6] in a previous study. The case analyzed was made up of air ventilation systems to obtain comfort condition inside an industrial building by means of water evaporation process. The study proved the direct evaporative system to be the best choice in terms of thermo-hygrometric comfort level and electrical energy consumptions, but compared to the indirect evaporative system could show some drawbacks due to the moisture content of air it introduce in internal environment. Therefore, most of all, for humid climate an indirect evaporative cooling system is preferable.
In this paper, an office with typical construction, heat gains and operational patterns has been simulated with an advanced thermal simulation program released by the US Department of Energy (Energy Plus [7]).
In order to reduce the use of non-renewable sources, a photovoltaic installation could be considered to supply the electrical energy required by the chiller. When the HVAC installation heat transfer fluid is cooled with both the chiller and the dry-cooler, the amount of electrical energy requirement decreases. This allows a smaller photovoltaic installation.
2.1 Office building model
Office building is a typology quite uniform across the building stock, both in envelope and building services with similar indexes of energy needs for HVAC, lighting and appliances.
Therefore, without limits to the general validity of this study, it has been considered a typical office building.
Building has three floors, each one has a net internal floor area of 600m2 and a height of 2,7m and includes 24 rooms of internal net area of 25m2. Figure 1 shows the type floor.
The plant of the building is rectangular with the minor axis in the North-South direction.
In order to evaluate correctly the heat gains through windows, due to the different exposition at solar radiation, each floor has been divided into different thermal zones Zij, where i and j indicate the plane and the zone, respectively (Fig 1).
Figure 1. Type floor of the building
Envelope data of the building are listed in Table 1.
Table 1. Layers of the envelope of the building
|
Element |
Material |
s m |
|
External wall |
concrete |
0,06 |
|
|
polyurethane |
0,08 |
|
|
concrete |
0,1 |
|
Internal wall |
plaster |
0,015 |
|
|
hollow brick |
0,08 |
|
|
plaster |
0,015 |
|
Roof |
concrete |
0,1 |
|
|
polyurethane |
0,08 |
|
|
concrete |
0,06 |
|
Floor |
tiles |
0,02 |
|
|
screed |
0,02 |
|
|
aerated concrete |
0,08 |
|
|
concrete |
0,2 |
|
Window |
single glass |
0,004 |
|
|
argon |
0,006 |
|
|
single gas |
0,004 |
Regarding to internal loads, the following conditions [8], [9] have been assumed:
The internal loads have been considered in agreement with realistic people occupancy and schedule. The average occupancy number per day is roughly 12 person/100m2. The building operates from 7 am to 6 pm Monday through Friday.
2.2 HVAC-plant
The air conditioning system of the building is characterized by fan-coils that can be connected by a three-way valve to an electric water chiller or to a Dry-Cooler alternatively; the values of cooling EER and technical data of fan-coils and Dry-Coolers are reported in Table 2.
The hourly building thermal loads were calculated with the program Energy Plus [9]. The program is based on the response factor theory for the transient analysis of the thermal heat transfer in the building structures.
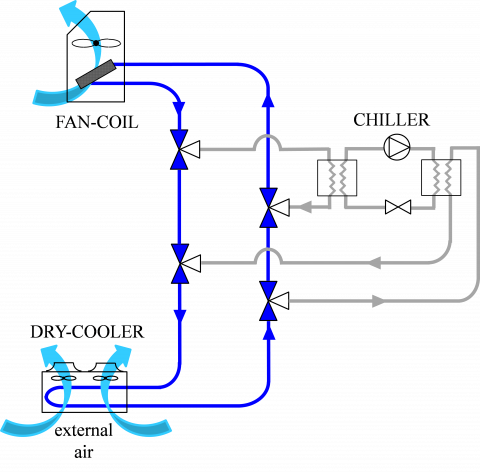
Figure 2 shows the concept scheme of the cooling system, including only the main system components. These are:
(a)
(b)
Figure 2. Schematic diagram for the cooling plant working with chiller (a) and without chiller (b)
A control system is necessary to deviate the water to cool down from the Dry-Cooler to the Chiller and vice versa, by turning a three way valve. In order to choose between the Chiller and the Dry-Cooler, the control system checks the values of Text, Twb, twf and tint. We assumed that $\vartheta_{i n t}=\vartheta_{e xt}$.
3.1 Mathematical model of fan-coil
A fan-coil unit has been selected from customers’ data sheets, in order to achieve the peak load evaluated by means of the program Energy Plus. In order to simplify the analysis, the building design load has been split into an integer number of fan-coil units with the same cooling capacity and therefore the same features.
The energy balance for a fan-coil unit can be written as follows:
$\begin{aligned} \phi_{F C} &=\dot{m}_{a, F C} \cdot c_{a} \cdot\left(\vartheta_{o a, F C}-\vartheta_{i a, F C}\right) \\ \phi_{F C} &=\dot{m}_{w, F C} \cdot c_{w} \cdot\left(\vartheta_{o w, F C}-\vartheta_{i w, F C}\right) \\ \phi_{F C} &=U_{F C} \cdot A_{F C} \cdot \Delta \vartheta_{l m, F C} \end{aligned}$(1-3)
In equations (1-3) $\phi_{F C}$ equals the internal cooling load, calculated hourly by Energy Plus and $\Delta \vartheta_{l m}$ is the logarithmic mean temperature.
The product UFCAFC, has been assumed to be constant, and has been evaluated using the working conditions suggested by the fan-coil manufacturer while working at mean flow rate.
During the simulation, $\vartheta_{oa, FC}$, $\vartheta_{iw, FC}$ and $\vartheta_{ow,FC}$ has been calculated every hour, $\vartheta_{ia, FC}$ has been assumed equal to ambient temperature $\vartheta_{int}$.
3.2 Mathematical model of dry-cooler
To model the behavoiur of the dry-cooler a similar energy balance has been solved:
$\phi_{D C}=\dot{m}_{a, D C} \cdot c_{a} \cdot\left(\vartheta_{o a, D C}-\vartheta_{i a, D C}\right)$
$\phi_{D C}=\dot{m}_{w, D C} \cdot c_{w} \cdot\left(\vartheta_{o w, D C}-\vartheta_{i w, D C}\right)$
$\phi_{D C}=U_{D C} \cdot A_{D C} \cdot \Delta \vartheta_{l m, D C}$(4-6)
The system of equations (4-6), like in the case of fan-coil, has been initially solved using technical features declared by the manufacturer to calculate UDCADC, and this parameter has been assumed constant for the Dry-Cooler during the whole simulation.
3.3 Working conditions
The studied plant is designed so that it can supply cold water to fan-coils coming from a chiller or, under suitable external weather conditions, from a dry-cooler.
When the external air conditions are not suitable to allow the use of the Dry-cooler to provide all the cooling capacity, the chiller is used sequentially.
3.3.1 Sensible free cooling conditions
To supply fan-coils using water cooled by the dry-cooler instead by the chiller, the average water temperature of dry-cooler must be lower than the average water temperature of dry-cooler $\vartheta_{w, DC}$ < $\vartheta_{w, FC}$. Recasting the previously written equations, this condition means that external air temperature must be lower than a maximum value $\vartheta_{ext, max}$, which depends on the features of fan-coils, on the features of dry-cooler and on the thermal load to remove from the building.
$\vartheta_{e x t}(h) \leq \vartheta_{e x t, \max }(h)$(7)
$\vartheta_{e x t, \max }(h)=\vartheta_{\mathrm{int}}-\frac{\Delta \vartheta_{a, F C}+\Delta \vartheta_{a, D C}}{2}-\phi_{b}(h) \cdot\left(\frac{\overline{\Delta \vartheta}_{r e f, F C}}{\phi_{F C}}+\frac{\overline{\Delta \vartheta}_{r e f, D C}}{\phi_{D C}}\right)$
Basing on this condition, total hours, in which Dry-Cooler can itself cover the cooling load have been evaluated.
Therefore, energy saving due to sensible free cooling has been obtained. In fact, in these hours there is only the electricity consumption of fans and there isn’t that one of the refrigeration system.
In order to evaluate consumptions of electrical energy of dry-cooler, the energy consumption of fans at nominal power has been considered adjusting it to account the part load running.
3.3.2 Chiller working conditions
When the external air temperature is too high, and so the condition (7) is not satisfied, the chiller must be used. In order to evaluate electrical energy requirements, the Energy Efficiency Ratio (EER) of the chiller has been fixed starting from the manufacturer datasheets and correcting it, in order to take into account the external air temperature influence.
After the evaluation of the energy requirement of the installation, the amount of the electrical needs that could be covered by the photovoltaic plant production has been evaluated.
An investigation of the performances of a PV panel was carried out by varying some parameters: weather data of different locations, tilt of the panels and their thermo-optical characteristics.
Then, for each of the considered climate conditions, the amount of electrical energy produced by PV panels has been evaluated.
In the study a 36-cell polycrystalline solar module has been considered (MPP125-80); datasheet of PV-panel are summarized in table 2.
Table 2. Datasheet of PV-panel
|
Maximun power at STC |
80 W |
|
Dimensions |
815x802x50 mm |
|
Weight |
10,4 kg |
|
Solar cell |
125x125 mm |
|
No. of cells |
36 (6x6) |
|
Front glass |
3,2 mm tempered glass |
|
Frame |
Anodized aluminium alloy |
4.1 Evaluation of PV-panels performances
The amount of electrical energy E generated by a PV panel can be expressed as:
$E=A \cdot G \cdot \eta \cdot \Delta t$(8)
Global solar radiation G on a surface in a specific location is defined as the sum of direct and diffused radiation reaching that location with suitable coefficients depending on the position of the sun and on the inclination angle of PV-panels:
$G=I_{b o} R_{b}+I_{d o} R_{d}+\left(I_{\mathrm{bo}}+I_{d o}\right) R_{r}$(9)
The efficiency of a PV-panel is defined as the ratio of energy output from the solar cell to input energy from the sun. The efficiency depends on the spectrum and intensity of the incident sunlight and on the temperature of the solar cell. Therefore, conditions under which efficiency is measured must be defined in order to compare the performance of one device to another.
Technical standards define a reference efficiency R, which is the efficiency measured under AM1 conditions, solar irradiation of 1000 W/m2 and at a temperature of 25°C.
The efficiency under different conditions can be expressed as:
$\eta=\frac{\eta_{R}\left[1-\beta\left(T_{a}-T_{R}\right)-\beta \frac{\mathrm{G} \tau \alpha}{U_{c}}\right]}{1-\frac{\eta_{R} \beta \mathrm{G}}{U_{c}}}$(10)
The U-factor Uc includes the following resistances:
(1) a front exterior resistance, which depends on convection heat transfer coefficient, radiaton heat transfer coefficient and therefore on wind speed, emissivity of PV cells material, air temperature and sky temperature.
(2) a resistance due to the layers constituting the PV panel, which depends on thermal proprieties of materials, that are reported in Table 3.
(3) a posterior exterior resistance.
Table 3. Thermal properties of the layers of PV-cell
|
Layer |
s mm |
$\lambda$ W/mK |
|
Front glass |
4 |
0,35 |
|
Silicon |
0,3 |
148 |
|
Back glass |
2 |
0,35 |
Since the U-factor is affected by weather data (wind speed and air temperature), its value has been evaluated hourly.
4.2 Energy supplied by PV panels
In order to evaluate the amount of electrical energy generated by a PV panel, international weather data, which have been made available from ASRAHE for energy calculations, have been used.
The evaluation has been carried out for different inclination angles (10°, 20°, 30°, 45° and 60°) of the south-facing PV-panels because it is important to determine the optimal angle that generates maximum energy, most of all if a solar tracking device is not available.
For example, Figure 3 shows monthly electrical energy produced by a 1m2 PV panel for different inclination angles in a north-Italy city (Milan).
Results show that the maximum of the electrical energy obtained from the PV-panels is reached from month to month by different panel’s inclination values. An inclination angle equal to 10° allows to obtain the most of the energy conversion during summer season, whereas an inclination angle equal to 60° allows to obtain the most of the energy in winter.
Figure 3. Electrical energy produced by a 1m2 PV polysilicon panel for different tilts in Milan
This happens for all considered countries and the reason is that, the solar altitude is greater in summer season when solar rays reach almost perpendicularly a surface with a little inclination angle respect to horizontal direction. Since higher cooling loads occurs during summer season, small inclination angles has been preferred.
4.3 Validation of the PV-model
In order to validate the procedure adopted to evaluate the energy produced by PV-panels, a field of measurements has been carried out.
4.3.1 Experimental set-up and comparison with experimental data
When the measurements have been done, the PV module has been fixed with an iron frame regulating each time the angle of incidence at fixed angles; to measure inclination angles during the measurements a steel goniometer fixed to the frame was used.
The voltage and the current produced by the modules have been measured by means of multimeters; to close the circuit a 70 W 24 V lamp has been used.
The PV module temperature has been measured by means of a thermoflow thermometer.
Figure 4. A 36-cell polycrystalline solar module (a) solarimeter (b)
In addition to electrical data of the panel, weather data has been collected using the meteorological station of University of Udine (Figure 4). The station was built during the MICMET project, which involves different meteorological stations in the Friuli Venezia Giulia region and had the purpose to study the regional microclimate.
The meteorological station is composed by an anemometer, a hygrometer, a solarimeter, a barometer and a pluviometer. Data have been collected every 10 minutes.
The solarimeter was calibrated in according to standard of “World Radiometric Reference” with a 100 W halogen tungsten lamp, an air temperature equal to 29°C and a solar radiation equal to 579 W/m².
Comparing experimental data with those obtained from calculations, appears that the percentage error is about 5% for cloudy days and above 10% for others.
5.1 Building cooling requirements covered by free cooling
The daily cooling load covered by the Dry-Cooler has been compared with the total sensible cooling load for each one of the considered locations. Then, a percentage of the possible Dry-Cooler contribution to the cooling energy demand coverage has been calculated and graphically represented in Figures 5 to 8.
Figure 5. Percentage of the building’s cooling load covered by Dry Cooler without chiller usage - Hamburg climate conditions
Figure 6. Percentage of the building’s cooling load covered by Dry Cooler without chiller usage - Frankfurt climate conditions
Figure 7. Percentage of the building’s cooling load covered by Dry Cooler without chiller usage - Milan climate conditions
Figure 8. Percentage of the building’s cooling load covered by Dry Cooler without chiller usage - Rome climate conditions
In figures from 5 to 8 only the hours of effective operation of the cooling plant have been taken into account, considering the occupancy schedule and the cooling power requirement as results from the simulations. Where the diagram has a null value, it means that there is no cooling energy requirement, and so both the chiller and the dry-cooler are not working.
The contribution of the Dry-Cooler is higher in the northern locations, where the external temperature is lower than the internal one for a longer period during the year.
However, northern locations have a cooling load lower than the southern ones.
5.2 Electrical energy saving
Since the Dry-cooler effect results in a lower chiller usage, an electrical energy saving could be achieved. This saving depends on the climate conditions and on the chiller’s EER.
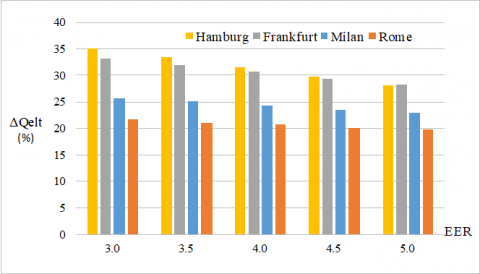
Figure 9 shows the reachable energy saving in the different locations and for different values of EER.
Figure 9. Annual electrical energy savings obtained thanks to the free-cooling, changing the EER
The energy saving is higher in climates typical of northern locations thanks to a lower external air temperature and because of a lower cooling load. This means that a larger amount of the cooling load can be covered by the free-cooling effect. The decrease of the energy saving with the higher values of the EER is explained by a lower amount of energy required by the chiller that results in a lower free-cooling benefit.
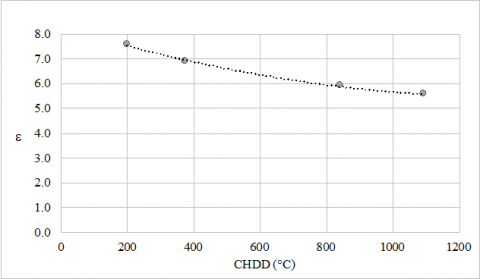
An efficiency e of the cooling system that includes the chiller and the dry cooler used as free cooler it has been defined in order to compare the behavoiur of cooling system in different locations.
$\varepsilon=\frac{Q_{c}}{Q_{e l t, f c}+Q_{e l t, c h}}$(11)
The weather of considered locations was characterized using the cooling hourly degree day CHDD.
Figure 10. Efficiency of the cooling system using free cooling for different values of cooling hourly degree day
Figure 10 shows a polynomial correlation between the efficiency of the system and the cooling hourly degree day.
The correlation coefficient is very close to 1, although it would be necessary to extend the analysis to a greater number of locations.
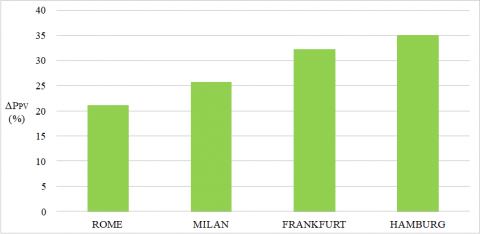
Figure 11. Percentage reduction of the peak power of the photovoltaic system due to employing of free cooling
In order to reduce the electrical consumptions of the building and of the cooling system, a photovoltaic system may be realized. The decrease of electrical requirements which is obtained using free cooling can reduce the peak power of a photovoltaic system. Figure 11 shows the percentage reduction of the peak power of the photovoltaic system due to employing of free cooling for the considered locations. Obviously the power reduction can be achieved either by reducing the area of the panels or by installing a lower efficiency panels; in both cases this means a reduction of PV plant installation costs.
In this work the energy savings achievable in office buildings, by means of indirect free cooling, has been investigated.
The results confirm a major potential of the plants equipped with Dry-Cooler for the northern locations. Simulations carried out with reference of climatic conditions typical of central and southern cities show that good results could be achieved, in terms of electrical energy savings, for these locations too. This should encourage the use of Dry-cooler equipped chillers connected to the emission system in a way which allows the indirect free-cooling at opportune values of the external air temperature.
The combination of Dry-cooler systems and photovoltaic installations allows a saving of non-renewables sources. Furthermore, the indirect free-cooling effect results in a smaller power of photovoltaic installation, when this is designed to cover, with his production, the HVAC electrical energy requirement.
|
A |
area |
|
c |
specific heat, kJ. kg-1. K-1 |
|
CHDD |
hourly cooling degree day |
|
G |
global solar radiation, W/m2 |
|
Ibo |
direct radiation on a horizontal surface |
|
Ido |
diffused radiation on a horizontal surface |
|
k |
thermal conductivity, W.m-1. K-1 |
|
P |
power, kW |
|
Q |
energy, kWh |
|
Rb |
inclination factor of direct radiation |
|
Rd |
inclination factor of diffused radiation |
|
Rr |
inclination factor of scattered radiation |
|
T |
temperature, K |
|
t |
time, s |
|
Uc |
heat transfer coefficient, W.m-2. K-1 |
|
Greek symbols |
|
|
$\alpha$ |
solar absorptance |
|
β |
volume coefficient of expansion, K-1 |
|
$\Delta$ |
Interval, variation |
|
$\varepsilon$ |
efficiency |
|
$\phi$ |
heat flux, W.m-2 |
|
$\eta$ |
efficiency of PV cell |
|
$\vartheta$ |
temperature, °C |
|
$\tau$ |
solar transmittance |
|
Subscripts |
|
|
a |
air |
|
b |
building |
|
c |
cooling |
|
ch |
chiller |
|
DC |
dry-cooler |
|
elt |
electrical |
|
ext |
external |
|
fc |
free cooling |
|
FC |
fan-coil |
|
i |
inlet |
|
int |
internal |
|
ml |
log mean |
|
o |
outlet |
|
PV |
photovoltaic |
|
R |
state of reference |
|
w |
water |
[1] A. Boyanoa, P. Hernandez and O. Wolf, “Energy demands and potential savings in European office buildings: case studies based on EnergyPlus simulations,” Energy and Buildings, vol. 65, pp. 19-28, Oct. 2013.
[2] L. Perez-Lombard, J. Ortiz and C. Pout, “A review on buildings energy consumption information,” Energy and Buildings, vol. 40, pp. 394-398, 2008.
[3] D. Caccaveli and H. Gugerli, “TOBUS – a EU diagnosis and decision making tool for office building upgrading,” Energy and Buildings, vol. 34, pp. 113-119, 2002.
[4] P. Capros, L. Mantzos, V. Papandreou and N. Tasios, “EU Energy and Transport Trends 2030 – Update 2007,” Office for Official Pubblications of the EU Communities, Luxemburg, 2008.
[5] A. De Angelis, M. Medici, O. Saro, G. Lorenzini, “Evaluation of evaporative cooling system in industrial buildings” International Journal of Heat and Technology, vol. 33, pp. 1-10, 2015.
[6] A. De Angelis, M. Medici, O. Saro, G. Lorenzini, “Evaluation of evaporative cooling system in industrial buildings” International Journal of Heat and Technology, vol. 33, pp. 1-10, 2015.
[7] Energy Plus Manual.
[8] ASHRAE Fundamentals Handbook, ASHRAE, Atlanta, 2001.
[9] ASHRAE Fundamentals Handbook, ASHRAE, Atlanta, 1999.