Influence of Dense Phase CO2 Pipeline Transportation Parameters
OPEN ACCESS
CO2 pipeline transportation is an important part of carbon capture, utilization and storage (CCUS) technology, and it’s economical and effective when the phase state is the dense phase and supercritical phase during the transportation. When the fluid is in single-phase flow during the process of transportation, the energy required is minimum. As the temperature of the supercritical transportation is increased above 31.4 ℃, heating problem occurs in the transportation process because of the influence of the ambient temperature. In this paper, the dense phase transportation and supercritical phase transportation are compared, and the results show that the dense phase transportation has much greater advantage. On this basis, in order to determine the range of parameters for CO2 pipeline transportation in dense phase and ensure safety transportation, the relationship between transportation pressure, temperature and pipeline transportation distance under the influence of different inlet temperature, pipeline flow, total heat transfer coefficient, ambient temperature, etc. are studied using HYSYS software simulator. The results showed that the flow rate and ambient temperature have great influence on the pressure along the pipeline. In order to ensure cost-effective pipeline transportation, pipeline flow rate should not be too large, with phase transition not occurring in the 300 km pipe length in dense phase transportation. This study is a basic research of CO2 pipeline transportation in dense phase. It has a reference value for the formation of a complete CO2 pipeline transportation system in China.
Dense Phase, CO2, Pipeline, HYSYS.
Carbon capture, utilization and storage (CCUS or CCS) is a technology with the potential to reduce greenhouse gas emissions [1-5]. For a large number of storage and medium distance transportation of CO2, (less than 1000 km), the use of pipelines are by far the safest and most economical way of transportation [6-11]. CO2 is widely used in the United States, Canada, Turkey etc. to improve the oil recovery efficiency, and the CO2 is transported by pipelines in the supercritical phase and the dense phase flow conditions [12-15]. Worldwide using pipeline to transport CO2 and CCS technology has attained certain experience, but the exploration or recovery of oil using CO2 and CCS have just started in advanced developing countries such as China [16-18]. So far, CO2 transmission pipelines in China for CCS technology, only involves individual oilfields transporting CO2 in gas or liquid phase to the well, with the advantage of the proximity of the CO2 point sources to the well [19]. In this paper, relevant parameters required for the safety and economic rationality of CO2 pipeline transportation in the dense and supercritical phases are analyzed.
Typically, CO2 is transported at a critical pressure of 7.38MPa, and a critical temperature of 31.4 ℃, with a three-phase point pressure and temperature occurring at 0.52MPa and -56℃ respectively [20]. At each phase state, CO2 has some special characteristics, and with a small variation of temperature and pressure can lead to change of phase state.
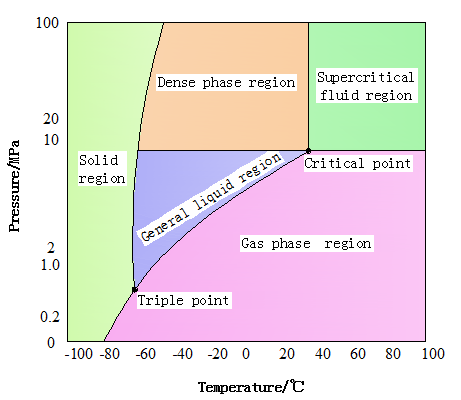
Pure CO2 phase can be divided into 5 regions, as shown in Figure 1. : (1) The supercritical fluid, with a pressure higher than 7.38MPa and temperature higher than 31.4℃. (2) The dense phase region, with a pressure higher than 7.38MPa, and temperature below 31.4℃ and higher than -56℃. (3) The general liquid region, with a pressure is lower than 7.38MPa and higher than 0.52MPa and a temperature lower than 31.4℃ and higher than -56℃. (4) The solid region with a temperature below -56℃. (5) The gaseous region with a temperature higher than -56℃ [20].
Figure 1. CO2 phase diagram
3.1 Characteristics of dense phase transport
When transporting CO2 in the dense phase in pipelines, the transmission temperature is slightly lower than the critical temperature with a pressure range maintained along the entire length of the pipeline. To ensure that the fluid along the pipeline remains in a dense state, the typical operational intervals for temperature and pressure of the CO2 are maintained in the ranges of 15-30℃ and 10-15 MPa respectively [21]. However, due to the special properties of CO2 and normal pressure drops in pipeline, it is not easy to maintain the CO2 within these ranges. The selection of the inlet pipeline temperature can be made taking into consideration the outlet temperature of CO2 liquefaction process.
3.2 Selection of equation
Based on the experience of CO2 pipeline transportation in industry, the thermo-physical properties of CO2 can be studied by using the PR state equation. This equation was proposed by Peng-Robinson in 1976, and it is widely used in engineering calculation of phase equilibrium; the expressions are shown in Eqn. (1) to (6) [22].
$p=\frac{R T}{V-b}-\frac{a(T)}{V(V+b)+b(V-b)}$(1)
$a(T)=a\left(T_{c}\right) \alpha\left(T_{r}, \omega\right)$(2)
$a\left(T_{c}\right)=0.45724 \frac{R^{2} T_{c}^{2}}{p_{c}}$(3)
$b=0.07780 \frac{R T_{c}}{p_{c}}$(4)
$\sqrt{\alpha}=1+m\left[1-\left(\frac{T}{T_{c}}\right)^{0.5}\right]$(5)
$m=0.37464+1.54226 \omega-0.26992 \omega^{2}$(6)
where, P- system pressure, kPa.
V- molar volume, m3/mol.
R- universal gas constant, 8.3143kJ/ (kmol/ k).
$p_{c}$-critical pressure, kPa.
T- system temperature, K.
$T_{c}$- critical temperature, K.
$T_{r}$- contrast gas temperature,$T_{r}=T / T_{c}$
$\omega$- eccentric factor (the eccentric factor of CO2 is 0.225).
Beggs & Brill-Moody (BBM) formula is adopted to calculate the hydraulic frictional resistance factor. The expression is shown in Eqn. (7) [22].
$-\frac{\mathrm{d} p}{\mathrm{d} Z}=\rho g \sin \theta+\rho \frac{\mathrm{d} E}{\mathrm{d} Z}+\rho v \frac{\mathrm{d} v}{\mathrm{d} Z}$(7)
where,$\rho$-average density of gas-liquid mixture, kg/m3.
g-acceleration of gravity, m/s2.
$v$-average velocity of mixture, m/s.
$\mathrm{d} E$-mechanical energy loss on per unit mass of the gas-liquid mixture, J/kg.
$Z$-flow direction.
$\theta$-included angle between pipe and horizontal direction, (°).
3.3 Comparison of dense phase and supercritical phase transport
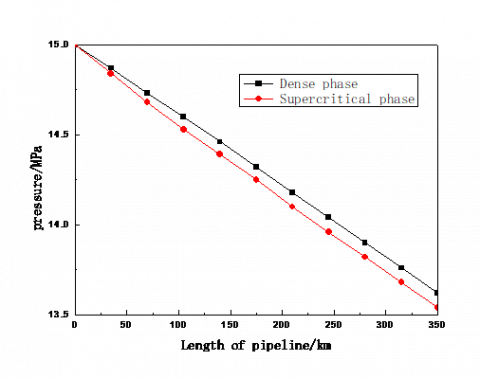
The CO2 transportation in pipelines mainly exist in the gas phase, liquid phase, dense phase and supercritical fluid phase. When the pressure and temperature are higher than the critical point, the CO2 exist as a single phase in the supercritical area. CO2 at the critical point or dense phase state has a density which is of the same order as many liquids. CO2 in the supercritical or dense phase is the most effective for pipeline transportation [16]. In this study, HYSYS software is used to simulate the dense phase and supercritical phase CO2 transportation. Both the dense phase and supercritical phase pipeline pressure are set at 15MPa. The inlet temperature of dense phase and the supercritical transport pipeline are 0 and 40℃ respectively, and the ambient temperature is 15 ℃. The simulation results are shown in Figure 2 and figure 3.
Figure 2. The pressure changes along the pipeline of dense phase and supercritical phase transportation
Figure 3. The temperature changes along the pipeline of dense phase and supercritical phase transportation
Figure 2 shows that during the pipeline transportation process, along the total pipe length, the pressure maintains a linear relationship with transportation distance, with the supercritical pipeline pressure drop greater than the dense phase transportation. Figure 3 shows that during the transportation process of dense phase, the temperature along the pipeline will drop to nearly the ambient temperature, but it is still in the dense phase temperature range, with no phase change occurring. Supercritical pipeline temperature in the range of 50 km has been reduced to below 31.4℃, and the CO2 phase transformed from supercritical to the dense phase. In order to ensure the pipeline is always in the supercritical condition, heating stations along the pipeline are needed. From the above analysis, we can be said that during the pipeline transportation process as defined by the parameters of this study, the dense phase transportation has a much greater advantage.
The above analysis therefore establishes that the pressure drop along the pipeline in dense phase transportation is lower than that of the supercritical and liquid phase transport. The operational investment or expenditure of the dense phase transportation will be slightly lower than that of the supercritical transportation, and much lower than that of the gas phase and liquid phase. The majority of CO2 pipeline projects in countries like China today are in short distance. The technology of dense phase CO2 transport will be a better option.
4.1 Pipe inlet temperature
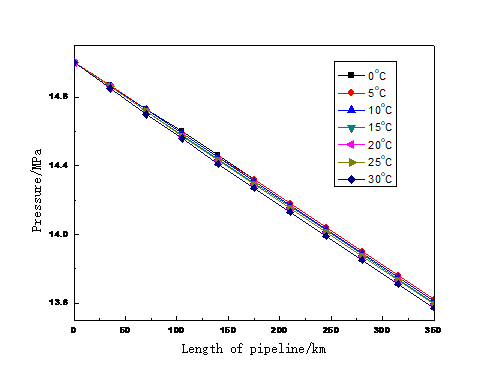
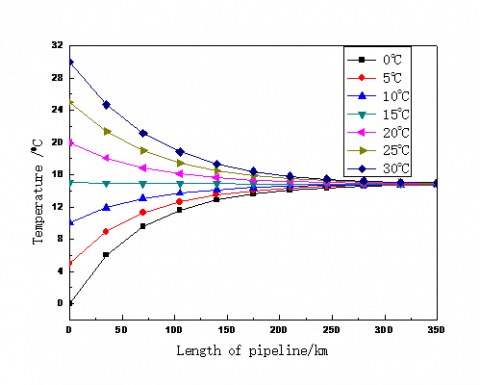
The farther the transportation distance, the greater the pressure drop and the temperature drop of the pipeline. The study of the pressure and temperature conditions in the pipeline can be used to guide the production practice and prevent the pressure and temperature drop to a certain region. Based on that, under the same situation in other conditions, by fixing inlet pressure and changing the inlet temperature, a study of the relationship between the pipe transportation pressure, temperature and transmission distance in different conditions can be analyzed. The inlet pressure of the pipeline is set at 15MPa, and the other conditions are shown in Table 1. Simulation results are shown in Figure 4 and Figure 5.
Table 1. External condition parameters of CO2 pipeline at different inlet temperature
|
Diameter/mm |
Total heat transfer coefficient/($\mathrm{W} \cdot \mathrm{m}^{-2} \cdot \square^{-1}$) |
Flow rate/($\mathrm{t} \cdot \mathrm{h}^{-1}$) |
Ambient temperature/℃ |
|
323.9 |
0.9 |
100 |
15 |
Figure 4. Effect of different inlet temperature on the pressure along the pipeline
Figure 5. Effect of different inlet temperature on the temperature along the pipeline
From Figure 4 and 5, it is seen that the inlet temperature of the pipeline has small influence on the pressure drop along the pipeline, but it has great influence on the temperature drop along the pipeline. When the difference between the inlet temperature and ambient temperature is large, temperature will change rapidly within the 100 km pipeline range. At 250 km, the temperature of pipeline is close to ambient temperature at different inlet temperatures.
4.2 Pipeline flow rate
The flow rate directly affects the pressure drop and the temperature drop of the fluid in the pipeline. A study of the relationship between the pipe transport pressure, temperature and the transmission distance in different states with the method of control variables is analyzed. The inlet pressure of the pipeline is set at 15MPa, the inlet temperature 0℃, and at different flow rates of 50t/h, 75t/h, 100t/h, 125t/h, 150t/h, 175th, and 200t/h.. The other conditions are shown in Table 2. Simulation results are shown in Figure 6 and Figure 7.
Table 2. External condition parameters of CO2 pipeline at different pipeline flow rate
|
Diameter/mm |
Total heat transfer coefficient/($\mathrm{W} \cdot \mathrm{m}^{-2} \cdot \square^{-1}$) |
State equation |
Ambient temperature/℃ |
|
323.9 |
0.9 |
PR |
15 |
Figure 6. Effect of different pipeline flow rate on the pressure along the pipeline
Figure 7. Effect of different pipeline flow rate on the temperature along the pipeline
Figure 6 shows that the flow rate has large influence on the pressure drop along the pipeline. The greater the flow rate of the pipeline, the larger the pressure drop. For large flow rate pipeline, large pressure drop may lead to the pipe pressure being lower than the critical pressure and phase transition process. So in the condition that the flow rate of the pipeline is large, recompression stations should be set according to the specific situations along pipeline. Figure 7 shows that, the smaller the pipeline flow rate, the faster the temperature changes, with the temperature along the line close to the ambient temperature at the least flow rate of 50t/h. In the case of the ambient temperature at 15℃, the temperature along the pipeline is kept in the dense phase temperature range.
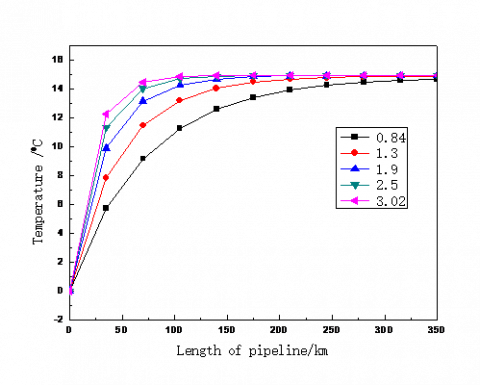
4.3 Total heat transfer coefficient
The total heat transfer coefficient of pipeline transportation process directly affects the total investment of pipeline insulation measures. The study of the influence of the total heat transfer coefficient of the pipeline on the parameters can provide a basis for the selection of the economic pipeline process. The inlet pressure of the pipeline is set at 15MPa and the inlet temperature 0℃. The heat transfer coefficients used for the pipeline analysis are 0.84, 1.3, 1.9, 2.5, and 3.02 $\mathrm{W} \cdot \mathrm{m}^{-2} \cdot \square^{-1}$ . The other conditions are shown in Table 3. Simulation results are shown in Figure 8 and Figure 9.
Table 3. External condition parameters of CO2 pipeline at different total heat transfer coefficient
|
Diameter/mm |
Flow rate/($\mathrm{t} \cdot \mathrm{h}^{-1}$) |
State equation |
Ambient temperature/℃ |
|
323.9 |
100 |
PR |
15 |
Figure 8. Effect of different total heat transfer coefficient on the pressure along the pipeline
Figure 9. Effect of different total heat transfer coefficient on the temperature along the pipeline
Figure 8 shows that the heat transfer coefficient has little effect on the pressure drop along the pipeline. On the other hand, Figure 9 shows that the heat transfer coefficient has a great influence on the temperature along the pipeline. When the total heat transfer coefficient is greater than 2 $\mathrm{W} \cdot \mathrm{m}^{-2} \cdot \square^{-1}$ , the temperature of the fluid at the 100 km length can reach the ambient temperature. From the above analysis, it shows that the thermal insulation performance does not significantly affect the dense phase in the transmission process.
4.4 Ambient temperature
The change of ambient temperature caused by the change of seasons and the alternation of day and night can have a certain effect on the transportation conditions. For purposes of analysis, different ambient temperatures of -15, -10, 0, 10, 15, 20, and 30℃ are selected for simulation. The other conditions are shown in Table 4. Simulation results are shown in Figure 10 and Figure 11.
Table 4. External condition parameters of CO2 pipeline at different ambient temperature
|
Diameter/mm |
Flow rate/($\mathrm{t} \cdot \mathrm{h}^{-1}$) |
State equation |
Total heat transfer coefficient/($\mathrm{W} \cdot \mathrm{m}^{-2} \cdot \square^{-1}$) |
|
323.9 |
100 |
PR |
0.9 |
Figure 10. Effect of different ambient temperature on the pressure along the pipeline
Figure 11. Effect of different ambient temperature on the temperature along the pipeline
Figure 10 shows that the ambient temperature has a little influence on the pressure along the pipeline within 100 km. With the increase of the transportation distance, the influence of ambient temperature on the pressure along the pipeline is significant. The higher the ambient temperature, the greater the pressure drops along the pipeline. Figure 11 shows that the fluid in the pipe can reach the ambient temperature at 200 km on the condition of different ambient temperatures.
In this paper, the characteristics of CO2 pipeline transportation under different temperatures and pressures along the pipe length have been studied using the HYSYS software simulator. CO2 pipe inlet temperature, pipeline flow rate, effect of heat transfer coefficient and ambient temperature situations was evaluated over the pipe transportation pressures, temperatures and transmission distance. The following conclusions are made:
(1) Compared with the gas phase transport, liquid phase transport and supercritical transportation, the dense phase transportation has a much greater advantage.
(2) The pipeline inlet temperatures have small influence on the pressure drop along the pipeline, but it has great influence on the temperature drop along the pipeline. When the difference between the pipe inlet temperature and ambient temperature is large, there will be rapid changes in temperature within the pipe length of 100 km range.
(3) The pipeline flow rate has large influence on the pressure drop along the pipeline. In order to ensure that the pipeline transportation is effective, the pipeline flow rate should not be too large.
(4) The total heat transfer coefficient has a little effect on the pressure along the pipeline, but it has a great influence on the temperature along the pipeline. When the total heat transfer coefficient is greater than 2 $\mathrm{W} \cdot \mathrm{m}^{-2} \cdot \square^{-1}$, the temperature of the fluid can reach the ambient temperature in the 100 km range. The thermal insulation performance does not significantly affect the dense phase in the transmission process. Hence, compared with the supercritical phase transportation, the dense phase transport is more economical in investment or operational expenditure by heat preservation.
(5) The ambient temperature has a little influence on the pressure along the pipeline within 100 km. With the increase of the transportation distance, the influence of ambient temperature on the pressure along the pipeline is significant. The higher the ambient temperature, the greater the pressure drops along the pipeline. At about 200 km, the fluid in the pipe reaches the ambient temperature on different conditions.
The authors gratefully expressed their thanks for the financial support for this research from the National Natural Science Foundation of China (no. 51306022, 51606013), from the National Natural Science Foundation of Hubei Province (no.2013CFB398), from the Science and Technology Innovation Foundation of PetroChina (no. 2015D-5006-0603) and from the Yangtze Youth Talents Fund (No. 2015cqt01).
[1] Haiyan Wang, Yafei Cheng, Bo Yu. “Adsorption effect of overlying strata on carbon dioxide in coalfield fire area,” International Journal of Heat and Technology, vol. 33, no. 3, pp. 11-18, 2015. DOI: 10.18280/ijht.330302.
[2] Hwalong You, Youngkyun Seo, Cheol Huh, et al. “Performance analysis of cold energy recovery from CO2 injection in ship-based carbon capture and storage (CCS),” Energies, vol. 7, pp. 7266-7281, 2014. DOI: 10.3390/en7117266.
[3] Liu Jianwu. “Key issues related to engineering design of CO2 transportation pipeline,” Oil & Gas Storage and Transportation, vol. 33, no. 4, pp. 369-373, 2014. DOI: 10.6047/j.issn.1000-8241.2014.04.006.
[4] Stefan Bachu. Identification of oil reservoirs suitable for CO2-EOR and CO2 storage (CCUS) using reserves databases, with application to Alberta, Canada. International Journal of Greenhouse Gas Control. [Online]. vol. 44, pp. 152-165, 2016. Available: http://dx.doi.org/10.1016/j.ijggc.2015.11.013.
[5] Y. D. Zhang, D. Wang, J. P. Yang, et al. “Research on the hydrate formation in the process of gas phase CO2 pipeline transportation,” International Journal of Heat and Technology, vol. 34, no. 2, pp. 330-344, 2016. DOI: 10.18280/ijht.340226.
[6] Maciej Chaczykowski, Andrzej J. Osiadacz. (2012, Jun.) Dynamic simulation of pipelines containing dense phase/supercritical CO2-rich mixtures for carbon capture and storage. International Journal of Greenhouse Gas Control. [Online]. vol. 9, pp.446-456. Available: http://dx.doi.org/10.1016/j.ijggc.2012.05.007.
[7] Kim Johnsen, Kaare Helle, “DNV Recommended Practice: Design and operation of CO2 pipelines,” Energy Procedia, vol. 4, pp.3032-3039, 2010. DOI: 10.1016/j.egypro.2011.02.214.
[8] Clair Gough, Laura O’Keefe. Sarah Mander, (2014, Jul.) Public perceptions of CO2 transportation in pipelines. Energy Policy. [Online]. Vol. 70. pp. 106-114.Available: http://dx.doi.org/10.1016/j.enpol.2014.03.039.
[9] Xiaolu Guo, Xingqing Yan, Jianliang Yu, et al. (2016, Jun.) Pressure response and phase transition in supercritical CO2 releases from a large-scale pipeline. Applied Energy. [Online]. vol. 178, pp. 189-197. Available: http://dx.doi.org/10.1016/j.apenergy.2016.06.026.
[10] Svend Tollak Munkejord, Morten Hammer, Sigurd W. Løvseth. (2016, Feb.) CO2 transport: Data and models – A review. Applied Energy. [Online]. Vol. 196. pp. 499-523. Available: http://dx.doi.org/10.1016/j.apenergy.2016.01.100.
[11] Kumar Patchigolla, John E. Oakey. “Design overview of high pressure dense phase CO2 pipeline transport in flow mode,” Energy Procedia, vol. 37, pp. 3123-3130, 2013. DOI: 10.1016/j.egypro.2013.06.198.
[12] Yu Xichong, Li Zhijun, Pan Xinxin. “Research on CO2 supercritical transportation technology,” Natural Gas Industry, vol. 29, no. 12, pp. 83-86, 2009. DOI: 10.3787/j.issn.1000-0976.2009.12.026.
[13] Wetenhall, B., Aghajani, H., Chalmers, H..“Impact of CO2 impurity on CO2 compression, liquefaction and transportation,” Energy Procedia, vol. 63, pp. 2764-2778, 2014. DOI: 10.1016/j.egypro.2014.11.299.
[14] Christopher J. Wareing, Michael Fairweather, Samuel A.E.G. Falle, et al. High pressure CO2 CCS pipelines: Comparing dispersion models with multiple experimental datasets. International Journal of Greenhouse Gas Control. [Online]. vol. 178, pp. 189-197. Available: http://dx.doi.org/10.1016/j.ijggc.2016.08.030.
[15] Qiyuan Xie, Ran Tu, Xi Jiang, et al. (2014, Feb.) The leakage behavior of supercritical CO2 flow in an experimental pipeline system. Applied Energy. [Online]. vol. 130, pp. 574-580. Available: http://dx.doi.org/10.1016/j.apenergy.2014.01.088.
[16] Li Xin. “Status of key technology research on carbon dioxide pipeline,” Oil & Gas Storage and Transportation, vol. 32, no. 4, pp. 343-348, 2013. DOI: 10.6047/j.issn.1000-8241.2013.04.001.
[17] Li Yuxing, Liu Mengshi, Zhang Jian. “Impacts of gas impurities on the security of CO2 pipeline,” Natural Gas Industry, vol. 34, no. 1, pp. 108-113, 2014. DOI: 10.3787/j.issn.1000-0976.2014.01.017.
[18] Qi Li, Lan-Cui Liu, Zheng-Ao Chen, et al. “A survey of public perception of CCUS in China,” Energy Procedia, vol. 63, pp. 7019-7023, 2014. DOI:10.1016/j.egypro.2014.11.735.
[19] Huang Hui, Zhou Jing, Su Kehua. “A discussion on the establishment of CO2 pipeline engineering desin criteria,” Natural Gas Industry, vol. 34, no. 12, pp. 131-134, 2014. DOI: 10.3787/j.issn.1000-0976.2014.12.019.
[20] Lu Cen. “Transmission rules of CO2 through pipelines and relevant operational parameters,” Oil & Gas Storage and Transportation, vol. 34, no. 5, pp. 493-496, 2015. DOI: 10.6047/j.issn.1000-8241.2015.05.007.
[21] Kumar Patchigolla, John E. Oakey. “Design overview of high pressure dense phase CO2 pipeline transport in flow mode,” Energy Procedia, vol. 37, pp. 3123-3130, 2013. DOI: 10.1016/j.egypro.2013.06.198.
[22] Liu Min, Li Yuxing, Zhao Qing, et al. “Sensitivity analysis of transportation parameters of supercritical CO2 pipelines,” Oil & Gas Storage and Transportation, vol. 33, no. 4, pp. 359-363, 2014. DOI: 10.6047/j.issn.1000-8241.2014.04.004.