OPEN ACCESS
Contrary to other applications, the basic design criteria of a ventilation system and air distribution for operating rooms are not primarily those related to thermal comfort, but to indoor air quality (IAQ). The aim of the present research concerns the study of the performance of different ventilation schemes for a standard orthopaedic Operating Theatre (OT). Taking into account our previous studies of a real OT under operating use conditions, in this research different air flow configurations combined with some air curtain solutions on were investigated by numerical simulations. IAQ indexes and thermal comfort parameters, deduced from simulation results were calculated and discussed referring to the best performance and efficacy of the studied air flow schemes. Results comparison shows that the position in the center of the room and the large surface of the air inlet ceiling diffusers, compared to that of the air return grilles, guarantee the best efficacy of the air flow both for unidirectional vertical and horizontal. Moreover, some air curtain solutions on the ceiling allow the air distribution and quality control, limiting the effects of a short-circuit between the air flow inlet and outlet and the contaminants reduction in critical zones.
(Presented at the AIGE Conference 2015)
Indoor Air Quality, Operating Theatre, Ventilation schemes, Numerical modeling, Unidirectional flow, Mean age of air.
At present there is a great deal of research on ventilation system efficiency for providing the most effective airflow pattern for contaminant removal (microorganisms i.e. fuWngi, bacteria, viruses; chemical i.e. waste anesthetic gases, CO2 and particulate matter) and assuring the control of surgical site infection risk. Computational fluid dynamics (CFD) modelling and simulation, compared with experimental monitoring results and literature evidences, are widely applied for providing useful indications on proper indoor microclimate conditions and IAQ [1]. Usually, three-dimensional time-dependent CFD models are developed to assess the airflow patterns, air velocity and temperature distribution due to laminar unidirectional (vertical downward) air flows [2], in other cases to turbulent air flows and also to the air curtains so as to achieve IAQ and optimal air asepsis [3].
Some authors have used CFD for a three dimensional analysis of thermal comfort and contaminant removal inside hospitals: checking model validity by experimental literature evidence and data comparison, they calculated the predicted mean vote (PMV), contaminant removal effectiveness (CRE) and mean contaminant concentration in the breathing zone by transient simulation results, in order to assess HVAC system
efficiency. They investigated the effect of horizontal location of supply and exhaust grilles also for maintaining adequate comfort conditions for patients and surgical staff [4]. Many literature has used CFD simulation to assess colony forming unit (cfu) dispersion and evaluate air flow distribution effectiveness in real OTs [. In a more specific research the influence of periodic bending movement of the medical staff combined with bacteria carrying particle distribution on the airflow field and temperature distribution have been investigated [5].
Most of these studies consider correct use, on-design operational conditions of OTs. Some new analyses have been proposed concerning moving object effects on the airflow inside OTs under correct and incorrect use conditions [6] [7]. In the most recent literature, the assessment of ventilation efficiency in OTs, including air flow distribution under different configurations and different positions of diffuser supply velocity, is studied by applying CFD simulation and full-scale experimental investigations [8]. A recent study based on experimental measurements and CFD simulation shows the efficacy of different ventilation systems in removing bacteria and particles using adducted return strategy to induce air flow from clean to less clean zones [9]. In the literature there is not much that addresses the analysis of the efficiency of a ventilation system in an OT, equipped with ante-chamber and/or air locking system for guaranteeing air pressure difference, indoor microclimatic conditions and IAQ, minimizing the air flow inlet from non-clean zones to the OT. A recent research work of the present authors has dealt with the efficiency of air curtain application for producing a vertical downward air curtain around the laminar diffuser using experimental data and CFD modelling of the studied real OT [10]. Actually, most of the work on this subject deals with different applications [11].
Linear slot diffusers have been used to create a vertical downward air curtain around the ceiling unidirectional flow diffuser towards low-level exhaust grilles, to avoid the in-ward flow under the unidirectional diffuser. The authors demonstrated that a clear correlation between the unidirectional flow and air curtain flow rates cannot be assumed and this cannot be read in a better indoor microclimate and IAQ conditions [12].
In the present work we investigated which scheme of the ventilation system inside the OT (i.e. dimensions and position of the inlet and outlet air diffusers) is effective to minimize risk of poor IAQ and surgical site infections caused by real operational use conditions. From a well-known starting phase, concerning our previous study of a real OT under operating use conditions [7], different configurations of the present ventilation scheme were studied with transient CDF simulations and corresponding results were compared and discussed calculating some crucial ventilation efficiency and thermal comfort parameters.
The validated numerical models built up with experimental and numerical results obtained from the OT simulations under real use conditions, presented in recent studies by the authors [7] are the fundamental base for the present research. In those papers the robustness and validity of the models by comparison between experimental and numerical results were shown: the influence of mesh refinement on results was also investigated in order to assure mesh independent results, and experimental and numerical results concerning ventilation patterns, CO2 concentration and particle diffusion in the OT.
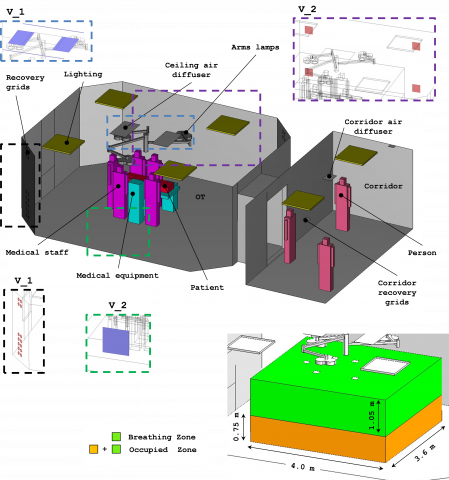
The real orthopedic OT is a rectangular-shaped room with smoothed corners, 43 m2 base area and 120 m3 volume: Figure1 shows the solid model. The model was made considering an operating bed, staff members around it, a lighting system made up of three joined arms and a sliding door connected to an entry corridor (Figure1). Two rectangular supply ceiling diffusers (0.56 m2 surface each one), that strengthen the unidirectional flow, are located at the ceiling. Two groups of 14 conical outgoing grilles (cross-section of 0.0128 m2) are arranged over two of the opposite four walls. The present ventilation scheme is labeled on V_real. Taking into account the two ANSI/ASHRAE Standards, 62.1-2004 and 55-2004, the total OT air-volume (TV) was divided into 3 zones, labeled from now on as Breathing Zone (BZ, highlighted in green in Figure1), Occupied Zone (OZ, highlighted in green plus orange in Figure1) and Peripheral Zone (PZ, corresponding to TV-OZ), for the air quality and thermal comfort indexes, referred to each one of these zones, computation. Two different configurations of ventilation scheme were studied starting from the initial one concerning real operating use conditions (V_real). A constant air flow rate of 25 fresh air changes per hour was always assumed, referring to the optimal result obtained by comparison between suggested values by present Italian and International standards for pressurization and ultra-clean ventilation of orthopaedic OTs [13] [14] [15]. The proposed ventilation schemes are the following:
•V_1 model with air supply (unidirectional vertical flow) and return scheme coinciding with the V_real but with two air curtains at the ceiling supply diffuser along the two sides of the operating table;
•V_2 model with one lateral air supply wall diffuser (unidirectional horizontal flow) with four air return grilles located at the bottom and top of the opposite wall with two return grilles at the sliding door.
Geometric elements used as inlet (in blue) and return (in red) sections for the previously listed configurations are shown in Figure 1. For all these schemes, the total air flow rate was considered constant and equal to 3000 m3·h−1 of fresh air (25 ACH), divided between the air supply diffusers and different air curtain systems as shown in Table 1.
Simulations were carried out by commercial software allowing multi-physical approach through solutions of the related governing equations by a Finite Element method [16] Solutions for the variables, air velocity (U) air pressure (p) , temperature (T ), carbon-dioxide concentration in air (CO2), mean age of air (τ ) and CFU concentration in air (CFU) were carried out. The basic formulation of the partial differential equation formulation (PDE) used for computations is:
$\frac{\partial(\rho \phi)}{\partial t}+\nabla \cdot(\rho \phi U)=\nabla \cdot(\Gamma \nabla \phi)+\Lambda$ (1)
Where ρ stands for fluid density, U velocity vector, Γ diffusion coefficient and Λ the source term. For fluid-dynamical analysis a RANS approach considering the fluid Newtonian and the flow incompressible was used. A standard two-equation (k-ε) closure scheme was applied for turbulence solution [17] [18].
Figure 1. Geometry of the studied OT: dashed boxes indicate location and type of incoming/outflow section for each configuration
Table 2 provides all the different symbols used in the generic eq.(1) applied for each governing equation. Values of physical properties used for materials and objects are listed in Table 3. Independently from the specific ventilation scheme, at the inlet sections for air incoming into the system we applied as boundary conditions, a constant velocity for the OT (Table 1) and assumed 0.66 m/s for the corridor diffusers (6 ACH). Turbulence intensity at inlet was set equal to 5%. Values of the other first-type boundary conditions applied at the inlet sections are reported in Table 4. For breathing modelling, a sinusoidal trend for inhaled/expired air and for CO2 emission rate into the room was assumed. In steady state simulations, the corresponding root mean square (RMS) values was used as magnitude for air velocity and CO2 mass flow rate at the nostrils of the medical staff, patient and persons standing in the corridor. Table 5 provides the set of parameters used to simulate people presence, in terms of breathing, heat production, CO2 and CFU emission in the indoor environment. Outflow conditions were considered for all the dependent variables at the recovery grids.
Table 1. Ventilation air flow rate for each ventilation scheme
|
|
Rate of supply air |
Air velocity (diffuser) |
Air velocity (curtain) |
|
|
|
Diffuser |
Curtain |
[m/s] |
[m/s] |
|
V_1 |
80% |
20% |
0.60 |
2.02 |
|
V_2 |
100% |
0% |
0.74 |
0.00 |
Table 2. Formulation of variables and parameters in Eq. (1)
|
Equation |
$\phi$ |
$\Gamma$ |
$\Lambda$ |
|
Continuity |
1 |
0 |
0 |
|
Momentum |
$\mathbf{U}$ |
$\mu+\mu_{T}$ |
$-\nabla p+\mathbf{F}_{g}$ |
|
Energy |
$T$ |
$\lambda / c_{p}$ |
$\varrho / c_{p}$ |
|
Mean ae of air |
$\tau$ |
$\Upsilon$ |
$\rho$ |
|
CO2 |
$c o_{2}$ |
$\rho D_{C O_{2}}$ |
$\rho$ |
|
CFU |
$C F U$ |
$\rho D_{C F U}$ |
$\rho$ |
Table 3. Physical properties of materials in numerical models.
|
Material |
ρ |
h |
k |
Cp |
|
|
[kg/m3] |
[Pa s] |
[W/(m K)] |
[J/(kg K)] |
|
Glass |
2500 |
- |
1.00 |
800 |
|
Aluminium |
2700 |
- |
160 |
900 |
|
Person |
950 |
- |
0.62 |
4180 |
|
Air |
$p /(R T)$ |
2E-5 |
0.04 |
1004 |
Table 4. Values of variables at the inlet boundaries.
|
|
T |
CO2 |
t |
CFU |
|
|
[°C] |
[ppm] |
[s] |
[CFU/m3] |
|
OT |
18 |
335 |
0 |
0.5 |
|
Corridor |
24 |
450 |
0 |
250 |
Table 5. Parameters for human presence simulation.
|
|
Flow rate nostril |
CO2 emission |
Metabolic heat |
CFU |
|
|
[l/h] |
[l/h] |
[W] |
[CFU/s] |
|
Medical staff |
2000 |
80 |
131.9 |
3 |
|
Patient |
300 |
12 |
96.6 |
0 |
|
Other person |
500 |
20 |
112.3 |
6 |
At each solid/fluid interface, logarithmic wall functions were applied to the near wall airflow, that was considered parallel to the wall and being in a wall offset equal to one hundred viscous units. Turbulent production was assumed to equal dissipation at walls. For the remaining dependent variables impermeable/insulation conditions at solid walls were assumed.
A non-uniform and non-structured computational mesh made up of the second order tetrahedral elements was applied. Steady solutions of discrete equations were carried-out by applying an iterative dumped Newton-Raphson scheme [19] based on the discretized PDE linearization by a first-order Taylor expansion. Algebraic systems of equations coming from differential operator discretization were solved by a PARDISO package, a direct solver particularly efficient for solving unsymmetrical sparse matrixes by a LU decomposition method. The convergence criterion was set to 1E-5. Time integration of governing equations for transient simulations was performed by applying an Implicit Differential-Algebraic (IDA) solver which uses the variable
order and variable-step-size of Backward Differentiation Formulas (BDF). Because the time-marching scheme is implicit, a nonlinear system of equations must be solved at each time step. Newton algorithm was exploited to solve this nonlinear system of equations. All computations were carried-out on a workstation with two 64-bit 6-core/12-thread processors speeding up to 2.3 GHz of frequency and handling 128 GB of RAM.
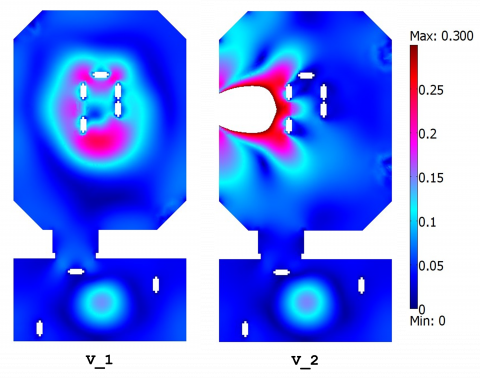
The air flow patterns obtained by simulations result strongly depend on the air supply and exhaust outlet grille location. In particular, the air velocity field (Figure 2) in the zone below the ceiling supply diffuser depends also on the air curtain: air velocity is more uniformly distributed at the BZ and OZ, in the PZ the velocity field provides the lowest air velocity at the surgical site with extreme limit values from 0.05 m/s to the maximum of 0.1 - 0.15 m/s. V_1 is defined by two symmetrical supply diffusers and their lateral air curtains: in the central zone (BZ and OZ) the velocity field is more uniform and inside the PZ and TV guarantees an effective air washing effect. V_2 scheme provides a specific air motion field: the air washing effect is connected to the horizontal air flow efficacy and then to the resulting air flow displacement. Analysing the two models results a basic effect can be noted due to the unidirectional air flow (both vertical and horizontal) for leading to a low turbulence downward air displacement in all the OT zones. Different location around the PZ of the air recovery grilles produces an exhaust air discharge through them and a piston effect, so that the air velocity at the centre of the room is always about 0.05 m/s. V_1 and V_2, show the disturbance effect to the air flow due to form, dimension and localization of surgical lamps and to the thermal plume around the surgical staff that does not intrude on the clean air near the patient. Unidirectional air flows combined with the high supply rate to the room, guarantee the coldest air penetration to the floor and the washing effect in BZ and OZ maintenance.
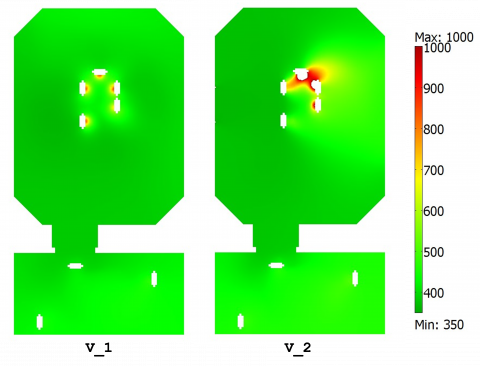
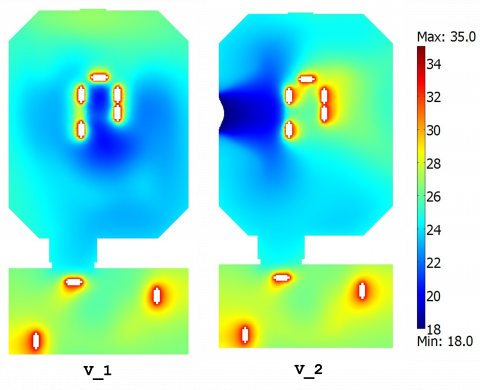
From simulation results microclimatic parameter assessment, CO2 concentration and the mean air age, were directly obtained. The air temperature distribution results of V_1 show compliance with thermal requirements at the operation table, especially in the BZ (Figure 3). The air curtain at the open sliding door produces a dragging out effect with short-circuit particularly when the air supply diffusers are not symmetrical in respect to the BZ and OZ but also when the sole ceiling supply diffuser, equipped with two lateral air curtains, is present and causes the air flow confinement with imposed vertical direction to the operation bed .Consequently, the air temperature distribution is not uniform, though temperature values of 22˚C - 24˚C at the operation table could be maintained. The unidirectional horizontal air flow of V_2, without the air curtain at the door, provides a good air temperature distribution in the BZ and OZ, but less thermal uniformity in the PZ and globally in TV. Temperature distribution in the PZ for V_2 is mostly affected by horizontal air flow displacement.
Figure 2. Air velocity field on a horizontal slide (z = 1.4 m)
Figure 3. CO2 concentration on a horizontal slide (z = 1.4 m)
Figure 4. Temperature field on a horizontal slide (z = 1.4 m)
Starting from simulation results on air temperature and velocity fields, CO2 and particle concentration expressed as CFU/m3 were investigated and some IAQ indexes, with regard to contaminant removal and infection risk control, were calculated. These indexes refer to the average values of dependent variables in the different zones of the OT (i.e. BZ, OZ, PZ and TV). At the beginning for the IAQ assessment, the mean age of air (τ), that quantifies the average lifetime of air at a particular location of the room for a steady airflow achieved was calculated as well as a dependent variable, as explained in the modelling section. Referring to Fig 5, a measure of air freshness due to different ventilation schemes can be deduced. At the inlet opening it was assumed to be zero (100% fresh).
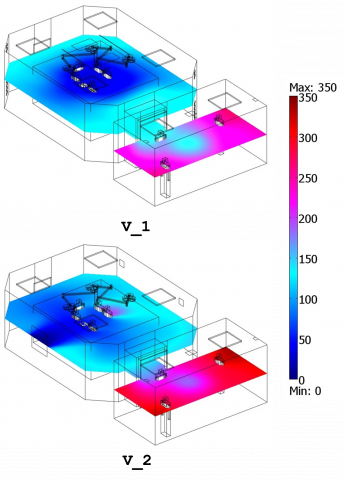
Figure 5. Mean age of air on a horizontal slide (z = 1.4 m)
The average value of τ was computed in the different zones and called as τZ, where Z j means the generic j-zone. Comparison of these values with the theoretical residence time of air inside the OT (defined as the ratio between the total volume of the room (VTV, m3) and the mass flow rate of incoming ventilating air (Vvent, m3/s)), shows that the ratio is always higher than 1. This comparison consists Air Change Efficiency (ACE) index evaluation. This index, which measures how effectively ventilation systems replace the air in a room with fresh air, is expressed as:
$A C E=\frac{\frac{V_{T V}}{V_{v e n t}}}{\tau_{Z j}} \cdot 100$ (2)
The Ventilation Effectiveness (VE) index that measures how quickly a contaminant is removed from an air volume by quantifying the efficiency with which the internal pollutant is diluted or removed was calculated. It depends on the air flow patterns, concentration field computed for CO2 and particles, and can be expressed as:
$V E=\frac{C_{E}-C_{S}}{C_{Z J}-C_{S}}$ (3)
CE is the mean value of contaminant concentration (i.e. CO2 and particles) calculated at the air-recovery grilles (Exhaust), CS is the contaminant concentration at the air inlet diffusers (Supply) and CZJ is the mean value of the contaminant concentration in a specific zone. Similarly, the Contaminant Removal Effectiveness (CRE) index representing the ratio between the concentration of contaminants at the exhaust point and the mean value of contaminant concentration within a specific zone, was calculated as:
$C R E=\frac{C_{E}}{C_{z J}}$ (4)
VE and CRE indexes were computed using CO2 and particle concentration results. Particle concentration value was assumed to be zero at the inlet air diffusers (CS=0) then, VE and CRE expressions correspond to each other. Referring to ACE index, the V_2 produces the results shown in Table 6. This ventilation models does not include the vertical air curtain located at the sliding door, but has the vertical air curtain located at the ceiling supply diffuser along only two sides, corresponding to the underlying sides of the bed. VE and CRE indexes compared to the mean age of air for the BZ and OZ, show better performances and efficacy of the modified ventilation system of V_1 and also for V_2. In particular, V_2 is characterized by a unidirectional horizontal air flow. This is the reason why the V_2 model provides the higher mean air age values for the BZ and OZ. Analysing PZ and TV, the situations inverts (Table 6): V_2 model provides similar results of the mean air age and the lowest ones among all the models. Diffusion Performance Index (ADPI) according to [20] was calculated. The ASHRAE Handbook of Fundamentals provides the basic definition of ADPI which statistically relates the space conditions of temperature and air velocity to occupant thermal comfort, underlining that high ADPI values are desirable as they represent a high comfort level mainly due to increased probability of good ventilation air mixing. Considering a chosen number of discrete points in the OT (146 locations for 1 < x < 5; 5 < y < 10 and 0.5 < z < 2.5) ADPI index was computed as the percentage of test points that meets the performance parameters provided by the combination between the Effective Draft Temperature (−1.5 K < EDT < 1.0 K) and air velocity (U < 0.35 m/s). The EDT is defined as
$E D T=\left(T-T_{s e t}\right)-8 \cdot(U-0.15)$ (5)
Table 6. The IAQ indexes for the OT zones and for each ventilation schemeWhen the effective draft temperature is between −1.5 K and +1.0 K and the air velocity less than 0.35 m/s, a high percentage of people feel comfortable. Results comparison shows that V_2 model guarantees the best thermal comfort conditions, because their results involve a lower comfort conditions for all the considered OT zones. V_2 gives also the higher ADPI index value. The ACE index results for V_1reache the highest values and even now comparable with that of V_2. Looking at the CFU concentration results for each OT considered zones, the V_1, model provides the lower values, but V_2 ventilation scheme from this point of view, is the best for BZ, OZ, PZ and then TV.
|
Breathing zone (BZ) volume 14.29 m3 |
V_1 |
V_2 |
|
VE |
0.91 |
0.76 |
|
CRE |
0.99 |
0.95 |
|
t |
56.80 |
95.24 |
|
PMV |
1.34 |
-0.60 |
|
PPD (%) |
42.4 |
12.6 |
|
CFU/m3 |
22.19 |
20.65 |
|
Occupied zone (OZ) volume 24.49 m3 |
V_1 |
V_2 |
|
VE |
0.82 |
0.99 |
|
CRE |
0.97 |
1.00 |
|
t |
64.53 |
107.56 |
|
PMV |
1.54 |
-0.49 |
|
PPD (%) |
52.8 |
9.9 |
|
CFU/m3 |
23.64 |
16.93 |
|
Peripheral zone (PZ) volume 98.83 m3 |
V_1 |
V_2 |
|
VE |
1.34 |
1.97 |
|
CRE |
1.03 |
1.08 |
|
t |
109.58 |
105.69 |
|
PMV |
1.33 |
-0.64 |
|
PPD (%) |
41.9 |
13.5 |
|
CFU/m3 |
18.72 |
10.84 |
|
Total Volume (TV) volume 118.52 m3 |
V_1 |
V_2 |
|
VE |
1.18 |
1.63 |
|
CRE |
1.02 |
1.06 |
|
t |
100.08 |
105.90 |
|
PMV |
1.30 |
-0.67 |
|
PPD (%) |
40.5 |
14.4 |
|
CFU/m3 |
19.70 |
12.08 |
|
ACE |
0.72 |
0.68 |
|
ADPI (%) - 1.5 K < EDT < + 1 K |
38 |
21 |
Results obtained from CFD transient simulation applied to the two ventilation schemes studied are consistent with experimental data of recent literature [3] [21] [22]. As a matter of fact, efficiency and efficacy of the unidirectional vertical air flow, improved with the air curtains application, are in good compliance with those reported in the recent literature [21] [23]. Our proposed ventilation schemes, equipped by unidirectional vertical downward air flow, comply with those pointed out by some important researches on this argument that demonstrate as this kind of ventilation system provides an ultra-clean environment and the better comfort conditions for all the OT zones [24] [1]. Therefore, our investigation shows that the horizontal air flow system, can be an important alternative to the vertical one in the OT only if the supply and return diffusers are located on the opposite site of the same lateral wall and their position is chosen taking into account the location and height of the operating table, medical equipments, instruments tables and other obstructions, compared with the distance of the plenum and air inlet grilles: this result has been widely demonstrated by some authors with important findings [3] [25] [22] concerning the most significant decrease of post-operative infection obtained with this ventilation solution. Comparison with recent researches on the ultra-clean ventilation system performance against airborne infection in a real standard OT [26] confirm our results validity. Implications of our findings highlight that ventilation scheme model closer to the center of the room and larger surface of the air supply diffusers connected with the position of the return grilles, the better the air flow performance is, when provided both by unidirectional
vertical and horizontal air flows, especially if the use of air curtains mainly located at the ceiling is considered. High surface of the air supply diffusers combined with air curtains location to control the (both unidirectional vertical and horizontal) air flow direction and correct air recovery grille location, was identified as one of the most important factors in reducing short circuits between inlet and outlet air flows, guaranteeing the efficacy and efficiency of the ventilation system, in minimizing the thermal stratification effect, reducing contaminant concentration in the breathing and occupied/operating zone of the OT and also governing the dispersion of airborne infectious particles.
The authors thank Prof. Pietro Vitali (Hospital Hygiene Unit, University Hospital of Parma), Prof. Cesira Pasquarella (Department of Biomedical, Biotechnological and Translational Sciences, University of Parma), Prof. Roberto Albertini (Department of Clinical and Experimental Medicine, Unit of Medical Immunology, University Hospital of Parma) for their important support to the present research.
|
Symbol |
||
|
Cp |
[J/(kg K)] |
Specific heat at constant pressure |
|
CO2 |
[ppm] |
Carbon dioxide concentration |
|
CFU |
[-] |
Colony Forming Unit |
|
H |
[J/kg] |
Enthalpy |
|
K |
[W/(m K)] |
Thermal conductivity |
|
P |
[Pa] |
Pressure |
|
U |
[m/s] |
Velocity magnitude |
|
T |
[s] |
Time |
|
T |
[K] |
Temperature |
|
Greek symbols |
||
|
h |
[Pa s] |
Dynamic viscosity |
|
r |
[kg/m3] |
Density |
|
t |
[s] |
Mean age of air |
1. Chow T.T. Yang X.Y., “Performance of ventilationsystem in a non-standard operating room,” Building and Environment, 38 (2003) 1401-1411.
2. Méndez, C., San José, J.F., Villafruela, J.M., Castro, F., “Optimization of a hospital room by means of CFD for more efficient ventilation,” Energy and Buildings, 40 (2008) 849-854. DOI: 10.1016/j.enbuild.2007.06.003.
3. Pfost, J.F., “A re-evaluation of laminar air flow in hospital operating rooms,” ASHRAE Transactions, 87 (1981) 729-739.
4. Villafruela, J.M., Castro, F., San José, J.F., Saint-Martin, J., “Comparison of air change efficiency, contaminant removal effectiveness and infection risk as IAQ indices in isolation rooms,” Energy and Buildings, 57 (2013) 210-219. DOI: 10.1016/j.enbuild.2012.10.053.
5. Dong, S.Y., Tu, G.B., Cao, R.G., Yu, Z.F., “Numerical study on effects of door-opening on airflow patterns and dynamic cross-contamination in an ISO Class 5 operating room,” Transactions of Tianjin University, 15 (2009) 210-215. DOI: 10.1007/s12209-009-0037-y.
6. Brohus, H., Balling, K.D., Jeppesen, D., “Influence of movements on contaminant transport in an operating room,” Indoor Air, 16 (2006) 356-372. DOI: 10.1111/j.1600-0668.2006.00454.x.
7. Balocco C., Petrone G., Cammarata G., “Numerical investigation of different airflow schemes in a real Operating Theatre,” Int. Journal Biomedical Science and Engineering (JBiSE), 8: (2015) 73-89. DOI: 10.4236/jbise.2015.82008.
8. Loomans, M.G.L.C., van Houdt, W., Lemaire, A.D., Hensen, J.L.M., “Performance assessment of an operating theatre design using CFD simulation and tracer gas measurements,” Indoor and Built Environment, 17 (2008) 299-312. DOI: 10.1177/1420326X08094948.
9. Yam, R., Yuen, P.L., Yung, R., Choy, T., Rethinking Hospital General Ward Ventilation Design Using (2011).
10. Balocco, C., Petrone, G., Cammarata, G., Vitali, P., Albertini, R., Pasquarella, C.I., “Experimental and numerical investigation on airflow and climate in a real operating theatre under effective use conditions,” International Journal of Ventilation, Vol 13 (4): (2015) 351-368.
11. Chen, Y.G., “Parametric evaluation of refrigerated air curtains for thermal insulation,” International Journal of Thermal Sciences, 48 (2009) 1988-1996. DOI: 10.1016/j.ijthermalsci.2009.03.003.
12. Zhai, Z.Q., Osborne A., “Simulation-based feasibility study of improved air conditioning systems for hospital operating room,” Frontiers of Architectural Research, 2 (2013) 468-475. DOI: 10.1016/j.foar.2013.09.003.
13. ANSI/ASHRAE - 170 (2008), Ventilation of Health Care Facilities. ASHRAE Standards Committee, the ASHRAE Board of Directors, and the American National Standards Institute, USA.
14. UNI-11425 (2011), Surgery Operating Theatre, Ventilation and Air-Conditioning System for Contamination Control (VCCC) Design, Construction, Commissioning, Qualification, Management and Maintenance. Italy. (In Italian)
15. ISPESL (2009), Department of Occupational Hygiene, Guidelines for the Definition of Safety Standards and Environmental Health Departments Operators. (In Italian)
16. COMSOL (2012), Multiphysics User’s Guide, v.4.3. Comsol Inc.
17. Ignat, L., Pelletier, D., Ilinca, F.A., “Universal formulation of two-equation models for adaptive computation of turbulent flows,” Computer Methods in Applied Mechanics and Engineering, 189 (2000) 1119-1139. DOI: 10.1016/S0045-7825(99)00370-9.
18. Launder, B.E., Spalding, D.B., “The numerical computation of turbulent flows,” Computer Methods in Applied Mechanics and Engineering, 3 (1974) 269-289.
19. Deuflhard, P.A., “Modified newton method for the solution of ill-conditioned systems of nonlinear equations with application to multiple shooting,” Numerische Mathematik, 22 (1974) 289-315. DOI: 10.1016/0045-7825(74)90029-2.
20. ANSI ASHRAE Standard - 55 (2013), Thermal Environmental Conditions for Human Occupancy, ASHRAE Standards Committee, the ASHRAE Board of Directors, and the American National Standards Institute, USA.
21. Ho, S.H., Rosario, L., Rahman, M.M., “Three-dimensional analysis for hospital operating room thermal comfort and contaminant removal,” Applied Thermal Engineering, 29 (2009) 2080-2092. DOI: 10.1016/j.applthermaleng.2008.10.016.
22. Liu, J.J., Wang, H.D., Wen, W.Y., “Numerical simulation on a horizontal airflow for airborne particles control in hospital operating room,” Building and Environment, 44 (2009) 2284-2289. DOI: 10.1016/j.buildenv.2009.03.019.
23. Chow, T.T., Yang, X.Y., “Ventilation performance in operating theatres against airborne infection: review of research activities and practical guidance,” Journal of Hospital Infection, 56 (2004) 85-92. DOI: 10.1016/j.jhin.2003.09.020.
24. Zoon, W.A.C., Loomans, M.G.L.C., J.L.M., “Testing the effectiveness of operating room ventilation with regard to removal of airborne bacteria,” Building and Environment, 46 (2011) 2570-2577. DOI: 10.1016/j.buildenv.2011.06.015.
25. Karthikeyan, C.P., Samuel, A.A., “CO2-dispersion studies in an operation theatre under transient conditions,” Energy and Buildings, 40 (2008) 231-239. DOI: 10.1016/j.enbuild.2007.02.023.
26. Chow, T.T., Yang, X.Y., “Ventilation performance in operating theatres against airborne infection: numerical study on an ultra-clean system,” Journal of Hospital Infection, 59 (2005) 138-147. DOI: 10.1016/j.jhin.2004.09.006.