Easter Joseph*![]() | Balbir S. M. Singh
| Balbir S. M. Singh![]() | Dennis Ling Chuan Ching
| Dennis Ling Chuan Ching![]()
© 2023 IIETA. This article is published by IIETA and is licensed under the CC BY 4.0 license (http://creativecommons.org/licenses/by/4.0/).
OPEN ACCESS
With the escalating demand for energy and the concomitant depletion of fossil fuel reserves, solar energy has emerged as a sustainable alternative, offering both energy conservation and power-saving benefits. The optimization of photovoltaic (PV) system performance through vigilant monitoring is essential for maximizing energy production. This study aims to devise a novel algorithm that derives from photocurrent measurements at the string level, alongside the aggregate current output of the PV array. Simulations of a PV string/array were executed using MATLAB/Simulink to discern the effects of solar irradiance and temperature fluctuations on current parameters. A representative model comprising two commercial PV modules arranged in series was employed to construct a four-string PV array for analysis. Findings indicate that photocurrent and overall current output are significantly influenced by solar irradiance, whereas increases in saturation and reverse saturation currents with temperature correspond to diminished current output. A rudimentary fault detection algorithm emerged from the simulation data, facilitating the identification of faults by juxtaposing the current from a PV string against a benchmark PV cell. Prompt detection and amelioration of faults—particularly those within groups two and three, which are characterized by 10 – 40% and greater than 40% reductions in current, respectively, and commonly associated with shading, soiling, and hotspots—are imperative for averting substantial energy yield losses and prolonging system longevity. It is crucial to acknowledge that daily variations in weather conditions may affect the algorithm's efficacy, underscoring the need for ongoing refinement.
PV string, PV array, Simulink, algorithm, fault detection
The burgeoning global energy demand, a burgeoning population, and the finite nature of non-renewable resources have rendered renewable energy sources imperative to future energy strategies. Solar energy, distinguished by its ubiquity, scalability, environmental stewardship, and economic viability, stands at the forefront of sustainable solutions designed to meet this burgeoning demand. Solar photovoltaic (PV) technology has witnessed substantial advancements, as evidenced by the proliferation of both grid-connected and off-grid installations [1, 2]. Of particular note are off-grid PV systems, which are autonomous in generating electricity at a smaller scale through solar panels and storing it in batteries. These systems are especially beneficial in remote areas, where they represent a more cost-effective option than extending the electrical grid.
Standalone electricity generating systems (SEGS) necessitate meticulous monitoring and routine self-assessments to ensure they operate at optimal efficiency. Electricity generation in these systems is contingent upon a multitude of factors including, but not limited to, solar irradiance, temperature, shading, accumulation of debris, and the physical orientation of the modules [2]. These elements can precipitate the degradation of PV module performance over time, thus impacting the return on investment. More critically, they can cause faults that result in heightened energy losses, expedited component wear, diminished efficiency, and elevate safety hazards [3]. These faults often elude detection, potentially culminating in considerable economic losses. To mitigate these deleterious effects, regular PV system inspections are indispensable for maintaining optimal functionality. Moreover, the deployment of monitoring and diagnostic systems is instrumental in the expedient identification and rectification of faults, thereby minimizing repair time and system downtime. Consequently, accurate energy prediction in standalone PV systems is paramount for the formulation of algorithms that facilitate fault detection [4].
Technological advancements have refined the precision of energy predictions for PV systems through the adoption of new monitoring and diagnostic tools. Despite rapid improvements in the field, the integration of advanced surveillance systems within the context of small-scale SEGS is neither practical nor cost-effective [5]. Current market offerings, such as supervisory control and data acquisition (SCADA) systems, DT-80 Data takers, Seaward solar data loggers, and Laboratory Virtual Instrument Engineering Workbench (LabVIEW) data acquisition software, are characterized by their complexity and adaptability to grid-connected PV systems, rendering them unsuitable for small-scale standalone applications. Advanced systems might leverage artificial intelligence (AI) and machine learning algorithms to discern patterns in data and predict potential faults. These systems can also enhance system performance by tailoring settings in response to the analyzed data.
Fault detection methodologies for PV systems are broadly categorized into process history-based and model-based approaches. The current investigation concentrates on model-based approaches, which juxtapose analytically derived outputs with actual measurements to trigger alarm signals [6]. Tina et al. proffered a fault detection technique that assesses the absolute performance ratio error (APRE) against a predetermined threshold to generate diagnostic alerts. Furthermore, the DC-AC power ratio has been employed as a metric to ascertain inverter failures [7]. Dhoke et al. advocated the generation of 'residual' signals to automatically detect and pinpoint intra-string line-line faults in expansive PV systems. The residual-based outlier detection relies on predefined thresholds; anomalies that transgress these boundaries are indicative of faults. The fault location algorithm employs regression-based expressions to estimate the fault's locus within the string [8]. Other studies have implemented automatic monitoring and fault detection predicated on power loss analyses, comparing monitored data with simulation outcomes to flag discrepancies [9]. Additional research has focused on fault detection at the module or array level, with each PV module or array outfitted with local sensors to track parameters such as temperature, irradiance, maximum power point (MPPT), or energy generation [10]. Data from these measurements are then contrasted with predicted values to ascertain faults [11, 12].
Despite these scholarly contributions, the implementation of monitoring and diagnostic systems in small-scale PV plants remains underexplored. The preponderance of research has concentrated on grid-connected and large-scale PV installations. Hence, the objective of this paper is to develop a straightforward algorithm predicated on photocurrent values at the PV string level and the overall current output of the PV array. This algorithm is specifically tailored for integration into small-scale PV systems, offering significant advantages for systems situated in isolated locales.
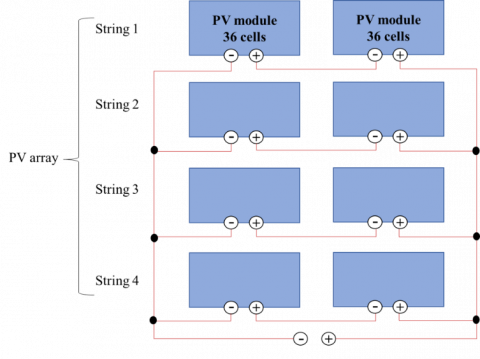
The simulation involved connecting two commercial PV modules in series, with each module containing 36 cells, and then connecting four of these strings in parallel to create an array, as illustrated in the accompanying Figure 1. The equivalent circuit of a PV cell obtained in study [13] is comprised of a photo-current source (Iph) in parallel with a single diode (D), a shunt resistor (Rsh) and a series resistor (Rs).
The photovoltaic panel can be modelled mathematically as given in Eqs. (1)-(5) [13].
Module photocurrent, Iph:
$I_{p h}=\left[I_{s c}+k_i(T-298)\right] \frac{G}{1000}$ (1)
Figure 1. An array made up of 4 strings
The Iph is linearly dependent on the solar irradiation, G, and temperature, T.
Module diode reverse saturation current, Irs:
$I_{r s}=\frac{I_{o u t}}{\left[ e^{\left(\frac{q V_{o c}}{n N_s K T}\right)-1}\right]}$ (2)
Module saturation current, I0:
$I_0=I_{r s}\left(\frac{T}{T_n}\right)^3 \exp \left[\frac{q E_g\left(\frac{1}{T_n}-\frac{1}{T}\right)}{n K}\right]$ (3)
Module I0 varies in direct proportion to the cell temperature.
Module shunt resistance, Ish:
$I_{s h}=\left(\frac{V+I R_s}{R_{s h}}\right)$ (4)
Rsh is the equivalent parallel resistance that is caused by the current leakages, tunnel effect, breakdown by microplasmas, leaks along surface channels, etc. Normally, the value of Rshis generally high meanwhile Rs is very small. The Voc and fill factor will reduce when the Rsh is particularly small.
Module output current, Iout is given in Eq. (5) where ID is the forward bias current generated by the diode.
$\begin{gathered}I_{\text {out }}=I_{\text {ph }}-I_D-I_{\text {sh }} \\ I_{\text {out }}=N_p I_{\text {ph }}-N_p I_0\left[exp^{\left(\frac{q\left(V+R_s\right)}{n K N_S T}\right)}-1\right]-I_{s h}\end{gathered}$ (5)
Table 1. Details of mathematical symbols
|
Symbol |
Name |
Value |
|
ki |
Short-circuit current of a cell |
0.0032 |
|
T |
Operating temperature (K) |
T |
|
Tn |
Nominal temperature (K) |
298 |
|
G |
Solar irradiance (W/m2) |
1000 |
|
q |
Electron charge (C) |
1.6 × 10⁻¹⁹ |
|
n |
The ideality factor of the diode |
1.3 |
|
K |
Boltzmann’s constant (J/K) |
1.38 × 10⁻²³ |
|
Eg |
Band gap of semiconductor (eV) |
1.1 |
|
Rs |
Series resistance (Ω) |
0.1 |
|
Rsh |
Shunt resistance (Ω) |
500 |
Table 2. Electrical characteristics data of reference PV module
|
Symbol |
Name |
Value |
|
Isc |
Short circuit current (A) |
8.21 |
|
Voc |
Open circuit voltage (V) |
43.92 |
|
Vmax |
Voltage at max power (V) |
39.58 |
|
Imax |
Current at max power (A) |
7.58 |
|
Pmax |
Rated power (W) |
300 |
|
Ns |
Number of cells connected in series |
72 cells |
|
Np |
Number of PV modules connected in parallel |
4 |
The descriptions of each mathematical symbol are depicted in Table 1 while the datasheets of the reference PV module for this simulation are given in Table 2.
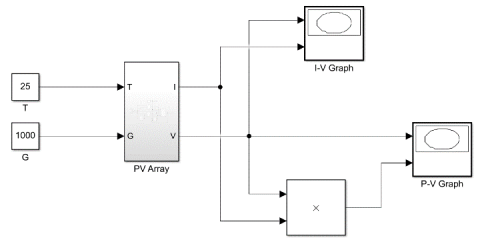
The PV datasheet values are derived at STC (Standard Test Conditions) which represents irradiance at 1000 W/m2, module temperature at 25℃, wind speed of 0 m/s, air mass (AM 1.5), and light incidence angle at 0°. Using all the mathematical equations mentioned above, five (5) subsystems were created to calculate Iph, I0, Ish, Irs, and Iout. All the subsystems are interconnected to produce a PV array model as illustrated in Figure 2. This paper focuses on three stages to develop a simple fault detection algorithm as displayed in Table 3.
Figure 2. PV array model
Table 3. Three stages of developing a simple fault detection algorithm
|
Stages |
Descriptions |
|
1) Photocurrent at the string level |
Variation of
|
|
2) Saturation and reverse saturation current at the string level |
|
|
3) Current output at the array level |
Variation of
|
Table 4. Values of photocurrent and output current at different solar radiation and temperature levels
|
No. |
Solar Radiation (W/m2) |
String (Series) |
Array (Parallel) |
||||
|
Iph (A) |
Iout (A) |
||||||
|
25℃ |
30℃ |
40℃ |
25℃ |
30℃ |
40℃ |
||
|
1 |
1000 |
8.21 |
8.37 |
8.69 |
32.39 |
32.65 |
32.04 |
|
2 |
700 |
5.75 |
5.86 |
6.08 |
22.66 |
22.86 |
22.45 |
|
3 |
500 |
4.11 |
4.19 |
4.35 |
16.16 |
16.29 |
15.92 |
|
4 |
200 |
2.05 |
2.09 |
2.17 |
8.01 |
8.03 |
7.62 |
|
5 |
100 |
0.82 |
0.84 |
0.87 |
3.11 |
3.06 |
2.59 |
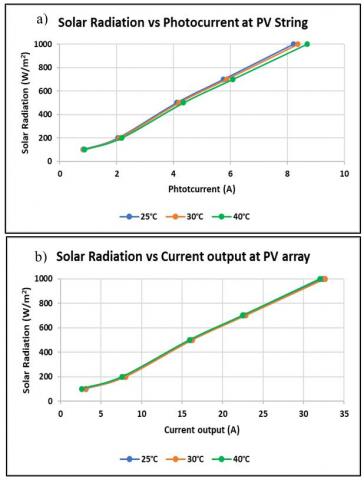
A simple algorithm for PV fault detection is developed based on the results of MATLAB/Simulink at three different stages. The first stage of the study involved varying solar radiation and temperature to observe their impact on Iph, at the string level and Iout of the PV array. The temperature of the PV module increases with solar radiation and air temperature. According to a previous study on hot spotting, the temperature of the shaded cell can reach up to 10 – 20℃ higher than the neighboring cells under even illumination conditions. Thus, the module temperature varied from 25℃ at STC value to 30℃ and 40℃ are to consider the possibility of hot spots. The results in Table 4 and Figure 3 showed that Iph values decreased as solar radiation decreased for all temperature levels. In contrast, the temperature had minimal effect on Iph. Similar results were obtained for Iout, although its values dropped slightly as the temperature approached 40℃ for all solar radiation levels.
Figure 3. Graphs of a) solar radiation versus photocurrent and b) solar radiation versus current output at three different temperatures
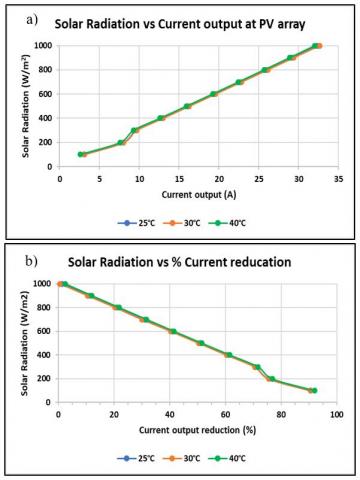
Figure 4. Graphs of a) solar radiation versus current output and b) solar radiation versus percentage current reduction at three different temperatures
The second stage of the study focused on the temperature dependence of Irs and I0, which is the reason for the decrement of Iout. To verify this, the temperatures were varied from 25℃ to 50℃ while maintaining the solar radiation level at 1000 W/m2 as displayed in Table 5. The table result exposes that both current parameters gradually increased with the temperature which mainly contributes to the high internal carrier recombination in the PV cell [14, 15]. Fundamentally, Iout relies on the values of Iph, I0, and Irsas given in Eq. (5).
The third stage presented the percentage of Iout reduction at the array level for different solar radiation and temperature values as indicated in Table 6 and Figure 4. Despite the working conditions at the STC values, there is about a 1.38% of Iout reduction in the PV array as a result of heat loss and internal recombination. Based on study [15], the data table can be categorized into three groups according to the value of percentage Iout reduction. The first group is for the percentage Iout reduction that is less than 10% which reflects about 900 – 1000 W/m2 solar radiation. The second group is when the percentage Iout reduction is approximately 10% to 40% which refers to around 500 – 900 W/m2 Solar radiation. The third group corresponds to the percentage Iout reduction of more than 40% that falls under less than 500 W/m2 solar radiation.
Table 5. Values of diode reverse saturation current and saturation at different temperature values
|
No. |
Solar Radiation (1000 W/m2) |
||
|
Temperature (°C) |
Irs (A) |
I0 (A) |
|
|
1 |
25 |
9.58 × 10⁻⁸ |
9.68 × 10⁻⁸ |
|
2 |
30 |
1.30 × 10⁻⁷ |
2.37 × 10⁻⁷ |
|
3 |
40 |
2.32 × 10⁻⁷ |
1.30 × 10⁻⁶ |
|
4 |
50 |
3.97 × 10⁻⁷ |
6.47 × 10⁻⁶ |
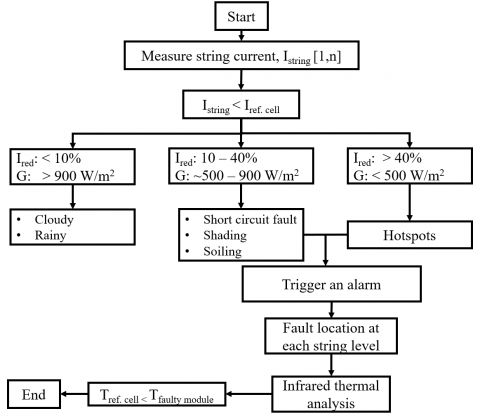
Based on this framework, crucial information can be extracted to develop a simple algorithm for fault detection as portrayed in Figure 5. The diagram illustrates the data analysis process, which incorporates both electrical and thermal methods to detect the malfunction in the PV system. The electrical method is based on I-V characteristic analysis, which involves comparing actual electrical parameters with expected values derived from graphs. In this paper, two main scenarios will be considered, where the current at the string level is compared between the reference and the faulty conditions. Both scenarios will be executed under actual working conditions. The current from each string will be used for evaluation, as it is easier to check and compare with the reference PV cell, given that the strings are connected in series. Thus, the program will assess the string current and if the Istring is lower than Iref. cell for any particular strings, it will prompt the program to estimate the percentage of current reduction between the two currents. The program will analyze and match the percentage of current reduction to the three main groups which can be categorized as <10%, between 10% to 40%, and more than 40% of current reduction. If it falls under less than 10%, the program will instruct the system to repeat the steps from the beginning and perform the analysis again. Since the current drop is small, the slight difference is considered mainly caused by clouds and rain [16]. However, if the percentage current reduction is more than 10%, an alarm signal will be triggered, indicating that a fault has been detected. The source of faults has been determined based on the extent of the percentage of current reduction.
The next step is to locate the fault in the PV string. In this case, infrared thermal analysis will be used to scan the corresponding faulty PV string. Infrared thermal analysis is one of the techniques for quickly detecting hotspots. It can reflect the characteristics of different working conditions due to temperature differences. When the PV cells operate under faulty conditions compared to normal working PV cells, it will display two different infrared images of the PV cells’ surface temperature. On the other hand, if the PV modules operate as usual, the measured data can be stored to develop long-term diagnostic analysis.
Three main faults that could affect the performance of the PV system have been identified, namely soiling, shading, and hotspots. In the case of series-connected PV modules, non-uniform solar radiation critically affects performance. Soiling and shading are the main causes of PV panels absorbing a non-uniform amount of solar radiation, leading to a serious problem known as hotspots. For instance, during partial or full shading, when the diode current, ID flows in a reverse direction, a large fraction of power is consumed due to high resistance in the diode, thereby reducing the current flow and increasing the module temperature. In a situation where there is a high difference in illumination levels between cells, it can potentially damage the diode of a PV cell. Additionally, the voltage can reach more than -20 V during the reverse-biased condition. Hotspots occur when the fully shaded module overheats due to a large variation in the current generated between modules, which may disrupt the entire system [17, 18]. Instead of generating power, the hotspots cause the shaded cells to consume power from other non-shaded cells, leading to an increase in temperature. Therefore, preventing the hot spots by detecting when and where they occur in the PV module is crucial to reduce degradation over the PV system’s lifetime.
Table 6. Percentage of current output reduction at different solar radiation and temperature levels
|
No. |
Solar Radiation (W/m2) |
Array (Parallel) |
|||||
|
Iout (A) |
|||||||
|
25℃ |
% Iout Reduction |
30℃ |
% Iout Reduction |
40℃ |
% Iout Reduction |
||
|
1 |
1000 |
32.39 |
1.38 |
32.65 |
0.58 |
32.04 |
2.44 |
|
2 |
900 |
29.15 |
11.24 |
29.4 |
10.48 |
28.88 |
12.06 |
|
3 |
800 |
25.91 |
21.10 |
26.13 |
20.43 |
25.68 |
21.80 |
|
4 |
700 |
22.66 |
31.00 |
22.86 |
30.00 |
22.45 |
31.64 |
|
5 |
600 |
19.41 |
40.90 |
19.58 |
40.38 |
19.20 |
41.53 |
|
6 |
500 |
16.16 |
50.79 |
16.29 |
50.40 |
15.92 |
51.52 |
|
7 |
400 |
12.90 |
60.72 |
12.99 |
60.44 |
12.61 |
61.60 |
|
8 |
300 |
9.64 |
70.64 |
9.68 |
70.52 |
9.29 |
71.71 |
|
9 |
200 |
8.01 |
75.64 |
8.03 |
75.55 |
7.62 |
76.80 |
|
10 |
100 |
3.11 |
90.53 |
3.06 |
90.68 |
2.59 |
92.11 |
Figure 5. General algorithm for early fault detection
The study aimed to create a simple algorithm based on MATLAB/Simulink simulations to detect faults in a PV array. Subsystem blocks were developed to design a user-friendly PV array model with practical icons and dialogs to produce a meaningful outcome. The model was used to observe photocurrent values at the PV string and the PV system’s current output. Both parameters were highly sensitive to variations in solar radiation. Furthermore, the findings showed that saturation and reverse saturation currents escalate with the temperature, leading to a reduction in current output. This adverse impact on power generation indicates the importance of PV monitoring and early fault detection. The percentage reduction in current output was categorized into three groups, and a fault detection algorithm was developed based on these categories. The detection and mitigation of faults become particularly important for group two (10 – 40% current reduction) and group three (> 40% current reduction), which encompass shading, soiling, and hotspot phenomena to prevent substantial energy losses. In future work, this algorithm will be incorporated into a customized PV monitoring system and will be tested vigorously under real working conditions. A data logger will be used to validate the electrical data collected from the PV modules and further improvements are required, taking into consideration factors such as weather conditions and obstruction in the forms of buildings, trees, and motor vehicles.
This work is supported by the Yayasan Universiti Teknologi PETRONAS (YUTP) (015LC0-294).
[1] Tazay, A.F., Hazza, G.A.W., Zerkaoui, S., AlGhamdi, S.A. (2022). Optimal design and techno-economic analysis of a hybrid solar-wind power resource: A case study at Al Baha University, KSA. International Journal of Energy Production and Management, 5(4): 13-34. https://doi.org/10.2495/eq-v7-n1-13-34
[2] Rodriguez-Ubinas, E., Barbosa, J.D., Derakhtenjani, A.S. (2022). Evaluation of energy flexibility potential of a typical thermal zone in Dubai. International Journal of Energy Production and Management, 7(3): 265-275. https://doi.org/10.2495/eq-v7-n3-265-275
[3] Hasan, K., Yousuf, S.B., Tushar, M.S. H.K., Das, B.K., Das, P., Islam, M.S. (2021). Effects of different environmental and operational factors on the PV performance: A comprehensive review. Energy Science & Engineering, 10: 656-675. https://doi.org/10.1002/ese3.1043
[4] Fouad, M.M., Shihata, L.A., Morgan, E.I. (2017). An integrated review of factors influencing the performance of photovoltaic panels. Renewable and Sustainable Energy Reviews, 80: 1499-1511. https://doi.org/10.1016/j.rser.2017.05.141
[5] Rahman, M.M., Selvaraj, J., Rahim, N.A., Hasanuzzaman, M. (2018). Global modern monitoring systems for PV based power generation: A review. Renewable and Sustainable Energy Reviews, 82: 4142-4158. https://doi.org/10.1016/j.rser.2017.10.111
[6] Drews, A., de Keizer, A.C., Beyer, H.G., et al. (2007). Monitoring and remote failure detection of grid-connected PV systems based on satellite observations. Solar Energy, 81(4): 548-564. https://doi.org/10.1016/j.solener.2006.06.019
[7] Harrou, F., Nounou, M.N., Nounou, H.N., Madakyaru, M. (2015). PLS-based EWMA fault detection strategy for process monitoring. Journal of Loss Prevention in the Process Industries, 36: 108-119. https://doi.org/10.1016/j.jlp.2015.05.017
[8] Chine, W., Mellit, A., Pavan, A.M., Kalogirou, S.A. (2014). Fault detection method for grid-connected photovoltaic plants. Renewable Energy, 66: 99-110. https://doi.org/10.1016/j.renene.2013.11.073
[9] Dhoke, A., Sharma, R., Saha, T. (2019). An approach for fault detection and location in solar PV systems. Solar Energy, 194: 197-208. https://doi.org/10.1016/j.solener.2019.10.052
[10] Davarifar, M., Rabhi, A., El-Hajjaji, A., Dahmane, M. (2013). Real-time model base fault diagnosis of PV panels using statistical signal processing. In 2013 International Conference on Renewable Energy Research and Applications (ICRERA), Madrid, Spain, pp. 599-604. https://doi.org/10.1109/ICRERA.2013.6749826
[11] Mahmmoud, O.N., Gaeid, K.S., Nashi, A.F., Siddiqui, K.M. (2020). Induction motor speed control with solar cell using MPPT algorithm by incremental conductance method. Tikrit Journal of Engineering Sciences, 27: 8-16. https://doi.org/10.25130/tjes.27.3.02
[12] Ali, M.H., Rabhi, A., El Hajjaji, A.E., Tina, G.M. (2017). Real time fault detection in photovoltaic systems. Energy Procedia, 111: 914-923. https://doi.org/10.1016/j.egypro.2017.03.254
[13] Sun, X., Chavali, R.V.K., Alam, M.A. (2018). Real-time monitoring and diagnosis of photovoltaic system degradation only using maximum power point—The Suns-Vmp method. Progress in Photovoltaics: Research and Applications, 27: 55-66. https://doi.org/10.1002/pip.3043
[14] Ahmad Hamdi, R.T. (2017). Solar cell system simulation using Matlab-Simulink. Kurdistan Journal of Applied Research, 2(1): 45-51. https://doi.org/10.24017/science.2017.1.5
[15] Dhass, A.D., Prakash, Y., Ramya, K.C. (2020). Effect of temperature on internal parameters of solar cell. Materials Today: Proceedings, 33: 732-735. https://doi.org/10.1016/j.matpr.2020.06.079
[16] Xu, X., Wang, H., Xu, X., Zuo, Y. (2011). Method for diagnosing photovoltaic array fault in solar photovoltaic system. In 2011 Asia-Pacific Power and Energy Engineering Conference, Wuhan, China, pp. 1-5. https://doi.org/10.1109/APPEEC.2011.5747701
[17] Pandiarajan, N., Ramaprabha, R., Muthu, R. (2012). Application of circuit model for photovoltaic energy conversion system. International Journal of Photoenergy, 1-14. https://doi.org/10.1155/2012/410401
[18] Shanmugasundaram, E.C., Ragu, S., Jayarajan, R., Madhusudhanan, R.M., Murugesan, S. (2022). Analysis of partial shading of PV modules. In AIP Conference Proceedings, Chennai, India, 2455(1): 030001. https://doi.org/10.1063/5.0100866