Reem Al-Hadeethi![]() | Wisam S. Hacham*
| Wisam S. Hacham*![]()
© 2023 IIETA. This article is published by IIETA and is licensed under the CC BY 4.0 license (http://creativecommons.org/licenses/by/4.0/).
OPEN ACCESS
University campuses in Iraq are substantial energy consumers, with consumption increasing significantly during periods of high temperatures, underscoring the necessity to enhance their energy performance. Energy simulation tools offer valuable insights into evaluating and improving the energy efficiency of buildings. This study focuses on simulating passive architectural design for three selected buildings at Al-Khwarizmi College of Engineering (AKCOE) to examine the effectiveness of their cooling systems. DesignBuilder software was employed, and climatic data for a year in Baghdad was collected to assess the influence of passive architectural strategies on the thermal performance of the targeted buildings. The simulations revealed that the implementation of passive architectural design in AKCOE buildings led to a decrease in energy consumption for cooling purposes. Energy savings were achieved through natural ventilation, which minimized heat gain, and by employing continuous sun protection with double-glazed windows. By adopting a passive cooling strategy in AKCOE facilities, annual energy consumption for cooling within the campus could potentially be reduced by up to 23.6 percent. In conclusion, it was found that the current glazing system utilized in Iraqi building construction significantly contributes to electrical energy consumption.
DesignBuilder software,energy consumption, natural ventilation, passive design, thermal energy performance simulation
Iraq is among the world's leading carbon emitters [1], with various sectors including campuses, residential buildings, public and private buildings, firms, and agricultural and company buildings relying heavily on unclean energy sources. A significant proportion of this energy consumption originates from the combustion of fossil fuels, leading to considerable environmental pollution. Inefficient building construction methods exacerbate environmental degradation in Iraq [2, 3], which is further intensified by rapid urbanization due to population growth, desertification resulting from the conversion of green spaces into residential areas, and diminished water resources due to dam construction by neighboring countries on the Tigris and Euphrates rivers [4, 5]. In response to these challenges, the adoption of passive building design strategies in new Iraqi cities and the retrofitting of existing buildings to conserve energy have become imperative [6].
Passive energy strategies harness renewable resources, such as solar and wind energy, to satisfy the heating, cooling, and ventilation needs of buildings, thus obviating the requirement for mechanical HVAC systems. The implementation of passive energy strategies yields numerous advantages, including the minimization of temperature differences between indoor and outdoor spaces, the enhancement of indoor air quality through effective filtration, and the creation of a more comfortable building environment [2, 3]. Additionally, these strategies contribute to the reduction of energy consumption and greenhouse gas emissions, fostering a positive environmental impact [5]. Design approaches that curtail reliance on mechanical cooling systems encompass strategic window placement, daylight utilization, appropriate glazing for windows and skylights, and the use of shading elements to prevent excessive heat gain [7].
The Energy Strategy Incompetent Building (ESIB) necessitates at least one retrofitting stage to reduce energy consumption, which may consist of enhancing cooling system efficiency and improving the building envelope through effective thermal insulation in the roofing system. The implementation of passive strategies, corroborated by DesignBuilder simulations, has demonstrated considerable reductions in energy usage in ESIB residential buildings [8-10]. These strategies predominantly aim to optimize HVAC system performance by lowering internal temperatures and minimizing overall energy consumption in buildings.
Improving a building's structure constitutes an effective strategy for conserving energy, minimizing wastage and loss, and reducing overall energy consumption. A comprehensive understanding of the energy demand profile and identification of the sources of energy consumption in buildings are essential for implementing appropriate measures to effectively reduce energy costs. Heat ingress into ESIB buildings through the window glazing system constitutes a significant contributor to energy consumption, necessitating mitigation through double and/or tinted glazing options.
Numerous studies [8-10] have relied on historical weather data files acquired from weather centers or airports, which are often situated outside city limits and may not accurately represent the prevailing conditions in densely built areas. Conventional procedures, employing hourly, daily, and yearly analyses based on weather data files from weather centers, have proven valuable in evaluating retrofitting processes and recommending energy-saving modeling techniques [11-14]. Nevertheless, the development of new weather measurement technologies has enabled the provision of more accurate and timely weather data, facilitating precise monitoring of weather changes at hourly or even sub-hourly intervals. These advancements offer enhanced capabilities for comprehensive energy-saving analyses.
The objective of this study is to reduce energy consumption in targeted buildings (lecturing building, deanship building, and postgraduate lecturing building of the AKCOE) by implementing various building construction strategies. The impact of retrofitting on electricity, lighting, and HVAC systems will be investigated by comparing energy consumption with and without the retrofitting measures in place. User-friendly simulation tools, such as DesignBuilder software [15] and EnergyPlus software [16], will be employed to utilize a virtual retrofitting approach, generating performance data. Additionally, energy consumption patterns across different months based on building occupancy will be analyzed and compared, evaluating existing strategies of the targeted buildings with and without incorporating passive architectural patterns.
This paper is structured as follows: Section 2 presents the relevant characteristics of the buildings targeted in this study. Section 3 elaborates on the materials and methods employed. Section 4 reports the main findings. Section 5 discusses the salient and significant simulation outcomes. Section 6 summarizes the conclusions reached.
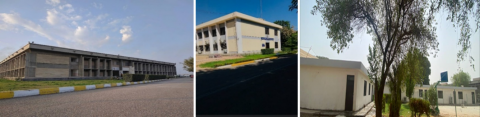
Three standard-height buildings located in the University of Baghdad area in Al-Jadriya city, Baghdad province, Iraq, were chosen as the evaluation buildings. These include a two-floor lecturing building, a two-floor deanship building, and a one-floor postgraduate lecturing rooms building of the AKCOE. The lecturing building has the highest energy consumption among the three buildings due to its size. All three buildings lack basement floors and have a construction life of approximately ten years. The lecturing building has a north-east exposure, while the deanship building and postgraduate lecturing rooms have north-east and south-east exposure, respectively, e.g., Figure 1. The targeted buildings are situated at the AKCOE on 33°16'13.5"N (latitude) and 44°22'26.0"E (longitude), 34m above sea level. The AKCOE is a medium-densely-occupied college located on a peninsula on the banks of the Tigris River. The architecture of the targeted buildings has evolved over time without urban planning, primarily based on functional needs. However, there are some green open areas around the buildings and that will be benefit to reduce the air temperature. The floor footprint and dimensions of the three buildings were obtained through schematics provided by the construction unit at the AKCOE to explore their infrastructures and internal layouts. The lecturing building consists of eight divided corridors and approximately 12 separate spaces (halls) in each department. The length and width of each floor are 54m and 102m, respectively, with a gross footprint area of approximately 5508m2 per department. After excluding the unconditioned corridors area, the conditioned space is approximately 3384m2. Details and dimensions of the lecturing building, e.g., Table 1. The deanship building has three passages, two on the ground floor and one on the first floor, including around 20 separate spaces for administration offices. The length and width of each floor are 21m and 16.8m, respectively, with a gross footprint area of approximately 353m2. The conditioned space in its two floors, using split air-conditioning systems, is approximately 529m2. The detailed dimensions of this building are shown in Figure 3. The postgraduate lecturing building is divided into two passages with around 20 separate spaces for lecturing rooms. The overall footprint area is about 755m2, and a split air-conditioning system is used to cool some of the lecturing rooms with a total area of about 655m2. The footprint details of this building, e.g., Figure 2. The average temperature in Baghdad ranges from 34℃ to 48℃ in July and -2℃ to 10℃ in January, making it important for these buildings to satisfy cooling demands during the hot Iraqi summer [17]. In DesignBuilder, we meticulously entered the architectural blueprints of the targeted buildings, meticulously documenting all construction methodologies and materials employed, including the utilization of iron for external doors and wood for internal doors. It is worth noting that in Iraq, the months of July and August witness a substantial number of days off, totaling 62 days. Occupancy levels within the buildings exhibit fluctuation throughout the day, commencing at 7 o'clock in the morning with a modest number of occupants and gradually increasing until reaching approximately 80% of the total capacity between the hours of 9 in the morning and 1 in the afternoon. The surge in occupancy directly correlates with heightened energy consumption due to the operation of numerous computers, laboratories, and various additional equipment, leading to a significant increase in energy demand, particularly during these peak load periods. Furthermore, the prevailing weather conditions play a substantial role, with temperatures soaring during these hours compared to the remainder of the day.
Figure 1. Main Exterior facade of the lecturing building (left), the deanship building (middle), and the postgraduate lecturing building (right) of Al-Khwarizmi College of Engineering
Table 1. Typical envelope stratigraphy of targeted buildings employed in DesignBuilder simulations
|
Building Data |
||||
|
Element |
Material Layer |
Thickness [mm] |
TC [W/m.0K] |
U-Value [W/m2.0K] |
|
Lecturing Building |
||||
|
External Wall & Internal Partition |
Brick |
20 |
0.5–1.0 |
1.541 |
|
Gypsum Board |
15 |
0.254-0.314 |
||
|
Flat Roof |
Concrete |
40 |
2.25 |
1.650 |
|
Tile |
26 |
0.6-1.7 |
||
|
Ground Floor |
Gravel & Concrete |
26 |
0.55 |
1.532 |
|
Soil & Tile |
26 |
0.37-1.42 |
||
|
Deanship Building |
||||
|
External Wall & Internal Partition |
Concrete Block |
20 |
0.5–1.0 |
2.529 |
|
Gypsum Board |
15 |
0.254-0.314 |
||
|
Flat Roof |
Concrete |
40 |
2.25 |
1.763 |
|
Tile |
26 |
0.6-1.7 |
||
|
Ground Floor |
Gravel & Concrete |
26 |
0.55 |
0.240 |
|
Soil & Tile |
26 |
0.37-1.42 |
||
|
Postgraduate Lecturing Building |
||||
|
External Wall & Internal Partition |
Concrete Block |
20 |
0.5–1.0 |
1.871 |
|
Gypsum Board |
15 |
0.254-0.314 |
||
|
Flat Roof |
Concrete |
40 |
2.25 |
1.650 |
|
Tile |
26 |
0.6-1.7 |
||
|
Ground Floor |
Gravel & Concrete |
26 |
0.55 |
1.532 |
|
Soil & Tile |
26 |
0.37-1.42 |
||
Note: TC means the thermal conductivity of material layer
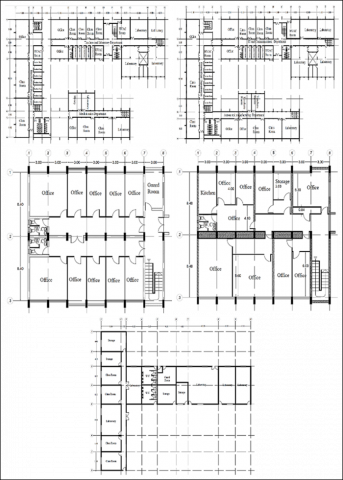
Figure 2. Typical footprint for the ground floor (left) and first floor (right) of the lecturing building (upper panel) and the deanship building (middle panel). The bottom panel illustrates the typical footprint of the postgraduate lecturing building. All dimensions are in (m)
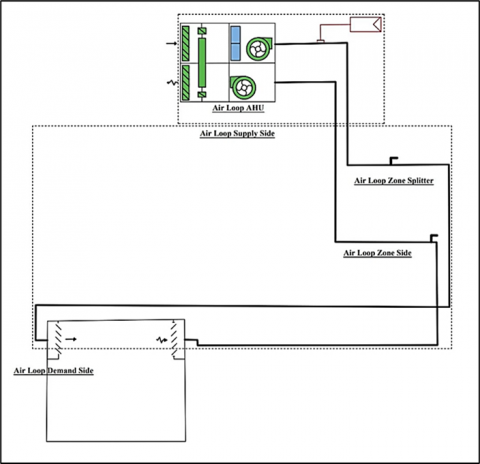
The cooling system in the lecturing building, excluding the corridors on every floor, is supplied by an HVAC plant during summertime, with a chiller radiator installed in each department's cooling space. Additionally, split air conditioning systems are used to assist the HVAC system in some of the lecturer rooms and the office of the head of the department. The type of chiller and cooling plant used in the halls of the lecturing building, e.g., Figure 3.
Figure 3. Type of the cooling plant used in halls of the lecturing building of the AKCOE. The cooling assembly comprises an air handling unit, which includes fans and other accessory equipment for the cooling, cleaning, circulating, humidifying, dehumidifying, and air ducting systems
A field study was conducted, to gather existing data about the buildings by using DesignBuilder Software version 6.1.0.006 which use to determine total solar transmission of windows an U-values, all the required structure information (materials of envelope layers and the thickness) is based on the construction standards of Baghdad Province [18], Table 1 shows the materials used in the building , which does not take into account reducing building energy, where the thermal performance of the base floor and windows is relatively poor and has higher U-values than the standard design recommendations, installed control devices of the HVAC system, and see the elements that used in the building and lighting used. Where, all of these elements can effect on the energy consumption. This detailed information takes into account the establishment life years of the buildings and construction specifications specified during the construction period, e.g., Tables 1 and 2.
Table 2. Typical solar factors for windows of targeted buildings employed in DesignBuilder simulation. SHGC means the solar heat gain coefficient
|
Element |
Material Layer |
Thickness [mm] |
SHGC |
U-Value [W/m2.°K] |
|
Exterior windows |
Single clear glazing 6mm |
6.0 |
0.819 |
5.778 |
By comparing the Iraqi construction system with sustainable practices involves several important points:
1. Emphasizing optimal architectural design that considers ventilation, heating, and efficient cooling methods, thereby saving energy.
2. Prioritizing environmentally friendly building materials over those that harm the environment and rely on oil and rubber combustion.
3. Selecting materials with low energy consumption throughout their lifecycle, from manufacturing and installation to maintenance, to reduce pollution and environmental impact, favoring the use of natural materials.
4. Utilizing renewable energy sources such as solar energy which are abundantly available in Iraq, wind energy, and dam energy and other renewables.
5. Implementing water conservation measures within buildings, recognizing the significance of water as a vital element for life.
6. Ensuring air quality and providing comfort by incorporating proper air circulation systems to supply clean air for building occupants.
7. Encouraging the inclusion of green spaces in residential areas through government regulations.
8. Considering the environmental impact of external facade colors, with light colors reflecting sunlight to maintain cooler buildings, while dark colors have the opposite effect.
We will assess the effect of the retrofitting of the respective targeted buildings using some passive strategies, described below. Due to its significance in the evaluation, energy consumptions will be determined at each building before and after retrofitting using DesignBuilder software as a simulation tool.
3.1 Computational study: DesignBuilder software
This work adopts simulation study as the main investigation method using DesignBuilder software version 6.1.0.006 [19]. DesignBuilder is an easy-to-use modeling environment by works with virtual building models. It provides a range of environmental performance data such as annual energy consumption, summer maximum temperature, and HVAC component size. DesignBuilder uses EnergyPlus' dynamic simulation engine to generate performance data [20].
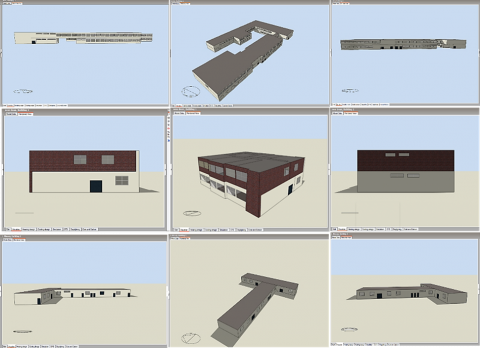
Figure 4. The 3-D model visualizes the front view (left), axonometric view (intermediate), and the side view (right) of the Lecturing buildings (upper panel), the deanship building (middle panel), and the postgraduate lecturing building (bottom panel) of the Al-Khwarizmi College of Engineering using DesignBuilder software.
This study considers three passive energy strategies to assess the collective effect of applying all these strategies on the shading, thermal performance, and energy levels of the whole building. The strategies considered for this study include improved shading, and glazing arrangements, enhancing insulation and applying of light-colored coatings highly with reflective high paint reflection.
The floor outlines that designed using computer aided drawing program, were imported into DesignBuilder software as a footprint for the floor geometry. The space of each building was divided into closed rooms and/or offices including corridors’ spaces and occupancy spaces. The respective data including ground floor, external wall, internal partition, roof, window, and internal floor were properly defined somewhat like the actual construction data collected in the target fields. The footprint of the floor of the three targeted buildings and 3-D models of these buildings, e.g., Figures 2 and 4, respectively. The lecturing building consists of two floors representing thermal zones distributed in five scientific departments (two on the first floor and three on the second floor). Each floor contains lecturing classrooms of two departments and their head of departments' offices, lecturers' rooms, and some laboratories. The deanship building is a two-floor building that includes several employees' offices (thermal zones) and the college's deanship division. The postgraduate lecturing building is a one-floor building that looks like the letter T.
There is an hourly air temperature switchover in Iraqi summer that usually reveals not mild outside temperatures. Therefore, the cooling temperature setpoint is the desired input that the cooling system attempts to control or adjust to returning the conditions back to an appropriate response (setpoint), which should be settled within an acceptable range. The occupied comfort cooling setpoint temperature during occupied hours considering mean radiant temperature, operation periods of cooling and ventilation systems, and targeted buildings occupancy, according to the gathered data from the field study, were carefully inserted in DesignBuilder. The cooling system was consistently settled and regulated to run when the indoor temperature attains or fluctuates around (23℃). We decided on this value by considering the operative cooling temperature in the cooling system control, where the mean radiant temperature was prophesied with 94% accuracy through a regression equation by applying the weather information and the indoor thermal environment data. The regression analysis used by the study [21] was used to calculate the cooling setpoint temperature.
A thermal performance simulation of the AKCOE (Iraq) performed by utilizing DesignBuilder software, to analyze the impact of passive design strategies on its energy consumption.
3.2 Weather data introducing
As is Baghdad city weather, the college is characterized by uncomfortable hot dry summer, especially in the last two decades due to the global climate change, which increased the intensity of heat waves hence the average temperatures day and night. Further, although Baghdad is not a dense towers city and there are not a lot of high urbanization buildings, it is almost denied of the advantages of breezy wind effects, especially in July and August.
Weather data for Baghdad city was extracted from the global climate consultant database, Meteonorm software [22], and added to Designbuilder software. To assess and evaluate accurately targeted buildings, it is very important to get weather data for these locations, where weather data is a significant input to any building energy simulation and modeling. In this study, the EnergyPlus Weather Data (EPW) files were introduced as a weather climate database to DesignBuilder software. EPW is a climate consultant software [23] that is plied for all countries.
To confirm the validity of the weather files entered into the DesignBuilder, two reference weather data files were consulted: the files offered by the power project of NASA Langley Research Center (LaRC) [24] and the National Weather Service program files [25]. Table 3 shows three relevant characteristics of Baghdad climate parameters: relative humidity, temperature, and wind speed.
Table 3. Climatic parameters of Baghdad, Iraq, at 2021
|
Weather Data [annual] |
||||
|
Relative humidity |
Minimum |
Maximum |
Average |
|
|
Average (%) |
Mean (mm) |
Temperature (℃) |
||
|
16 |
44.5 |
30 |
||
|
0.067 |
0.1 |
Wind speed (m/s) |
||
|
6.5 |
9.9 |
7.6 |
||
The temperature calibration considers that the air conditioner turned on in summer, autumn, and spring (the set point at 22℃) and turned off in winter (including November, December, and January). The summer falls data from 21 June to 21 December was taken from the sun chart for Iraq using the climate consultant software. Naturally, the temperature and shading in the summer season affect the sun chart profile. The hottest zone temperatures were above 27℃, the temperatures in the comfort zone ranged from (20-27℃), and the cold temperatures were less than 20℃.
We have chosen specific months in 2021 (March, April, May, June) due to the resumption of full working hours following an extended period of interruption caused by the Covid-19 pandemic. Moreover, this period coincides with the hottest time of the year and the peak of the school year in Iraq.
3.3 Passive design strategies proposed
The effect of architecture on energy consumption represents the most vital challenge nowadays. To reduce energy consumption and improve the performance of the buildings, hence reduce the effect of greenhouse gases on our environment produced by using inefficient designs, via developing the essential methodologies the modern architectures deal with, it is necessary to resort to the use of passive design strategies that be used either during construction or the procedures of retrofit. This study will base on three types of building energy-improving methods: double glazing, high solar reflection insulator, and louver shading device, and their effects when adding them to the targeted buildings will well mentioned.
3.3.1 Louver shading devices
Louver installation slats were installed on the windows of the building to block sunlight and to allow wind to pass through and cool the area on summer days. These slats are horizontally superimposed and tilted 45 degrees (rotation angle). Therefore, the purpose of shading is to block the sunlight during the summer but permit them through in the winter and ignore the heat while allowing the light the targeted space needs to pass and benefit from them.
3.3.2 Double-panel glazing
Most heat gain or loss in our three targeted buildings comes from windows, the main elements that transfer heat between the buildings and their outside environment. In the case of the double glazing methodology, the window's thermal insulation depends on the cavity between the two glass panels. In this design, the distance formed between the two glass sheets can be filled and deflated from gas or can be filled with argon to reduce heat transfer. A good value of the Solar Heat Gains Coefficient SHGC of glass was used (around 17%).
Argon gas is more tightened than the air (1.7836 kg/m3 at a temperature of 0℃). Consequently, filling the hollow glass with argon gas instead of air reduces the gas's thermal conductivity hence heat convection. The relative publications have mentioned that to save energy and achieve thermal comfort in buildings, the lighting, humidity, temperature, and noise should be carefully considered. The single-panel glazing style, the current style used in the targeted buildings, was replaced by double-panel glazing containing argon gas inside its cavity of 13mm instead of air because it does not affect visible light breakthrough [8].
3.3.3 Polystyrene insulator
The insulator in walls, ceilings, and floors of any building reduces or eliminates heat loss on cold days and reduces heat gain on hot days to keep weather comforting inside the buildings in the winter and summer both, where the insulator works as a barrier to any flow type of heat energy. Therefore, the passive design for the targeted buildings should contain well insulation to reduce heat loss or gain across their roofs. In this simulation, a polystyrene material will be utilized as an insulator on the roofing of the three targeted buildings.
These three strategies were selected based on their suitability to the prevailing local climate and their prevalence in our region. Additionally, considering that our building has already been constructed, retrofitting options are limited.
ASHRAE Guideline 14-2014 [25] was used to validate the models of the targeted buildings. This Guideline indicative is a proven methodology for determining the accuracy of the building model, where it contains typical accuracy, especially if the mean bias error (MBE) of data is (±5%) and the coefficient of variation of the root mean square error (CVRMSE) is less than 15%. We calculated the MBE and CVRMSE using Eqs. (1) and (2), respectively.
CVRMSE $=\frac{\sqrt{\sum_{\mathrm{i}=1}^{\mathrm{Ni}}\,\,\left[(\mathrm{Mi}-\mathrm{Si})^2 / \mathrm{Ni}\right]}}{\frac{1}{\mathrm{Ni}} \sum_{\mathrm{I}=1}^{\mathrm{Ni}} \mathrm{Mi}}$ (1)
$\mathrm{MBE}=\frac{\sum_{\mathrm{i}=1}^{\mathrm{Ni}}\,\,(\mathrm{Mi}-\mathrm{Si})}{\sum_{\mathrm{i}=1}^{\mathrm{Ni}} \mathrm{Mi}}$ (2)
where, i is a number of instance the equation use its variables;
CVRMSE: Coefficient of variation of the root mean square error;
MBE= Mean bias error;
Mi: Actual monthly energy consumption at instance (i) ;
Si: Simulated monthly energy consumption; and
Ni: Number of value involved in error calculation.
The aforementioned equations yield a CV(RMSE) value of 10% and an MBE value of 5.8% for the lecturing building, and so on to the other buildings. Therefore, these building models satisfy the criteria outlined in ASHRAE Guideline 14-2014, demonstrating their high level of accuracy.
In the following two paragraphs, the results of the modeling mainly depend on existing design and construction characteristics that use in the model. For instance, the initial configuration of the desired buildings, including their construction materials, was inputted into the software. After that, we will show the simulation outcomes, which carried out on those buildings after making possible modifications from their thermal insulations, glazing system, and shading strategy that will reduce their current energy consumptions. The U-value of window glass is one of the factors affecting the cooling process of buildings [26]. The U-value is a measure of thermal transmittance through the building's fabric, indicating the efficiency of an insulated glass unit (IGU) in retaining heated or cooled air. A lower U-value signifies better insulation performance, with values ranging from minimal heat loss to significant heat loss, which give the opposite. In our paper, we will present the U-value measurements before and after implementing the double glazing strategy in the building. The effectiveness of this strategy is evident in the noticeable reduction of the U-value. The higher the U-value, the greater the cooling energy expenditure. Table 4 shows the U-value for window glass before and after the retrofitting.
Table 4. Typical solar factors for windows of the targeted buildings employed in DesignBuilder simulation before and after applying passive strategies
|
Window Data/Double Glazing Exterior Window |
|||
|
Thickness of glazing [mm] |
Thickness of gap [mm] |
U-Value [W/m2.°K] |
|
|
Before Retrofitting |
After Retrofitting |
||
|
6 |
13 |
5.778 |
2.665 |
These measurements exclude two summer holiday months (July and August) to include four working months, March, April, May, and June, covering the summer season of 2021. The hot and dry weather in Iraq during the summer requires massive electricity to operate the cooling systems, so electricity is the most used in summertime. High electricity consumption is usually associated with high energy consumption as well.
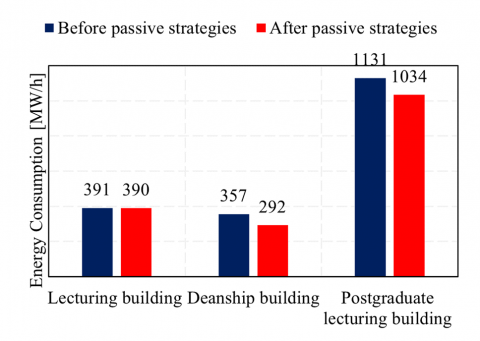
The results show that the energy consumption for cooling reduced from 62 Mwh to 51 Mwh per month for the deanship building (nearly 22.64%), and so on for the other targeted buildings, e.g., Table 5. The cooling energy consumption is only relevant for the summer months, as the air conditioner is switched off during the winter season for the targeted buildings. Figure 5 shows the amount of energy consumption before and after adding passive strategies. The average monthly electricity consumption of the three targeted buildings before and after using three passive strategies separately, e.g., Figure 6.
Table 5. Energy consumption of the three targeted buildings before and after adding passive design strategies
|
Energy Consumption |
||
|
Element |
Before Adding Passive |
After Adding Passive |
|
Lecturing Building |
||
|
Cooling Interior lighting Interior equipment Electricity Net energy |
6,822.75 71,722.75 42,624.16 123,547.295 391,274.28 |
6,458.54 71,722.75 42,624.16 123,183.086 390,120.83 |
|
Postgraduate Lecturing Building |
||
|
Cooling Interior lighting Interior equipment Electricity Net energy |
145,688.1 |
127,541.2 |
|
5,208 |
5,208 |
|
|
105,178.47 |
105,178.47 |
|
|
357,022.462 |
326,646.473 |
|
|
1,130,690.14 |
1,034,489.38 |
|
|
Deanship Building |
||
|
Cooling Interior lighting Interior equipment Electricity |
62,403.81 |
50,882.14 |
|
8,481.69 |
8,481.69 |
|
|
2,611.84 |
2,611.84 |
|
|
112,617.415 |
92,304.87 |
|
|
Net energy |
356,659.35 |
292,329.52 |
Table 6. Electricity consumption for cooling vs. the selective daily temperatures in the four hot months for the three targeted buildings
|
Day |
Temperature (℃) |
Cooling Electricity (kWh) |
||
|
Lecturing Building |
Deanship Building |
Postgraduate Building |
||
|
1 March |
15.5 |
2173.77 |
126.38 |
317.158 |
|
5 March |
18.26 |
2676.08 |
194.94 |
743.432 |
|
10 March |
20.86 |
3509.57 |
263.53 |
520.34 |
|
15 March |
18.23 |
2410.35 |
196.45 |
458.39 |
|
20 March |
20 |
3270.63 |
248.28 |
864.03 |
|
25 March |
24.5 |
4134.47 |
222.22 |
978.056 |
|
30 March |
21.73 |
4336.647 |
246.64 |
821.05 |
|
1 April |
23.27 |
4336.64 |
324.67 |
998.68 |
|
5 April |
21.27 |
3185.9 |
253.48 |
557.71 |
|
10 April |
26.46 |
4496.58 |
374.47 |
678.615 |
|
15 April |
18.92 |
3069.58 |
259.19 |
480.59 |
|
20 April |
26.89 |
4226.49 |
330.90 |
1223.65 |
|
25 April |
27.25 |
6508.51 |
356.55 |
1047.6 |
|
30 April |
29.817 |
5373.63 |
410.31 |
1201.686 |
|
1 May |
29.66 |
5796.77 |
441.75 |
1281.67 |
|
5 May |
33.77 |
6811.17 |
510.29 |
1503.005 |
|
10 May |
28.04 |
4711.49 |
362.69 |
725.34 |
|
15 May |
31.71 |
5909.08 |
462.40 |
1272.6 |
|
20 May |
32.86 |
6660.96 |
510.81 |
1388.6 |
|
25 May |
32.4 |
7721.17 |
610.05 |
1252.26 |
|
31 May |
34.02 |
7635.69 |
605.64 |
1231.109 |
|
1 June |
33.6 |
7209.54 |
566.98 |
1129.35 |
|
5 June |
25.08 |
6867.86 |
557.81 |
1040.53 |
|
10 June |
37.9 |
8136.853 |
621.79 |
1615.44 |
|
15 June |
36.59 |
7369.62 |
569.59 |
1137.08 |
|
20 June |
41.05 |
9243.33 |
699.37 |
1818.28 |
|
25 June |
36.07 |
7653.18 |
579.23 |
1585.19 |
|
30 June |
37.09 |
8006.27 |
603.69 |
1550.798 |
Figure 5. Energy consumption for the cooling in the three targeted buildings before and after adding passive design strategies during four hot months
Figure 6. Electricity consumption of the targeted buildings for cooling before and after adding passive design strategies during four hot months
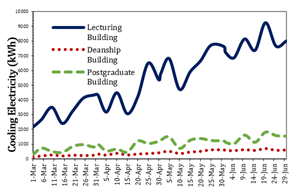
Table 6 illustrates the electricity consumption for cooling, the selective daily temperatures in the four hot months (March, April, May, and June of 2021) for the three targeted buildings.
In Figure 7, the graph showcases the electricity consumption for cooling in the three designated buildings, juxtaposed with the daily temperatures observed throughout these four hot months. Notably, the months of July and August, which coincide with the official summer vacation period and a significant reduction in academic activities, were excluded from the analysis.
Figure 7. Electricity consumption for cooling vs. day temperatures for the three targeted buildings during four hot months
Additionally, we can also use the following two equations to calculate the energy saving in the three buildings without and with the context of the retrofitting:
Saving(kWh) = Energy used before retrofitting (kWh) - Energy used after retrofitting (kWh) (3)
Saving $\%=\frac{\text { Saving }(kWh)}{\begin{array}{c}\text { Energy } \text { used before } \text { passive } \text { strategies } (kWh) \times 100 \%\end{array}}$ (4)
According to the Eq. (4), retrofitting can save 9%, 8.5%, and 18.06% of the required cooling energy for the undergraduate lectures building, the postgraduate lectures building, and the deanship building, respectively, e.g., Table 7.
Table 7. Actual and simulation amounts of electricity monthly consumption for the targeted buildings
|
Electricity Consumption (kWh) |
|
|
Actual |
Simulation |
|
Lecturing Building |
|
|
93547.295 |
123547.295 |
|
Deanship Building |
|
|
82617.415 |
112617.415 |
|
Postgraduate Lecturing Building |
|
|
327002.462 |
357022.462 |
6.1 Importance of thermal energy performance simulation
6.1.1 Evaluating heat gain and loss in buildings
Conducting a thermal energy performance simulation is crucial for assessing the interior and exterior heat gain or loss in buildings, particularly older ones that lack ideal thermal performance. Such buildings often rely on outdated cooling and heating systems that are not energy-efficient.
6.1.2 Factors affecting monthly power consumption
The monthly power consumption of buildings varies depending on factors such as occupancy, age, construction materials, insulation, and climate temperature, influenced by geographic location. The DesignBuilder software, utilizing the EnergyPlus simulation engine, was chosen for its advanced capabilities in modeling and simulating buildings with various materials and configurations.
6.2 Implementation of passive design strategies
6.2.1 Enhancing energy efficiency
To reduce energy expenditure and maintain comfortable indoor conditions, different passive design strategies were employed, as described in Section of (Passive Design Strategies Proposed). These strategies involved modifying the existing construction of the target buildings to achieve energy savings. The lecturing building, due to its higher occupancy, showed higher energy consumption initially, but after incorporating passive design strategies, its energy consumption decreased.
6.3 Energy consumption comparison and retrofitting
6.3.1 Energy consumption outcomes
Comparing energy consumption before and after retrofitting the buildings revealed noticeable changes. The retrofitted buildings exhibited reduced energy consumption. Specifically, the lecturing building saw a decrease from 391,274.28 kWh to 390,120.83 kWh, the deanship building decreased from 356,659.35 kWh to 292,329.52 kWh, and the postgraduate lecturing building decreased from 1,130,690.14 kWh to 1,034,489.38 kWh.
6.3.2 Long-term energy savings
Although the energy consumption reduction may appear modest, the cumulative impact over time will result in significant cost savings for cooling these buildings. Additionally, the deanship building, with its smaller footprint and minimal glazing, demonstrated lower energy expenditures compared to the other buildings, particularly the postgraduate lecturing building with extensive glazing.
6.3.3 Influence of U-value and passive design strategies
The study clearly demonstrates that the current glazing system used in Iraq's building construction is a significant contributor to electrical energy consumption. Therefore, there is a need to raise awareness and provide guidance on adopting modern glazing systems that are suitable for Iraq's climatic conditions. While extensive glazing can be beneficial during the winter season, a logical assessment of cold and hot periods suggests the use of modern systems that effectively support air conditioning in both seasons, particularly the summer. Table 5 showcases the impact of passive design strategies on the U-value, specifically for single glazing windows with a thickness of 6mm. The U-value significantly decreased after retrofitting, particularly when employing the double-glazing strategy, which effectively halved the U-value for all facades. This highlights the substantial role of passive design strategies in reducing cooling energy consumption during the summer.
6.4 Heat gains and mitigation
6.4.1 Factors contributing to heat gains
Heat gains in non-retrofitted buildings originate from various sources such as walls, ceilings, floors, ground floors, partitions, roofs, lights, miscellaneous equipment, occupancy, solar radiation, and corridor zones. Notably, the increase in solar gains through large windows and the first-floor roof, followed by occupancy and walls, contributed most significantly to heat gains.
6.4.2 Impact of nethermost floor
In the undergraduate lecturing building, heat gain mitigation is primarily attributed to the properties of the nethermost floor. This aspect plays a crucial role in reducing electricity consumption for cooling in this specific building.
6.5 Actual and retrofitted electricity consumption
Table 7 presents the actual and retrofitted (simulated) monthly electricity consumption for the targeted buildings. The CVRMSE and MBE values fall within acceptable ranges, aligning with ASHRAE Guideline 14-2014 [25], indicating the accuracy of the readings and the success of the retrofitting measures.
Although Baghdad is an ancient, densely-populated city, there are still opportunities to make significant changes and create an attractive, green urban environment with excellent architectural characteristics. The hot, dry weather in Iraq significantly affects the thermal performance of the targeted buildings due to inefficient opening and enveloping systems. Retrofitting proved to be highly beneficial in improving their energy performance. To enhance the accuracy of DesignBuilder simulation and achieve better energy evaluation, it would be advantageous to have localized weather measurements inside the targeted buildings, providing more realistic and detailed data on energy consumption.
The simulation work conducted in this study focused on retrofitting three buildings within the Al-Khwarizmi College of Engineering using passive strategies. A comparison was made between the energy consumption of the retrofitted buildings and their original architecture to assess the impact of urban-style construction on electricity and energy usage over the course of a year. The findings reveal significant differences in energy consumption among the respective targeted buildings, particularly when considering long-term operation. While various passive design strategies exist, this simulation focused on assessing the energy consumption reduction achieved through passive strategies applied to building envelopes, walls, exterior windows, and roofs-the primary sources of heat transfer between the interior and exterior of buildings. The aim of this simulation work was to provide guidance for evaluating the impact of different passive strategies on existing Iraqi architecture and their potential for transforming urban residential buildings.
It should be noted that the targeted buildings in this study are situated in areas with good afforestation and ample green spaces, contributing to evaporative cooling and mitigating heat in the building surroundings. This, in turn, reduces internal temperatures and lowers energy consumption for cooling. This may explain the relatively small difference in energy consumption observed before and after retrofitting, despite its significance. To optimize Iraqi university campuses and achieve energy-efficient buildings, especially during the hot summer months, effective means of sustainable cooling strategies need to be implemented. Future work will explore sustainable cooling strategies in Iraq, including the utilization of renewable energy sources such as geothermal, wind turbines, and solar energy.
|
AKCOE |
Al-Khwarizmi College of Engineering |
|
HVAC |
Heating, Ventilation, and Air Conditioning |
|
ESIB |
Energy Strategy Incompetent Building |
|
TC |
Thermal Conductivity |
|
SHGC |
Solar Heat Gain Coefficient |
[1] Oerlemans, N., McLellan, R., Grooten, M. (2022). Living Planet Report, World Wide Fund for Nature. Gland, Switzerland: WWF International.
[2] Nazi, W.I.W.M., Royapoor, M., Wang, Y., Roskilly, A.P. (2017). Office building cooling load reduction using thermal analysis method–A case study. Applied Energy, 185: 1574-1584. https://doi.org/10.1016/j.apenergy.2015.12.053
[3] Nazi, W.I.W., Wang, Y.D., Roskilly, T. (2015). Methodologies to reduce cooling load using heat balance analysis: A case study in an office building in a tropical country. Energy Procedia, 75: 1269-1274. https://doi.org/10.1016/j.egypro.2015.07.185
[4] Asimakopoulos, D., Santamouris, M. (2013). Passive Cooling of Buildings. Taylor & Francis Group.
[5] Tian, Z., Zhang, X., Jin, X., Zhou, X., Si, B., Shi, X. (2018). Towards adoption of building energy simulation and optimization for passive building design: A survey and a review. Energy and Buildings, 158: 1306-1316. https://doi.org/10.1016/j.enbuild.2017.11.022
[6] Roberti, F., Oberegger, U.F., Gasparella, A. (2015). Calibrating historic building energy models to hourly indoor air and surface temperatures: Methodology and case study. Energy and Buildings, 108: 236-243. https://doi.org/10.1016/j.enbuild.2015.09.010
[7] Sanhudo, L., Ramos, N.M., Martins, J.P., Almeida, R.M., Barreira, E., Simões, M.L., Cardoso, V. (2018). Building information modeling for energy retrofitting–A review. Renewable and Sustainable Energy Reviews, 89: 249-260. https://doi.org/10.1016/j.rser.2018.03.064
[8] Noh-Pat, F., Xamán, J., Álvarez, G., Chávez, Y., Arce, J. (2011). Thermal analysis for a double glazing unit with and without a solar control film (SnS–CuxS) for using in hot climates. Energy and Buildings, 43(2-3): 704-712. https://doi.org/10.1016/j.enbuild.2010.11.015
[9] Vargas, A.P., Hamui, L. (2021). Thermal energy performance simulation of a residential building retrofitted with passive design strategies: A case study in Mexico. Sustainability, 13(14): 8064. https://doi.org/10.3390/su13148064
[10] Taleb, H.M. (2014). Using passive cooling strategies to improve thermal performance and reduce energy consumption of residential buildings in UAE buildings. Frontiers of Architectural Research, 3(2): 154-165. https://doi.org/10.1016/j.foar.2014.01.002
[11] Pedrini, A., Westphal, F.S., Lamberts, R. (2002). A methodology for building energy modelling and calibration in warm climates. Building and Environment, 37(8-9): 903-912. https://doi.org/10.1016/s0360-1323(02)00051-3
[12] Raftery, P., Keane, M., Costa, A. (2011). Calibrating whole building energy models: Detailed case study using hourly measured data. Energy and buildings, 43(12): 3666-3679. https://doi.org/10.1016/j.enbuild.2011.09.039
[13] Liu, S., Henze, G.P. (2005). Calibration of building models for supervisory control of commercial buildings. In Proceedings of the 9th International Building Performance Simulation Association (IBPSA) Conference, Montréal, Canada, pp. 641-648.
[14] Reddy, T.A., Maor, I., Panjapornpon, C. (2007). Calibrating detailed building energy simulation programs with measured data—Part I: General methodology (RP-1051). Hvac&R Research, 13(2): 221-241. https://doi.org/10.1080/10789669.2007.10390952
[15] Yoon, J., Lee, E.J., Claridge, D.E. (2003). Calibration procedure for energy performance simulation of a commercial building. Journal of Solar Energy Engineering, 125(3): 251-257. https://doi.org/10.1115/1.1564076
[16] Karsten V., Musall, E. (2012). Net Zero Energy Buildings-International Projects of Carbon Neutrality in Buildings. DETAIL Green Books.
[17] Climates to travel-World climate guide. https://www.climatestotravel.com/climate/iraq#baghdad.
[18] Abd, İ.M. (2018). A time-cost tradeoff analysis of a construction project in Baghdad city using project management techniques. Master's thesis, Çankaya Üniversitesi. Wadsworth, Belmont, Linear Networks and Systems.
[19] DesignBuilder v6.1.0.006. (2019). https://designbuilder.co.uk/download/previous-versions/382-designbuilder-6-1-0-006/file.
[20] EnergyPlus Background Information-DesignBuilder 2.1 User's Manual. (2021). DesignBuilder Software Ltd.
[21] Alfano, F.R.D.A., Dell’Isola, M., Palella, B.I., Riccio, G., Russi, A. (2013). On the measurement of the mean radiant temperature and its influence on the indoor thermal environment assessment. Building and Environment, 63: 79-88. https://doi.org/10.1016/j.buildenv.2013.01.026
[22] Meteonorm Software, Updated Historic, Current and Future Data. (2022). https://meteonorm.com/en/.
[23] Software POWER Project Data Sets. (2020). NASA. https://power.larc.nasa.gov/.
[24] EnergyPlus Software. (2022). U.S. Department of Energy’s (DOE) Building Technologies Office (BTO), https://energyplus.net/.
[25] Measurement of energy, demand, and water savings. (2014). ASHRAE guide l, 4: 1-150.
[26] Muslih, K.D., Błażejczyk, K. (2017). The inter-annual variations and the long-term trends of monthly air temperatures in Iraq over the period 1941–2013. Theoretical and Applied Climatology, 130: 583-596. https://doi.org/10.1007/s00704-016-1915-6