Shabbir Ahmed Jewel*![]() | Md. Iqbal Hasan
| Md. Iqbal Hasan![]()
© 2024 The authors. This article is published by IIETA and is licensed under the CC BY 4.0 license (http://creativecommons.org/licenses/by/4.0/).
OPEN ACCESS
The study was initiated focusing on the rising concerns of the fisher community and environmental activists that construction of 600×2 MW Matarbari Ultra Super Critical Coal-fired power project and construction of 6.5km access road over the foreshore is filling the riverbed and impacting to the aquatic ecosystem of the Kohelia River. The study was carried out to identify the impact issues, to assess the project’s wastewater discharge quality, surface water quality, primary productivity status, and fishery status during dry season. From the primary drain, labor camp wastewater samples were collected, and overflow dredging water samples were taken from the immediate discharge point. Three sites in the Kohelia River had their surface water quality examined between January and March of 2022. Samples were collected by using statistical sampling techniques, stored, and transported to a facility for analysis. By evaluating numerous physicochemical and biological indicators, this monitoring attempts to shed light on the environmental circumstances surrounding the river. Standard procedures were adopted to conduct the Fish Catch Assessment Survey to find out the status of fish diversity and catch composition of dry season. Study found that concentrations of COD and Fecal Coliform in labor camp wastewater were significantly higher than national standards. On the other hand, discharged overflow dredging water contained high load of turbidity and TSS that caused significant increase in turbidity and TSS levels of surface water. Compared to the baseline data (EIA 2013), noticeable decline in water level and increase in salinity level of surface water also were observed. Due to wastewater discharge, no variations were observed for other surface water quality parameters i.e. pH, temperature, DO, BOD, COD, Nitrate, Oil and grease, and Fecal Coliform. The study on biological characteristics of the Kohelia River found both abundance and species diversity of phytoplankton, zooplankton and benthos community recorded higher than baseline study (EIA 2013) period.
aquatic ecosystem, Fish Catch Assessment, impact, Kohelia River, power project, water quality
With almost 700 rivers and their tributaries, Bangladesh has a lot of potential for the fishing industry [1]. It contributes 3.65% of the country's GDP, which is a significant amount, and makes up 23.81% of the GDP from agriculture. Additionally, fish and fisheries products are Bangladesh's second-largest export commodity, accounting for 1.97% of the nation's foreign exchange profits in the 2015-2016 period [2]. Fisheries resources are still essential for supplying animal protein needs and advancing the nation's socioeconomic growth. More than sixteen million people, or roughly 11% of the country's population, depend on the fishing industry directly or indirectly for their livelihoods [3]. The majority of our nation's rivers are currently in danger because of a few particular factors. On river banks, facilities such as power plants, bridges, flood control systems, etc. are constructed without taking the general state of the river into account. Old industrial contaminants that have accumulated at the riverbed may be disturbed by dredging. The Kohelia, the study river, is a significant coastal river that flows eastward and is part of the Moheshkhali Upazila's Dhalghata and Matarbari unions in the Cox's Bazar region. This power plant region is located in Matarbari and Dhalghata Union under Maheshkhali Upazila, on the banks of the Bay of Bengal and Kohelia River. Along with other massive activities, a coal power plant's infrastructure is now being built. The primary objective of this study is to investigate and analyze the industrial development related impact aspects affecting the aquatic environment, fish diversity and catch composition in the Kohelia River. There is evidence that during their service life, construction materials leach certain chemicals when they come into contact with water. A variety of building materials, such as treated wood, bituminous sheets [4], facades [5], fiber cement sheets [6], paints, textiles [7], anti-corrosion coatings [8], concrete [9], cement pastes [10], fire-retardant coatings [11], roof membranes [12], and roof paints, have been found to exhibit this behavior.
The Fish Catch Assessment Survey is a thorough endeavor aimed at understanding the status of fish and fisheries resources in the surveyed area. By employing a random selection of fishing gear and calculating the capture per unit effort (CPUE), the survey can estimate the overall catch, providing valuable insights into fish populations and the effectiveness of different fishing methods. Collecting sediment samples of macro benthic faunal communities using an Ekman grab allows for the assessment of benthic organisms, which are crucial components of aquatic ecosystems. Similarly, collecting zooplankton water samples using a Zooplankton net with specific mesh size ensures the accurate representation of zooplankton populations, providing important data on the lower levels of the food chain. Utilizing an Olympus binocular microscope and the Sedgwick-Rafter counting chamber method for estimating phytoplankton species abundance indicates a meticulous approach to analyzing microscopic organisms. This method is commonly used in environmental studies due to its accuracy and reliability. Adhering to APHA guidelines for analyzing dissolved oxygen, salinity, and other parameters ensures the accuracy and consistency of the survey's results. These parameters are critical for understanding the overall health and dynamics of aquatic ecosystems. The comprehensive methodology outlined in the survey demonstrates a rigorous and scientific approach to assessing the status of fish and fisheries resources, as well as the broader aquatic ecosystem. Such surveys are essential for informed management and conservation efforts.
A case study on the culverting of Abram stream explores the effects of changing a stream to make room for the construction of a runway at an airport near Cleveland, Ohio, and looks at how construction affects water quality [13]. The study's findings showed there were no statistically significant differences in pH, conductivity, or TSS between the upstream and downstream phases suggest that the overall water quality may not be significantly impacted by construction projects that employ the proper best management practices (BMPs). Data were gathered using a verified questionnaire in a research conducted by Hasle et al. [14] on fisheries and fishing gear in the Patuakhali District, Bangladesh's Agunmukha River. The survey found 47 fish species spread throughout 28 families and nine main categories of fishing gear. Finfish species that are vulnerable, endangered, or critically endangered have also been found, underscoring the necessity of conservation measures to protect the diversity of fisheries.
In Khulna, Bangladesh, Janssen et al. [15] studied the variety of fish and shellfish in the Rupsa River. There are currently 62 species, but nine have vanished in the previous ten years, according to the study. Both naturally occurring and man-made issues, including overfishing, urbanization, pollution, illicit fishing gear, and navigation, have been linked to the reduction in biodiversity.
In their investigation of fish abundance on Hatiya Island, Bangladesh, Manoylov [16] identified 38 species, belonging to 9 orders and 21 families. The fact that a sizable portion of species were classified as Vulnerable, Endangered, or Locally Threatened highlights the importance of conservation initiatives.
In a Bangladeshi coastal river, Lupsea et al. [17] found 86 fish species in 61 genera and 31 families during their investigation of the ichthyofaunal diversity. Conservation problems were highlighted by the classification of thirteen species as vulnerable, ten as endangered, and eight as severely endangered.
The fishing techniques and equipment utilized to catch Asian seabass along Bangladesh's Bay of Bengal coast were examined by Mahmood et al. [18]. The study determined which fishing nets and equipment work best for catching Asian seabass at various stages of their life cycle. Using capture per unit effort (CPUE), Märkl et al. [19] investigated species abundance in Chalan Beel, Bangladesh. 38 distinct species were found in the study, with CPUE varying across various locations and types of gear in Chalan Beel.
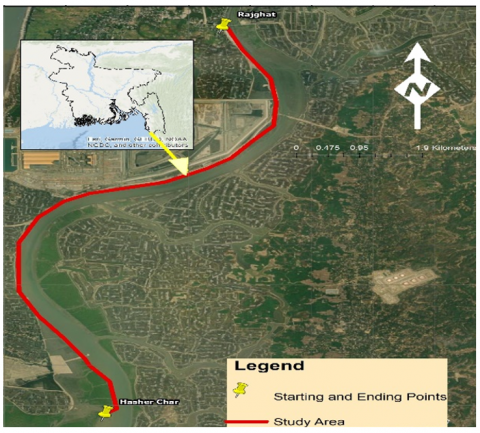
The study river, The Kohelia is an important coastal river located east side of the Matarbari and Dhalghata union of Moheshkhali Upazila under Cox’s Bazar district. It originates from the Matamuhuri River and falls into the Bay of Bengal. The Coal Power Generation Company of Bangladesh Ltd. (CPGCBL) is constructing a new power plant and it’s associate 7.5m long access road along the bank of the Kohelia River. In present construction of power plant infrastructure is going on along with other huge activities. Mangrove habitats are also present along the riverbank. The study area encompasses a 12 km stretch from Rajghat to Hasher Char, with GPS coordinates 21°43'36.02" N 91°54'20.34" E to 21°39'46.59" N 91°53'06.74" E. The river connects upstream to the Matamuhuri River and flows downstream into the Bay of Bengal (Figure 1). Both quantitative and qualitative methods, including literature review, visual observation, physical survey, lab tests on wastewater, surface water, and limnology, as well as Key Informant Interviews (KII), focus group discussions (FGD), and questionnaire surveys, were employed to gather necessary data. The study spanned four months, conducted from January to April 2022.
Figure 1. Kohelia River
This study rigorously investigates the impact of industrial development on the Kohelia River's aquatic environment. Key water quality parameters, including temperature, pH, BOD5, COD, TSS, oil and grease, fecal coliform, and nitrate, are meticulously assessed using established methods such as in situ temperature measurement, electrometric pH determination, and ISO standards for depth measurement. Rigorous cleaning and transportation procedures ensure sample integrity. The comprehensive methodology adheres to APHA guidelines for accuracy in analyzing dissolved oxygen, salinity, and other parameters. This robust approach provides valuable insights for environmental conservation and sustainable development efforts in the Kohelia River (Table 1).
Table 1. Project wastewater quality and surface water quality
|
Parameters |
Frequency |
No. Location |
|
Wastewater |
Twice January and March 2022 |
Labor camp wastewater location (Primary drain) |
|
Temperature, pH, Salinity, BOD, TSS, Oil&Grease, COD, Nitrate and Fecal Coliforms |
Overflow dredging water location (Discharge outlet) |
|
|
Surface Water |
Twice Jamary and March 2022 |
3 locations, in front of immediate discharge point of wastewater and-overflow dredging water, 1.5 km upstream and 0.5 km downstrean |
|
Depth, Temp, Salinity, pH, DO, BOD, COD, TSS, Turbidity, Nitrate, Oil&Grease, and Fecal Coliforms |
Note: Sampling and lab test performed by the laboratory of SGS Bangladesh
Table 2. Phytoplankton, zooplankton, and benthos survey
|
Parameters |
Frequency |
No. Location |
|
Phytoplankton, zooplankton, and benthos |
Once January 2022 |
3 locations, in front of immediate discharge point of wastewater and overflow dredging water, 1.5 km upstream and 0.5 km downstream |
Note: Sampling program and lab test performed by the laboratory of marine fisheries technology station, Cox’s Bazar
2.1 Phyto-planktons sampling
Plankton samples were collected during early morning. 10 liters of water sampled from different areas and depths of the coast/river was filtered through 25 μm mesh plankton net. The collected sample was then concentrated in 30 ml receptacle glass tube, attached at the end of the plankton net. Plankton samples were then preserved in phosphate buffered formalin 3% concentration along with one drop of glycerin. After that the preserved samples were kept in refrigerated condition for further analysis by 7-10 days. Phytoplankton water sample will be collected using Van Dorn water sampler. Approximately 10 – 15 litres of water sample will be filtered through plankton net of 30μm mesh size and preserved with 4% formalin in properly rinsed bottle.
Water sample specimen will be scanned with Olympus binocular microscope and Sedgwick-Rafter counting chamber (S-R cell) method will be adopted in in estimating the phytoplankton species abundance.
Olympus Stereo microscope, Model SZX 16 (Japan). Taxonomic identifications will be carried out [20-24]. Results reported in number of cell per liter by species.
2.2 Zooplanktons sampling
Zooplankton water sample will be collected using a Zooplankton net with mesh size of 300μm and metallic circular frame with a 25cm mouth opening. The sample will be preserved in 4% formalin.
Water sample specimen scans with Olympus binocular microscope and adopts Sedgwick-Rafter counting chamber (S-R cell) method in determining quantitative estimation of phytoplankton species abundance. Taxonomic identifications carries out will be carried out [20-24]. Results reported in number of individuals per m3 of sample by species.
2.3 Benthos sampling
Sediment sample of macro benthic faunal communities will be collected using Ekman grab from an area of 15×15×15 cm at respective sampling point. The samples will be sieved through a 0.5mm mesh and preserved with 10% formalin in sampling bottle.
Identification of benthos species will be referred to the taxonomic guides Schoknecht et al. [25], Uddin et al. [26] and Vermeirssen et al. [27]. The sample will be stained with Rose Bengal for the identification process. Results reported in number of individuals per m3 of sample by species (Table 2).
2.4 Survey method
A Fish Catch Assessment Survey was conducted in the survey area, employing a random selection of fishing gears to evaluate the status of fish and fisheries resources. The sampling method aimed to include at least one or 30% of the total number of each type of fishing gear in operation during the on-spot catch effort survey. Fishermen using the sampled gears were interviewed using a structured questionnaire to gather primary data on fish species abundance and catch composition. Fish samples were collected, and species were identified using morphological traits with the assistance of Jahangirnagar University's Department of Zoology. Identified fish specimens were photographed, preserved, and sent to the lab, with verification by the Upazila Fisheries Officer to ensure accuracy and reliability in the species identification process.
2.5 Catch weight calculation
Total catch of fish shall be estimated from the data collected by catch assessment survey.
Gear wise total catch (gm/haul) was calculated by Sc/Sg/Sh
where,
Sc=Total sample catch in gm
Sg=Number of sample gear
Sh=Number of haul
The fish capture for each piece of fishing gear was recorded by computing the capture per unit effort (CPUE), which allowed for an estimate of the entire catch [28]. A typical metric for expressing fish biomass and abundance is CPUE, which measures the quantity of catch obtained per unit of fishing effort. In this investigation, CPUE was computed using a modified version of the model equation created by the study. This method helps evaluate the overall performance of the fishery by giving a numerical indicator of how well each type of fishing gear catches fish.
CPUE=Sc/Sg/Ts×Td
where,
CPUE=Catch Per Unit Effort by gear
Sc=Total sample catch (g)
Sg=Number of sample gear
Ts=Fishing time to catch the observed sampled fish (hour)
Td=Total fishing time in a day (hour)
3.1 Projects wastewater discharge quality
Labor camp wastewater (treated and untreated domestic and sewage wastewater) and overflow dredging water quality have been monitored twice during the months of January and March 2022.
Table 3. Labor camp wastewater quality test results
|
Parameter |
Unit |
Labor Camp Wastew ater Quality Test Results |
Bangladesh Standard |
|
|
Jamuary 2022 (Primary Drain) |
March 2022 (Primary Drain) |
Schedule 10 of ECR 1997 |
||
|
Temperature |
℃ |
26 |
30 |
NYS |
|
pH |
- |
7.7 |
7.4 |
6.0-9.0 |
|
TSS |
mg/L |
28 |
36 |
150 |
|
BOD |
mg/L |
40 |
14 |
50 |
|
COD |
mg/L |
215 |
180 |
200 |
|
Nitrate |
mg/L |
1.9 |
1.6 |
10.0 |
|
Fecal Coliform |
MPN/100 |
11200 |
16000 |
NYS |
Note: Survey conducted by author. Sampling and lab test performed by the SGS BD Ltd. (https://www.google.com.bd/books/edition)
Table 4. Overflow dredging water quality test result
|
Parameter |
Unit |
Labor Camp Wastewater Quality Test Results |
Bangladeh Standard |
|
|
Jamuary 2022 (Primary Drain) |
March 2022 (Primary Drain) |
Schedule 10 of ECR 1997 |
||
|
Temperature |
℃ |
24 |
27 |
NYS |
|
pH |
- |
7.7 |
7.5 |
6.0-9.0 |
|
BOD |
mg/L |
1.9 |
2.0 |
50 |
|
COD |
mg/L |
32 |
32 |
200 |
|
Turbidity |
NTU |
85 |
1400 |
NYS |
|
TSS |
mg/L |
146 |
1640 |
150 |
|
Nitrate |
mg/L |
0.4 |
0.3 |
10.0 |
|
Fecal Colifom |
MPN/100 |
79 |
49 |
NYS |
Note: Survey conducted by author. Sample collection and lab test done by the SGS BD Ltd. (https://www.google.com.bd/books/edition)
Lab test results in Table 3, consolidated with national standards (ECR’ 97), indicate that maximum temperature measured 30°C in March, with higher pH levels in January. TSS concentration recorded 36 mg/L in March, exceeding January levels. Maximum BOD and COD levels measured 40 mg/L and 215 mg/L in January, while Nitrate concentration was higher at 1.9 mg/L in January. Fecal Coliform count was higher at 16000 MPN/100ml in March. Comparing with national standards, pH, TSS, BOD, and Nitrate levels are within limits, but COD and Fecal Coliform levels exceed standards. Key informant interviews revealed that only 3 out of 21 labor camps have sewage treatment plants, and the quality of treated sewage water is not monitored before discharge. This suggests that questionable treated and untreated wastewater discharge may be causing elevated COD and Fecal Coliform concentrations in the water.
Table 5. Kohelia River water quality monitoring results
|
Monitoring Parameter |
Monitoring Month |
Test Results by Locations |
Bangladesh Standard (ECR’97) NYS NYS |
||
|
January 2022 |
RW-1 |
RW-2 |
RW-3 |
||
|
Water level (Meter) High Tide/Low Tide |
March 2022 |
3.3 /3.4 |
2.8 /2.1 |
2.0 /0.8 |
|
|
Baseline (Oct'15) |
6.9 |
6.4 |
6.1 |
||
|
Temperature (℃) |
January 2022 |
24 |
24 |
24 |
NYS |
|
March 2022 |
28 |
29 |
30 |
||
|
Baseline (Nov'17) |
25 |
25 |
24 |
||
|
Salinity(ppt) |
January 2022 |
21 |
21 |
22 |
NYS |
|
March 2022 |
18 |
17 |
18 |
||
|
Baseline (Nov'17) |
15 |
14 |
14 |
||
|
pH |
January 2022 |
8.1 |
8.1 |
7.9 |
6.5-8.5 |
|
March 2022 |
82 |
82 |
8.0 |
||
|
DO (mg/L) |
January 2022 |
6.6 |
6.7 |
6.5 |
≥5 |
|
March 2022 |
5.6 |
5.7 |
5.5 |
||
|
Baseline (Nov'17) |
62 |
6.0 |
6.7 |
||
|
BOD (mg/L) |
January 2022 |
1.8 |
1.7 |
1.9 |
≤6 |
|
March 2022 |
4.6 |
4.1 |
4.9 |
||
|
Baseline (Nov'17) |
2.7 |
2.6 |
3.0 |
||
|
COD (mg/L) |
January 2022 |
24 |
24 |
16 |
NYS |
|
March 2022 |
22 |
21 |
14 |
||
|
Baseline (Nov'17) |
148 |
152 |
166 |
||
|
TSS (mg/L) |
January 2022 |
56 |
44 |
52 |
NYS |
|
March 2022 |
126 |
242 |
156 |
||
|
Baseline (Nov'17) |
42 |
36 |
44 |
||
|
Turbidity (NTU) |
January 2022 |
59 |
62 |
65 |
NYS |
|
March 2022 |
109 |
122 |
155 |
||
|
Baseline (Nov'17) |
36 |
42 |
55 |
||
|
Nitrate (mg/L) |
January 2022 |
0.7 |
0.7 |
0.6 |
NYS |
|
March 2022 |
0.6 |
0.5 |
0.7 |
||
|
Baseline (Nov'17) |
0.5 |
0.6 |
0.4 |
||
|
Oil&Grease (mg/L) |
January 2022 |
1.0 |
12 |
1.0 |
NYS |
|
March 2022 |
0.6 |
0.7 |
0.4 |
||
Note: Survey conducted by author. Sampling and lab test performed by the SGS BD Ltd
Analysis of test results in Table 2 indicates a maximum temperature of 27°C in March, with higher pH levels observed in January. Turbidity and TSS concentrations peaked at 1400 NTU and 1640 mg/L in March, significantly exceeding January levels. Maximum BOD level was 2 mg/L in March, while COD concentrations remained at 32 mg/L in both months. Nitrate levels showed slight variation, and Fecal Coliform counts were insignificant. pH, BOD, COD, and Nitrate concentrations met national standards, but TSS levels exceeded the limit. No standards exist for Turbidity and Fecal Coliform. Key informant interviews revealed that the power plant project did not discharge overflow dredging water in January, resulting in lower turbidity and TSS levels. However, in March, inadequate open space hindered proper treatment of overflow dredging water, leading to elevated turbidity and TSS levels (Tables 4 and 5).
3.2 Aquatic environment physico-chemical characteristics
In January and March 2022, surface water quality was monitored at three locations along the Kohelia River. Notable findings include the highest water levels at RW1, a maximum temperature of 30°C at RW3 in March, and higher salinity levels in January (21-22 ppt). Dissolved Oxygen (DO) levels were lower in March, and Biological Oxygen Demand (BOD) showed higher values during that month. Chemical Oxygen Demand (COD) varied slightly, while Turbidity and Total Suspended Solids (TSS) concentrations were significantly higher in March. Nitrate concentrations showed slight variations. Fecal Coliform counts were insignificant, and measured levels of pH, DO, BOD, and Fecal Coliform were within national standards (ECR’97). Comparative analysis with baseline data from October 2015 revealed a drastic decrease in water levels, potentially attributed to sediment-laden overflow dredging water causing riverbed filling. Despite increased salinity, TSS, and Turbidity levels, navigable water areas were found between RW1 and RW2. Significant variations in COD levels were observed, potentially due to different testing methods. Labor camp wastewater discharge had no observable impact on surface water quality. The study suggests adverse effects on fish diversity due to increased salinity from rapid siltation and overflow dredging water but highlights the complex dynamics influencing surface water quality in the Kohelia River.
3.3 Biological characteristics
Table 6. Benthos status observed at Kohelia channel monitoring month - Jan. 22
|
Identified Benthic Group |
Abundance of Benthic Faunal Species by Monitoring Location |
||
|
RW1 |
RW2 |
RW3 |
|
|
Bivalve |
18 |
18 |
14 |
|
Crustacea |
27 |
25 |
28 |
|
Gastropoda |
5 |
3 |
4 |
|
Oligochaeta |
30 |
27 |
22 |
|
Polycheta |
135 |
110 |
92 |
|
Abundance recorded during present dry season - Jan' 22 |
215 |
183 |
160 |
|
Abundance recorded during baseline study (EIA, 2013) |
207 |
182 |
171 |
Note: Survey conducted by author. Sampling and analysis performed by the MFTS Laboratory. Unit: Individuals/m3
To cover the dry season, status of benthos, phytoplankton, and zooplankton communities have been monitored once in January 2022 at three locations. Survey findings are presented in Tables 6, 7, and 8.
The study reveals that the maximum abundance of the phytoplankton community was observed at Location-RW-2 (26,110 cells/L), followed by RW-1 (25,010 cells/L) and RW-3 (21,250 cells/L). A total of 56 phytoplankton species were documented under 5 groups. The highest abundance of the zooplankton community was found at Location-RW-1 (450 individuals/m3), followed by RW-2 (340 individuals/m3) and RW-3 (290 individuals/m3), with a total of 27 identified species under 6 groups. In sediment samples, the highest abundance of benthic faunal communities was observed at RW-1 (215 individuals/m3), followed by RW-2 (183 individuals/m3) and RW-3 (161 individuals/m3), with a total of 5 groups identified. Comparing with the baseline study (EIA 2013), both the abundance and species diversity of the phytoplankton community were significantly higher in the current study period. The abundance and species diversity of zooplankton and benthic faunal communities were slightly higher. Key informant interviews suggested that the discharge of overflow dredging water contains a high load of silt and clay, acting as nutrients, leading to the increased abundance of the phytoplankton community. Phytoplankton is a unicellular plant organism. So, its measuring unit is cells per liter. On the other hand, zooplankton and benthos are animal organisms. So, its measuring unit is different from phytoplankton. Zooplankton measuring unit is individual per meter cube, and it is internationally accepted unit and counting formula also different in both.
Table 7. Phytoplankton status observed at Kohelia channel monitoring period-semiannual (dry season) monitoring month - Jan’ 22 Unit: cells/L
|
Group/Species |
Location-RWI |
Location-RW2 |
Location-RW3 |
|
Sampling depth |
1.5m |
1.5m |
1.5m |
|
Cladocera |
|||
|
1 Borminasp. |
+ |
+ |
+ |
|
2 Ceriodophia sp. |
|
+ |
|
|
3 Chydorus sp. |
+ |
|
|
|
4 Daphia lnowhalts i |
+ |
+ |
+ |
|
5 Diaphanor ama sp. |
+ |
|
|
|
6Diaptomre gracilis |
|
+ |
|
|
7 Moina sp. |
|
|
|
|
Calanoida |
|||
|
8 Calanus sp. |
|
+ |
|
|
Coppoda |
|||
|
9 Cyclops sp. |
+ |
+ |
++ |
|
10 Diaptomrs sp. |
+ |
+ |
|
|
11 Diaptomrs sp. |
|
|
+ |
|
12 Endicptomis sp. |
|
|
|
|
13 Macrocyclops sp. |
+ |
+ |
|
|
Ostracods |
|||
|
14 Cypridopsis sp. |
+ |
|
|
|
15 Heterocypris sp. |
+ |
|
|
|
Rotifers |
|||
|
16 Asplancha priodonta |
|
+ |
|
|
17 Asplancha sp. |
|
|
+ |
|
18 Brachiomus angularis |
|
+ |
+ |
|
19 Brachiomus caudatus |
|
|
|
|
20 Brachiomus fal catus |
|
|
+ |
|
21 Filinia longiseta |
|
+ |
|
|
22 Filinia terminalis |
|
|
|
|
23 Harirgia sp. |
|
|
+ |
|
24 Hexarthra sp. |
|
+ |
|
|
25 Lucane sp. |
|
|
+ |
|
26 Keratella cochlearis |
|
|
+ |
|
Tintinnida |
|||
|
27 Tintinnopris mortensii |
|
|
|
|
Total Individuals Counted during present dry season - Jan' 22 |
450 |
340 |
290 |
|
Abundance Recorded during baseline study (EIA, 2013) |
410 |
320 |
310 |
Note: ++ most dominant species (above 70% among total species in the sample), + less dominant species (less than 10% among total species in the sample) Source: Survey conducted by author. Sampling and analysis performed by the MFTS Laboratory
3.3 Fisheries status
To capture impacts (of construction activities) scenario, over all river area has been splited in two parts. Area-1 covers 5.5 km from upstream up to construction site and Area-2 covers rest of the downstream areas. Fish Catch Assessment Survey has carried out during the months of January and March 2022 to cover dry season. Survey findings are presented in Table 8.
Table 8. Type of fishing gears
|
Type of Fishing Gears Usually Found in Surrounding Areas |
Total No. of Gears Found in Operation |
Total No. of Gears Selected as Sample and Surveyed |
|
Estuarine set bag net |
5 |
2 |
|
Seine net (Tana/Ber jal) |
8 |
3 |
|
Gill net/Current jal |
2 |
2 |
|
Push net |
0 |
0 |
|
Chat jal |
0 |
0 |
|
Cast net |
1 |
1 |
|
Hook/Line hook |
3 |
2 |
|
Hand picking |
5 |
2 |
During Fish Catch Assessment Survey, fish catch of total 11 units of 6 different types fishing gears have been assessed. Survey covered at least 30% of total number of each type of fishing gear found in operation during survey days. Observation of fish Catch effort included 4 hauls of two Estuarine Set Bag nets, 20 hauls of three Seine nets (Ber / Tana Jal), 21 hauls of two Gill nets, 4 hours catch of a single cast net, and 8 hours catch effort of two long line hooks. Observation also included 7 hours catch hand picking catch effort of two persons. Within the survey Area-1, fishing with aid of only one cast net, two long line hook, and hand picking has been recorded. Rest of the fishing gears found within the Area-2. In January, no fishing activity with aid of Estuarine Set Bag net has observed. In March, no fishing activity within the area of Area-1 has observed.
Identification of a total 41 fish species has been documented and estimation of catch of all surveyed gears has been weighted total 158.2 kg of which, only seven species weighted 4.1 kg has been documented during survey at Area-1. A maximum of 21 fish species have been caught in Estuarine Set Bag nets followed by 15 and 13 fish species has been documented from during observation of fish catch of Seine net (Ber / Tana Jal) and Gill Net respectively. From observation of fish catch of Cast net and long line hook, total 5 and 2 fish species have been documented respectively. A single species has been documented as catch effort of Hand Picking.
3.4 Species diversity by surveyed gears
Observations from 20 hauls of 3 seine nets recorded a maximum weight of 113.1 kg, with a Catch Per Unit Effort (CPUE) of 45.6 kg/net/day. Additionally, 4 hauls of 2 Estuarine Set Bag nets yielded a total weight of 32.5 kg and a CPUE of 16.3 kg/net/day. Two Gill nets and a single Cast net caught 9 kg and 0.5 kg, with CPUE estimates of 4.5 and 1 kg/net/day. Two sets of long line hooks, with an 8-hour catch effort, weighed 1.1 kg, and CPUE was estimated at 1.1 kg/net/day. A total of 2 kg was caught during a 7-hour hand-picking effort by two persons, with a CPUE of 2 kg/person/day. Comparative analysis with the baseline study (EIA-2013) in the dry season revealed a significant decline in fish species diversity and total harvest. The use of Estuarine Set Bag nets, seine nets, and Chat Jal has notably decreased since the baseline study.
Fishermen reported a decline in fish harvest in the Kohelia River since the start of the construction project in 2018. Previously, catches with Estuarine Set Bag nets and Seine nets were around 30-40 kg and 60-70 kg, respectively. However, the current maximum catch is 20 kg with Estuarine Set Bag nets and 40 kg with Seine nets. Several fish species, including Hilsha and Baim, have almost vanished, and the size of the remaining fish has reduced. Fishermen used to catch 10-15 Hilsha fish weighing 800 gm to 1.2 kg, but now they can hardly catch 1-2 fish weighing a maximum of 400 gm. The construction project, filling of the Kohelia River, and the construction of an access road over the foreshore have led to a 30-40% reduction in the potential fishing area. During the dry season, fishing is only possible during high tide, which lasts 5-6 hours, compared to the previous 8-10 hours a day. Fishing is restricted from Rajghat Bridge to the construction site (Survey Area-1) due to low water levels. The number of fishing gears, especially Estuarine Set Bag nets and Seine nets, has decreased by 50%. Fear of gear damage by construction vessels has led to a cessation of nighttime fishing. Fishermen also cited restrictions from the coast guard, increased river traffic, dredging activities by the Bangladesh Economic Zone Authority (BEZA), and the occupation of potential fishing spots by sand barges and dredgers as factors limiting their fishing activities (Table 9).
Table 9. Fish Catch Assessment Survey findings
|
No |
Scientific Names of Fish Species Caught |
Survey Findings Fish Species Identified and Total Catch Weighted (in gm) by the Gears Surveyed |
Totals Fish Species Caught (no) & Weighted (gm) |
|||||
|
Estuarine Set Bag Net |
Seine net (Ber/Tana Jal) |
Gill Net |
Cast |
Long Line Hook |
Hand Picking |
|||
|
1 |
Acanthopagrus latus |
0 |
1000 |
0 |
0 |
350 |
0 |
1350 |
|
2 |
Arius sona |
500 |
0 |
0 |
0 |
0 |
0 |
500 |
|
3 |
Boleophthalmus boddarti |
0 |
0 |
0 |
0 |
0 |
2000 |
2000 |
|
4 |
Coilia dussumieri |
800 |
0 |
0 |
0 |
0 |
0 |
800 |
|
5 |
Corica soborna |
0 |
10000 |
0 |
0 |
0 |
0 |
10000 |
|
6 |
Cynoglossus cynoglossus |
50 |
0 |
0 |
0 |
0 |
0 |
50 |
|
7 |
Cynoglossus lingua |
100 |
0 |
0 |
0 |
0 |
0 |
100 |
|
8 |
Dendrophysa russelli |
0 |
0 |
500 |
0 |
0 |
0 |
500 |
|
9 |
Eleutheronema tetradactylum |
0 |
0 |
350 |
50 |
0 |
0 |
400 |
|
10 |
Escualosa thoracata |
500 |
10000 |
0 |
0 |
0 |
0 |
10500 |
|
11 |
Gastrophysus lunaris |
50 |
0 |
0 |
0 |
0 |
0 |
50 |
|
12 |
Glossogobius giurus |
150 |
0 |
0 |
0 |
0 |
0 |
150 |
|
13 |
Harpadon nehereus |
100 |
0 |
0 |
0 |
0 |
0 |
100 |
|
14 |
Ilisha melastoma |
100 |
0 |
0 |
0 |
0 |
0 |
100 |
|
15 |
Johnius elongatus |
400 |
0 |
5800 |
0 |
500 |
0 |
6700 |
|
16 |
Lactarius lactarius |
20 |
0 |
0 |
0 |
0 |
0 |
20 |
|
17 |
Leiognathus equulus |
0 |
200 |
0 |
0 |
0 |
0 |
200 |
|
18 |
Leptomelanosoma indicum |
100 |
0 |
0 |
0 |
0 |
0 |
100 |
|
19 |
Liza subviridis |
0 |
3000 |
200 |
0 |
0 |
0 |
3200 |
|
20 |
Lutijanus argentmaculatus |
0 |
400 |
0 |
0 |
250 |
0 |
650 |
|
21 |
Mystus gulio |
0 |
0 |
50 |
0 |
0 |
0 |
50 |
|
22 |
Pampus argenteus |
1500 |
0 |
0 |
0 |
0 |
0 |
1500 |
|
23 |
Pangasius pangasius |
1500 |
0 |
0 |
0 |
0 |
0 |
1500 |
|
24 |
Platycephalus indicus |
0 |
0 |
250 |
0 |
0 |
0 |
250 |
|
25 |
Polynemus paradiseus |
600 |
0 |
0 |
0 |
0 |
0 |
600 |
|
26 |
Setipinna taty |
300 |
0 |
0 |
0 |
0 |
0 |
300 |
|
27 |
Sillaginopsis panijus |
0 |
20000 |
20 |
0 |
0 |
0 |
20020 |
|
28 |
Terapon theraps |
0 |
0 |
10 |
0 |
0 |
0 |
10 |
|
29 |
Thryssa dussumieri |
0 |
3000 |
0 |
0 |
0 |
0 |
3000 |
|
30 |
Trichiurus lepturus |
350 |
500 |
0 |
0 |
0 |
0 |
850 |
|
31 |
Valamugil cunnesius |
0 |
44000 |
0 |
0 |
0 |
0 |
44000 |
|
32 |
Valamugil speigleri |
0 |
3000 |
1600 |
400 |
0 |
0 |
5000 |
|
33 |
Acetes indicus |
0 |
7000 |
0 |
50 |
0 |
0 |
7050 |
|
34 |
Acetes japonicus |
23000 |
3000 |
0 |
0 |
0 |
0 |
26000 |
|
35 |
Metapenaeus affinis |
0 |
0 |
20 |
0 |
0 |
0 |
20 |
|
36 |
Metapenaeus brevicornis |
700 |
0 |
0 |
0 |
0 |
0 |
700 |
|
37 |
Metapenaeus monoceros |
0 |
2000 |
30 |
0 |
0 |
0 |
2030 |
|
38 |
Parapenaeopsis sculptilis |
1500 |
0 |
150 |
0 |
0 |
0 |
1650 |
|
39 |
Penaeus indicus |
0 |
0 |
30 |
0 |
0 |
0 |
30 |
|
40 |
Penaeus semisulcatus |
0 |
6000 |
0 |
0 |
0 |
0 |
6000 |
|
41 |
Solenocera crassicornis |
200 |
0 |
0 |
0 |
0 |
0 |
200 |
|
Total Catch Weight (gm) |
32520 gm (32.5 kg) |
113100 gm (113.1 kg) |
9010 gm (9.01 kg) |
500 gm (0.5 kg) |
1100 gm (1.1 kg) |
2000 gm (2.0 kg) |
158230 gm (158.2 kg) |
|
|
Total Number of Species Caught |
21 |
15 |
13 |
3 |
3 |
1 |
41 |
|
|
Total Units of Gear (Net) Surveyed |
2 |
3 |
2 |
1 |
2 set |
2 people |
11 |
|
|
Catch Effort Included Observation of Total No of Hauls/Hours |
4 hauls/48 hrs (=/ day catch of 2 nets) |
20 hauls/16 hrs (=/days catch of 2.5 nets) |
21 hauls/15 hrs (=/day catch of 2 nest) |
4 hrs Catch (=/day catch of 0.5 net) |
8 hrs Catch (=/day catch of 1 set |
7 hrs Catch (=/day catch of each person) |
||
|
Catch Per Unit Effort (CPUE) |
16.3kg/net/day |
45.6kg/net/day |
4.5kg/net/day |
1.0kg/net/day |
1.1kg/hook/day |
2.0kg/person /day |
||
3.5 Impacts on aquatic environment of the Kohelia River physico-chemical characteristics
The study conducted surface water quality monitoring in the Kohelia River during January and February 2022 to assess the impact of construction-related pollution on physico-chemical characteristics, particularly during the dry season. Parameters such as water level, temperature, salinity, pH, DO, BOD, COD, Turbidity, TSS, Nitrate, Oil and grease, and Fecal Coliform were monitored. The discharge of labor camp wastewater and overflow dredging water led to significant deterioration in water level, salinity, Turbidity, and TSS levels. Concentrations of pH, DO, BOD, and Fecal Coliform met national standards, while no standards were set for other parameters. Labor camp wastewater monitoring parameters (pH, TSS, BOD, and Nitrate) adhered to national standards, but COD and Fecal Coliform levels exceeded limits. Despite the discharge of wastewater with high COD and Fecal Coliform concentrations, no noticeable impact on the aquatic environment of the Kohelia River was observed. Overflow dredging water quality adhered to national standards, except for TSS concentrations, which were significantly higher. Turbidity and TSS levels increased during March 2022, impacting the Kohelia River Water. A study in Cleveland, Ohio, conducted by [13] on culverting a creek for airport runway construction showed significant variations in water level, turbidity, and TSS between upstream and downstream samples throughout baseline, construction, and post-construction phases. Significant siltation was observed, affecting areas up to 1 km upstream and downstream at a yearly rate of 0.5 to 0.8 m. The study suggests that discharged sediment from overflow dredging water increased turbidity and TSS levels, likely settling in the riverbed during slack tide, leading to the filling of the upstream Kohelia River. A definitive conclusion requires grain-size analysis of discharged sediment and mathematical model runs, which should be included in future studies to determine sediment deposition potentiality and rate.
3.6 Biological characteristics
Total 56 phytoplankton species have been documented under 5 groups. Study found a maximum abundance of phytoplankton community 26,110 cells/L at monitoring location Location-RW-2. Highest abundance of zooplankton community has found 450 individuals/m3 at monitoring location Location-RW-1. Total 27 zooplankton species have been identified under 6 groups. In sediment samples of survey areas, highest abundance of benthic faunal communities has been counted 215 individuals/m3 at monitoring location RW-1. Total 5 groups of benthic faunal species have been recorded during the study period. In 2016, the abundance of zooplankton ranged from 240.64 individuals/m3 to 45.48 individuals/m3 in the Station 3 during the investigation period. In the monsoon, the lowest value (111.99 individuals/m3) was recorded at Station 3 and the highest value (240.64 individuals/m3) was found at Station 1, which was changed in post monsoon with the lowest value of 45.48 individuals/m3 at Station 2 and the highest value 140.92 individuals/m3 at Station 1. In winter, the lowest value (116.12 individuals/m3) of zooplankton was recorded in Station 3 and highest value 128.6 individuals/m3 was found in Station 1, which changed in the pre monsoon when the lowest value 58.26 individuals/m3 was recorded at Station 2, and highest value 66.3 individuals/m3 at Station 3.
Study has found both abundance and species diversity of phytoplankton community recorded significantly higher than baseline study (EIA 2013) period. Abundance and species diversity of zooplankton and benthic faunal communities have found slightly higher than study carried out in 2016. Discharged overflow dredging water contains high load of silt and clay, which are nutrients. That’s why higher abundance of phytoplankton community has found. ‘Effect of Turbidity and Suspended Material in Aquatic Environments’ revealed that Turbidity and suspended material may reduce photosynthetic activity by interference with light penetration, but primary production and also be stimulated through the addition of nutrients associated with particulates.
The Fish Catch Assessment Survey in the Kohelia River involved the evaluation of various fishing gears, including two Estuarine Set Bag nets, three Seine nets (Ber / Tana Jal), two Gill nets, one cast net, 8 hours catch effort of two long line hooks, and 7 hours catch hand picking effort by two persons. Fishing in Area-1 utilized only one cast net, two long line hooks, and hand picking, while the rest of the fishing gears were employed in Area-2. A total of 41 fish species were documented, and the estimated catch from all surveyed gears amounted to 158.2 kg. Notably, seven species, totaling 4.1 kg, were caught using cast nets, long line hooks, and hand picking in Area-1. The catch per unit effort (CPUE) for Seine nets was estimated at 45.6 kg, followed by 16.3 kg from four hauls of two Estuarine Set Bag nets. The total catch of two Gill nets and a single Cast net weighed 9 kg and 0.5 kg, with CPUEs of 4.5 and 1 kg/net/day, respectively. Additionally, the 8-hour catch efforts of two sets of long line hooks weighed 1.1 kg, resulting in a CPUE of 1.1 kg/net/day. The hand picking catch effort of two persons over 7 hours yielded a total catch of 2 kg, with a CPUE of 2 kg/person/day. Comparing this study with a similar one on the Kohelia River in 2016, the present survey documented fewer fish species (41 compared to 56) and a lower total catch (158.2 kg compared to 508 kg). The earlier study found higher CPUEs for Estuarine Set Bag Nets, Seine Nets, Gill Nets, and Tramel Nets, indicating a decline in fishing activity and fish diversity over time. The study attributes these declines to factors such as riverbed filling, increased turbidity, and Total Suspended Solids (TSS). Swift siltation upstream has led to reduced freshwater inputs, elevating river salinity and potentially impacting fish variety. Low water levels during the dry season disrupt fish movement, reducing fishing time and affecting the setup of essential gears. The rise in turbidity and TSS may also impact fish eggs and larvae, delaying hatching times and posing risks to aquatic species. While overall fish occurrence patterns remain similar, mature fishes are generally more susceptible to suspended particles during dredging and dumping operations.
The lotic ecosystems, primarily embodied by rivers, play a crucial role in sustaining life and supporting various activities in Bangladesh, including sanitation, agriculture, fishing, and navigation. However, these ecosystems face a significant threat due to a decline in water and sediment quality over the past decades. Rivers are vital for daily life in Bangladesh, and proper management is essential to maintain ecological balance, boost fisheries production, and support the growing population. Despite their importance, development projects such as the government's road construction near the Kohelia River and the Coal Power Generation Company of Bangladesh Ltd.'s (CPGCBL) Matarbari 1200 MW Coal-Fired Power Station impact river ecosystems. Ongoing research is investigating the effects of these projects on the Kohelia River, identifying 21 labor camps' wastewater and overflow dredging water as sources of pollution. The access road project has reduced the river's breadth and discharge capacity, affecting local fishermen's grounds and fish habitats. Wastewater analysis revealed permissible levels of pH, TSS, BOD, and nitrate, but higher than average levels of COD and fecal coliform in labor camps' wastewater. Overflow dredge water had noticeably higher TSS levels but met most criteria. River water quality analysis showed differences between sampling sites, with higher levels of salinity, pH, TSS, turbidity, nitrate, and oil & grease compared to baseline surveys. Changes in water depth, COD, BOD, and dissolved oxygen indicated alterations in river conditions. Biological investigations identified 27 zooplankton species and 56 phytoplankton species, with variations in plankton distribution. Benthic abundance and diversity showed consistency with the initial survey. However, catch per unit effort (CPUE) for different fishing gears decreased over time, indicating a detrimental impact on fishing locations and activities. Construction operations negatively affected the Kohelia River's shape and water quality, leading to adverse effects on fish habitats, movement patterns, and the livelihoods of fishermen impacted by coast guard regulations.
During feasibility study or in process of site selection, project authority/ financier should ensure that environmental screening checklist includes the environmental impact issues/aspects related to the disposal of dredged material or discharge of overflow dredging water that are identified in this study. Planning of Environmental Impact Assessment (EIA) study and scooping of impact must consider overflow dredging water discharge related impacts on aquatic ecosystem of receiving water body.
[1] Arefin, S., Kunda, M., Islam, M.J., Pandit, D., Haque, A.T.U. (2018). Status of fish and shellfish diversity and their decline factors in the Rupsa River of Khulna in Bangladesh. Archives of Agriculture and Environmental Science. 3(3): 232-239. https://doi.org/10.26832/24566632.2018.030304
[2] Laura Bridgewater, American Public Health Association, American Water Works Association, Water Environment Federation. (2012). Standard Methods For The Examination of Water and Wastewater. American Public Health Association, Washington, D.C., USA. https://books.google.com.bd/books/about/Standard_Methods_for_the_Examination_of.html?id=dd2juAAACAAJ&redir_esc=y.
[3] Moffitt, C.M., Cajas-Cano, L. (2014). Blue growth: The 2014 FAO state of world fisheries and aquaculture. Fisheries, 39(11): 552-553. https://doi.org/10.1080/03632415.2014.966265
[4] Al-Yamani, F., Skryabin,V., Gubanova, A., Prusova, I. (2011). Marine Zooplankton Practical Guide (Volumes 1 and 2) for the Northwestern Arabian Gulf, Edition: first Publisher: Kuwait Institute for Scientific Research, Kuwait.
[5] Arnold, P.W., Birtles, R.A. (1989). Soft Sediment Marine Invertebrates of Southeast Asia and Australia: A Guide to Identification. Australian Institute of Marine Sciences, Townville, 272.
[6] Burkhardt, M., Zuleeg, S., Vonbank, R., Bester, K., Carmeliet, J., Boller, M., Wangler, T. (2012). Leaching of biocides from façades under natural weather conditions. Environmental Science & Technology, 46(10): 5497-5503. https://doi.org/10.1021/es2040009
[7] Bollmann, U.E., Minelgaite, G., Schlüsener, M., Ternes, T.A., Vollertsen, J., Bester, K. (2017). Photodegradation of octylisothiazolinone and semi-field emissions from facade coatings. Scientific Reports, 7(1): 41501. https://doi.org/10.1038/srep41501
[8] Moffitt, C.M., Cajas-Cano, L. (2014). Blue growth: the 2014 FAO state of world fisheries and aquaculture. Fisheries, 39(11): 552-553. https://doi.org/10.1080/03632415.2014.966265
[9] Houser, D. L., Pruess, H. (2009). The effects of construction on water quality: A case study of the culverting of Abram Creek. Environmental Monitoring and Assessment, 155(1): 431-442. https://doi.org/10.1007/s10661-008-0445-9
[10] Fauchald, K. (1977). The polychaete worms, definitions and keys to the orders, families and genera. Natural History Museum of Los Angeles County: Los Angeles, CA (USA), Science Series. 28: 1-188.
[11] Haque, M.A., Hossain, M.I., Hasan, S.J., Dey, A.P.K. (2021). Diversity of fishing gears and crafts used for harvesting the Asian seabass, Lates calcarifer along the Bay of Bengal, Bangladesh coast. Bangladesh Journal of Fisheries, 33(1): 147-155. https://doi.org/10.52168/bjf.2021.33.17
[12] Hossen, S., Sukhan, Z.P., Sharker, M.R., Hossain, M.B., Ali, M.M., Alam, M.A., Rahman, M.B. (2020). Ichthyofaunal diversity of a coastal river in bangladesh: status and conservation measures. Middle-East Journal of Scientific Research, 28(3): 170-181. https://doi.org/10.5829/idosi.mejsr.2020.170.181
[13] Heisterkamp, I., Gartiser, S., Kalbe, U., Bandow, N., Gloßmann, A. (2019). Assessment of leachates from reactive fire-retardant coatings by chemical analysis and ecotoxicity testing. Chemosphere, 226: 85-93. https://doi.org/ 10.1016/j.chemosphere.2019.03.044
[14] Hasle, G.R., Tomas, C.R., Syvertsen, E.E. (1996) Identifying Marine Diatoms and Dinoflagellates. Academic Press, California.
[15] Janssen, P., Coopman, R., Huys, G., Swings, J., Bleeker, M., Vos, P., Kersters, K. (1996). Evaluation of the DNA fingerprinting method AFLP as a new tool in bacterial taxonomy. Microbiology, 142(7): 1881-1893.
[16] Manoylov, K.M. (2014). Taxonomic identification of algae (morphological and molecular): Species concepts, methodologies, and their implications for ecological bioassessment. Journal of Phycology, 50(3): 409-424. https://doi.org/10.1111/jpy.12183
[17] Lupsea, M., Tiruta-Barna, L., Schiopu, N. (2014). Leaching of hazardous substances from a composite construction product–An experimental and modelling approach for fibre-cement sheets. Journal of Hazardous Materials, 264: 236-245. https://doi.org/10.1016/j.jhazmat.2013.11.017
[18] Mahmood, S., Paul, B., Raknuzzaman, M., Al-Mamun, M.H. (2020). Fish diversity at the vicinity of Hatiya Island, Bangladesh. Bangladesh Journal of Zoology, 48(1): 45-55. https://doi.org/10.3329/bjz.v48i1.47875
[19] Märkl, V., Pflugmacher, S., Stephan, D.A. (2017). Leaching of PCE-based superplasticiser from microfine cement: a chemical and ecotoxicological point of view. Water, Air, & Soil Pollution, 228: 1-17. https://doi.org/10.1007/s11270-017-3373-x
[20] Omori, M., Ikeda, T. (1984). Methods in Marine Zooplankton Ecology. John Wiley and Sons, New York.
[21] Newell, R.C. (1979). Biology of intertidal organisms, 3rd ed. Marine Ecological Surveys, Ltd., Kent, ix + 781. https://doi.org/10.4319/lo.1980.25.2.0383
[22] Rahman, M.A., Lee, S.G., Molla, M.H.R., Asare, O.E., Megwalu, F., Jahan, B., Shaikh, M.M. (2018). Fisheries management and governance in Bangladesh. MOJ Ecology & Environmental Sciences, 3(6): 381-385. https://doi.org/ 10.15406/mojes.2018.03.00117
[23] Rahman, M.B., Hoque, M.S.Z., Rahman, M.M., Nahar, A. (2017). Exploration of fishing gear and fisheries diversity of Agunmukha River at Galachipa Upazila in Patuakhali District of Bangladesh. Iranian Journal of Fisheries Sciences. 16(1): 108-126. http://hdl.handle.net/1834/12147
[24] Ghosh, S.K., Ahsan, M.K., Ahmmed, M.K., Ahmed, S.I., Hasan, M.M., Kamal, M. (2016). Catch assessment of artisanal marine fishing gears in Cox s Bazar and Teknaf of Bangladesh. Progressive Agriculture, 27(2): 228-234. https://doi.org/10.3329/pa.v27i2.29335
[25] Schoknecht, U., Mathies, H., Wegner, R. (2016). Biocide leaching during field experiments on treated articles. Environmental Sciences Europe, 28: 1-10. https://doi.org/10.1186/s12302-016-0074-9
[26] Uddin, M.A., Karim, S.R., Halim, K.A., Ali, M.N., Hasanuzzaman, K.M., Rahmatullah, S.M. (2021). Investigation on species abundance by catch per unit effort (CPUE) in Chalan Beel, Bangladesh. International Journal of Fisheries and Aquatic Studies, 9(5): 56-63. https://doi.org/10.22271/fish.2021.v9.i5a.2566
[27] Vermeirssen, E.L., Dietschweiler, C., Werner, I., Burkhardt, M. (2017). Corrosion protection products as a source of bisphenol A and toxicity to the aquatic environment. Water Research, 123: 586-593. https://doi.org/10.1016/j.watres.2017.07.006
[28] Weiler, L., Vollpracht, A. (2020). Leaching of carbon reinforced concrete-Part 1: Experimental investigations. Materials, 13(19): 4405. https://doi.org/10.3390/ma13194405