Massimiliano Lega*![]() | Gabriele Medio | Vincenzo Severino | Marco Casazza
| Gabriele Medio | Vincenzo Severino | Marco Casazza![]() | Theodore Endreny
| Theodore Endreny![]() | Roberta Teta
| Roberta Teta![]()
© 2024 The authors. This article is published by IIETA and is licensed under the CC BY 4.0 license (http://creativecommons.org/licenses/by/4.0/).
OPEN ACCESS
Detecting and managing coastal water pollution is crucial for preserving ecological functions and ecosystem services. However, it is challenging due to the complex nature of the coastal environment, large spatio-temporal scales, and high operational costs. To improve situational awareness, this study used a top-down approach, integrating multi-spectral data from satellites and drones with different resolutions. By combining these data sources, the researchers obtained complementary results and were able to focus on the same phenomenon from multiple perspectives. The study successfully applied this approach to monitor a polluted water plume in the Domitia coast, Italy, originating from wastewater plants and illicit discharges. The results confirmed the effectiveness of the proposed method in assessing water quality and increasing situational awareness in coastal areas. Implementing this approach can aid in the proper management of water resources.
environmental impact assessment, coastal waters, pollution, situational awareness, multiscale analysis, multispectral analysis
The coastal areas regulate the circulation of critical ecological, economic and social processes, while providing several ecosystem services for the benefit of humans and the whole biosphere [1, 2]. Anthropogenic stressors exert adverse influence on these processes. Among them, pollutant discharges into water bodies, which can include organic matter, synthetic organic compounds (e.g., PCBs and pesticides, such as DDT and residues), microorganisms, nutrients (mainly nitrogen and phosphorus), oil, waste, heavy metals, radionuclides, and so on, cause a great concern due to their impact [3-5].
Due to the complex evolutionary dynamics of coastal environments, the appropriate coastal management is required for the preservation of these areas, their functionality and ecosystem services. Adequate management practices are rooted in informed decision-making processes. These processes rely on the availability of data, which must be characterized appropriately. The characteristics of the data depend both on the phenomenon of interest and on the purpose and final use of the collected data. Conventional in-situ observational methods are characterized by their low sampling frequency due to the high cost of experimental field observations. However, these observations are often inadequate to provide sufficient details about the complexity of environmental variables and to capture short-duration events, such as pollutant releases. The introduction and implementation of advanced monitoring techniques improve the situational awareness of complex scenarios and provide suitable means for the investigation of different phenomena along coastal zones [6]. For example, the combined use of sensors mounted on remote and proximal platforms within hierarchical monitoring techniques and procedures can be integrated to produce different information layers, which can be represented within a GIS environment [7, 8]. The obtained geographical representations, based on the collection of data with different spatio-temporal resolutions, can be focused on different aspects, based on the elaboration of available data, leading to the extraction of complementary information having multiple resolution levels [8-11].
The available technological improvements, enabling the remote and proximal observations of the biosphere parameters, have allowed for enhance the use of bioindication to detect the vulnerability of ecosystems and the impacts generated by pollutants [12-14]. Some studies proved the effectiveness of proximal sensing in the biomonitoring of algal blooms in coastal areas [15, 16]. In particular, a higher proximity to the surface water bodies allowed to spatially extend the validity of in situ biomonitoring and to increase the spatial resolution of satellite multispectral observations of potentially harmful exposure to algal blooms, while enhancing the quality of management and mitigation actions [17-19].
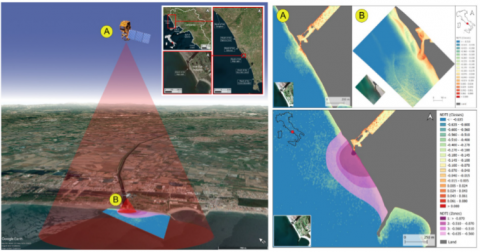
The aim of this work is to integrate different multispectral data into a multiscale and multi-layered hierarchical structure to generate augmented information, used to support the environmental impact and risk assessment in relation to the discharge of polluted internal water bodies into coastal waters (as shown in Figure 1).
In particular, the impacted area was observed through a multilayer analysis, based on the use of data collected from a multispectral sensor mounted on an Unmanned Aerial Vehicles (UAVs), otherwise known as a drone system. In this study, the sensors mounted on UAVs acted as a bridge, producing data that served as a link layer between satellite and in situ field data. The novelty of the proposed integration, based on the use of proximal sensing, consists in the reduced need of frequent field monitoring campaigns, positively impacting the operational costs of part of the environmental management routine operations. The elaboration of multi-spectral data, through the classification and ranking of multi-spectral indices related to the response of bioindicators to the different concentration of pollutants in coastal water bodies, allowed for the quantify the spatial extension and variability of the impact related to the discharges of pollutants.
The research was applied to the area of Regi Lagni channel, in the Domitia coast (Campania Region, Southern Italy). The site was chosen for its publicly known problems concerning the efficiency of an existing wastewater treatment plant, whose receiving water body is Regi Lagni. These problems were also evidenced by several police investigations that revealed the existence of illegal wastewater discharges into the same network of channels. On the other hand, the choice was motivated by the large spatial and temporal variability characterizing, especially, the illegal discharges. This reduces the representativeness of routinely river and coastal water quality monitoring activities, characterized by a low sampling frequency (once a month or less), further motivating the need for a different observational approach.
2.1 Techniques and technologies
2.1.1 Spectral indices
This study is based on the calculation and spatial analysis of the values related to two different multi-spectral indices, derived from the combination of reflectance channels in different frequency bands. In particular, this work considered the Normalized Difference Vegetation Index (NDVI) and the Normalized Difference Turbidity Index (NDTI).
The NDVI, which identifies of the vegetational status of photosynthetically-active organisms, being related to the surrounding environmental conditions [20], is also applied to provide indirect insight on pollution phenomena [21-23]. Combining the reflectance values of the red (RRED) and near infrared (RNIR) spectral bands, the NDVI is calculated as:
$N D V I=(R N I R-R R E D) /(R N I R+R R E D)$ (1)
Being sensitive to the algae and bacteria (e.g., cyanobacteria) photosynthetic activity, the NDVI indicates the presence of eutrophication effect, which is an enhanced supply of nutrients transported by contaminated water or wastewater.
The NDTI is correlated with the turbidity of the water bodies [24-26]. Depending on the dispersion and absorption of light caused by the presence of suspended particles, higher values of the NDTI are related to a higher turbidity. The NDTI index, combining the reflectance values of the red (RRED) and green (RGREEN) spectral bands, is calculated as:
$N D T I=(R R E D-R G R E E N) /(R R E D+R G R E E N)$ (2)
Table 1. Characteristics of Sentinel-2 (S2A & S2B) radiometric sensors
|
Band Number |
Spatial Pixel Resolution (m) |
Central Wavelength (nm) |
Bandwidth (nm) |
Description |
||
|
S2A |
S2B |
S2A |
S2B |
|||
|
1 |
60 |
442.7 |
442.3 |
21 |
21 |
Ultra blue |
|
2 |
10 |
492.4 |
492.1 |
66 |
66 |
Blue |
|
3 |
10 |
559.8 |
559.0 |
36 |
36 |
Green |
|
4 |
10 |
664.6 |
665.0 |
31 |
31 |
Red |
|
5 |
20 |
704.1 |
703.8 |
15 |
16 |
VNIR |
|
6 |
20 |
740.5 |
739.1 |
15 |
15 |
VNIR |
|
7 |
20 |
782.8 |
779.7 |
20 |
20 |
VNIR |
|
8 |
10 |
832.8 |
833.0 |
106 |
106 |
VNIR |
|
8a |
20 |
864.7 |
864.0 |
21 |
22 |
VNIR |
|
9 |
60 |
945.1 |
943.2 |
20 |
21 |
SWIR |
|
10 |
60 |
1373.5 |
1376.9 |
31 |
30 |
SWIR |
|
11 |
20 |
1613.7 |
1610.4 |
91 |
94 |
SWIR |
|
12 |
20 |
2202.4 |
2185.7 |
175 |
185 |
SWIR |
The spatial representation of this index highlights the influx of turbid water plumes into receiving water bodies, such as coastal waters.
2.1.2 Platforms and sensors for remote and proximal sensing
Through a hierarchical monitoring approach, integrating the data collected from different sensors mounted on platforms, it is possible to analyse the same phenomenon at different spatial and temporal scales, producing complementary results that can be integrated, producing an enhanced information.
This study integrated the use of sensors mounted on satellite (in particular, the Sentinel-2 twin satellites, 2A and 2B) and on an unmanned aerial vehicle (UAV). The UAV was a DJI Mavic 2 Pro drone.
The spectral channels of the multi-spectral radiometric sensors mounted on Copernicus Sentinel 2 mission satellites are listed in Table 1.
The DJI Mavic 2 Pro drone was equipped with a RGB camera, fully-stabilized by a three-axis gimbal. The standard camera, used for this study, being provided with the drone, has a 1-inch CMOS sensor, developed in collaboration with Hasselblad, being able both to record videos in 4K and to acquire 20-megapixel pictures. In addition, the drone was equipped with a Survey 3 multispectral camera with a wide-angle lens (Survey3W), produced by MAPIR. The multispectral camera mounts a Sony Exmor R IMX117 12MP (Bayer RGB) sensor customized with an “orange, cyan, near-infrared” (OCN) filter. The OCN filter spectral band transmission percentage with respect to the wavelength is represented in Figure 2.
Figure 2. Transmission of OCN filter across 350-1100 nm wavelengths
Survey3 data were calibrated through MAPIR Camera Control (MCC) software using the MAPIR Camera Reflectance Calibration Ground Target Package, containing a target consisting of 4 surfaces characterized by known reflectance curves. Before a measure campaign, the target radiometric measure must be acquired under the same light conditions, avoiding the presence of shadows or debris.
This work integrated the use of two cameras mounted on the same proximal platform. In particular, the “red green blue” (RGB) and the multispectral ones. Combined, the two cameras allowed the detection of six different spectral bands. The NDTI was calculated through the radiometric data of the RGB camera, while the NDVI was through the MAPIR multispectral camera bands. At the maximum altitude of about 350 meters, the pixel spatial resolution of the UAV-mounted cameras was in the order of 10 cm.
2.1.3 Software
The Sentinel 2 mission imageries were freely downloaded from the ESA Copernicus Open Access Hub. The images collected from Survey3 camera, mounted on the UAV, were processed through the MAPIR Camera Control (MCC) software, combining the RAW and JPG files into a georeferenced TIFF image. Remote and proximal sensing data were integrated, then, through QGIS software, using the available raster calculator to obtain the desired multispectral indices. Then, QGIS was used to classify the obtained georeferenced values of the NDVI and the NDTI and to give a spatial representation of these ranked data through a false colour scale. The final result, consisting of a set of maps, allows for the enhancement the relevant parameters details for the region of interest (study area) of this study.
2.2 Study area
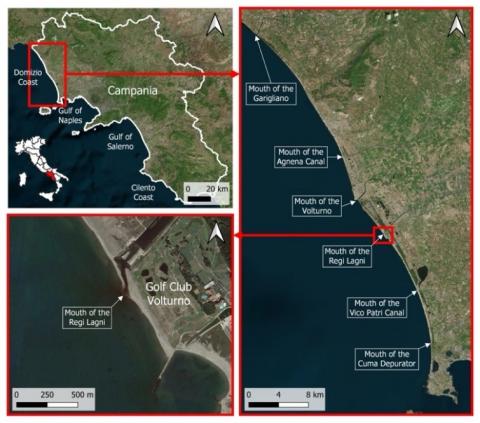
The Regi Lagni channels network, selected as a case study, is located in the Domitia coast area (Campania Region, S Italy) and covers an area of 1095 km2 (Figure 3). The canalization works started in the Roman age and, then, underwent a major reorganization during the Spanish Viceroyalty in the early 1600s. A further sanitary reorganization of the area became necessary after the cholera infection in 1973, when many of the drainage channels were used for the collection and sewage treatment processes. In particular, five large water treatment plants were built, using the Regi Lagni channel network as a receiving water body. These works were supposed to solve the existing wastewater sanitation problems and to improve the quality of coastal waters.
Figure 3. Overview of the Regi Lagni Area in Campania, Southern Italy, with enlarged views of Domitia Coast and channel network outlet
Despite these actions, several problems concerning the impacts of wastewater collection and treatment process are still evident [27]. Furthermore, some recent police investigations revealed the direct release of toxic waste and the illegal discharge of wastewater into the Regi Lagni [28]. Consequently, the coastal segment near the mouth of Regi Lagni, located in the Municipality of Castelvolturno, is one of the most polluted areas of the Domitia coast.
2.3 Procedure
The study was conducted following our monitoring strategy [6, 15] applying a top-down spatial approach. In particular, data from remote platforms were later integrated with proximal sensing data, both including the same region of interest. An initially larger view allowed the detection of the existing anomalies in the quantified multi-spectral indices. Then, the outcome of the preliminary analyses supported the planning of drone flights, concentrating on the area of the Regi Lagni mouth, in the municipality of Castel Volturno (Caserta province, Campania region). Flight parameters were planned to become coincident with passage dates of the Sentinel 2 satellites, while the final flight date was selected from the possible ones to have the most favourable weather conditions, especially considering the presence of a low cloud cover. For this reason, weather data were obtained from the Grazzanise airport meteorological station. The day that met most of the required conditions was September 24th, 2021, which was chosen to perform the UAV flight. Details on the weather key parameters on September 24th, 2021 are reported in Table 2.
Table 2. Weather data provided by the meteorological station of Grazzanise airport (CE) in the Southern coast of Italy
|
Medium Temperature |
Minimum Temperature |
Maximum Temperature |
Dew Point |
Average Humidity |
|
20℃ |
13℃ |
27℃ |
13℃ |
68% |
|
Minimum humidity |
Maximum humidity |
Average pressure above sea level |
Phenomena |
Weather conditions |
|
34% |
100% |
1020mb |
Nothing |
Clear |
Consequently, a detailed flight plan was programmed through the DJI Ground Station Pro (DJI GS PRO) application. Finally, prior to take-off, standard checks were performed to guarantee the flight and data collection operations.
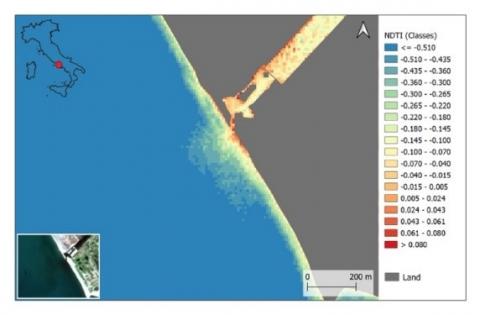
The Sentinel-2 data were processed to obtain the NDTI for September 24, 2021. The purpose of such an elaboration was to characterize the spatial extent of the pollution plume around the region of interest. The pixel resolution for this index was 10 m. Then, the NDTI values were ranked into 18 classes using the QGIS software. Data were mapped accordingly through a false colour map. Land, instead, was coloured in grey. The obtained map is provided in Figure 4.
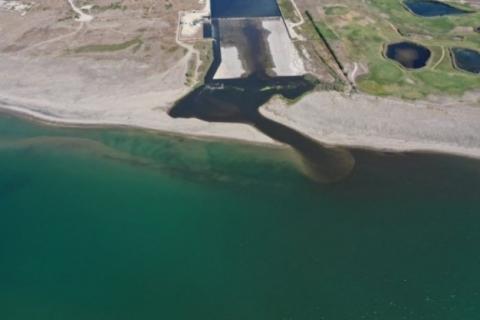
The RGB camera images, captured during the drone flight, were downloaded, selected and processed. The available RGB images showed a distinguishable plume of a pollution discharge from the Regi Lagni drainage into the coastal waters (Figure 5).
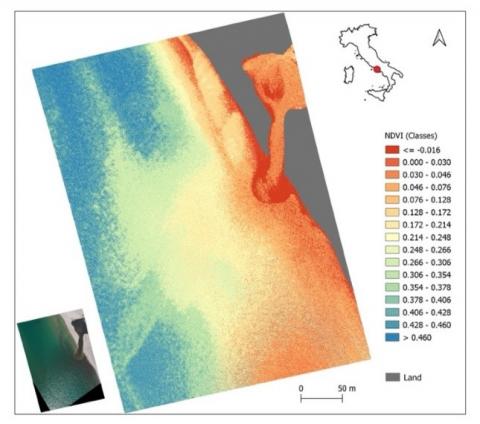
However, the spatial extension of the visible plume wouldn’t match with the one evidenced from Figure 4. Conversely, the elaboration of data obtained from the multispectral camera mounted on the UAV, applying the NDVI, allowed the identification of a much larger area, overlapping with that in Figure 6. In particular, the NDVI data, mapped in false colour scale after their subdivision into 16 classes, are represented in Figure 5. Moreover, the pixel resolution of Figure 5 is increased to 10 cm, while, if considering Sentinel-2 mission derived maps, the pixel resolution was of 10 m. Thus, the new images collected from a proximal sensing platform provide a higher level of detail than those from a remote sensing platform (i.e., satellite).
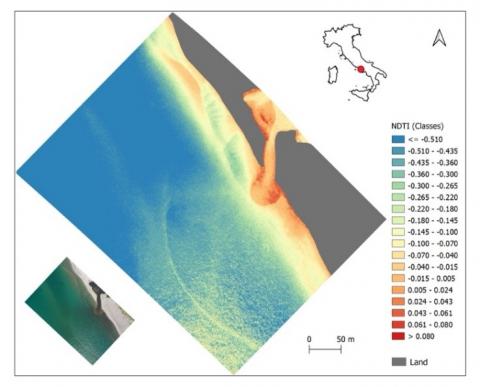
By applying the NDTI algorithm to the image collected through the drone multispectral camera, it was possible to observe the extension of the discharge plume (Figure 7). In particular, subdividing the NDTI values into 18 classes, it was possible to obtain a very detailed false colour map, providing a clearer delimitation of the plume extension.
Figure 4. False colour NDTI map of Tyrrhenian Sea Inlet with Regi Lagni Channel Mouth, derived from Sentinel 2 data (Sept. 24, 2021)
Figure 5. NDVI False Colour Map of Regi Lagni Channel Mouth from Survey3 Sensor (Sept. 24, 2021)
Figure 6. DJI MAVIC 2 Pro RGB image of turbid water plume at Regi Lagni Channel Mouth (Sept. 24, 2021)
Figure 7. Ranked NDTI false colour map of Regi Lagni Channel Mouth from Survey3 Sensor (Sept. 24, 2021)
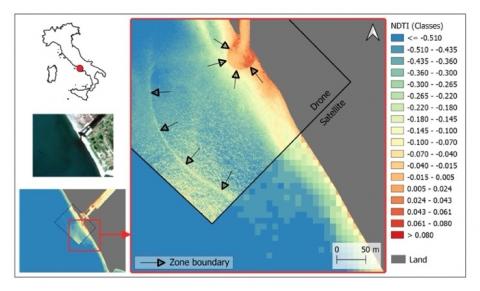
The two originally distinct hierarchical monitoring levels, originated from the remote and proximal sensing platforms, can be combined through a data fusion by overlapping the data. In particular, the 10 m resolution NDTI derived from the satellite data collection and the centimetric resolution NDTI derived from the drone data were combined to produce enhanced information (Figure 8).
The new map allowed us to emphasize the spatial resolution differences between the data collected at two different hierarchical levels, providing a deeper insight into their relationships [29]. In particular, from a higher spatial resolution drone image, it was possible to accurately identify at least two areas of the plume. However, the outermost area cannot be fully defined if it is based solely on the high resolution image; at the same time, the processing of the satellite product gives us a broader view of the plume and an indication of its extension (Figure 9).
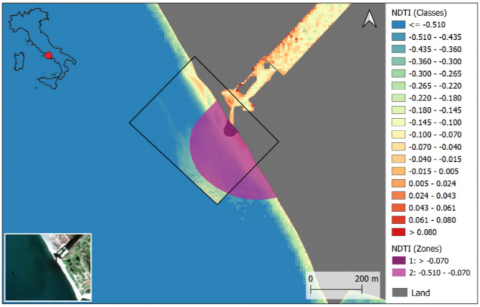
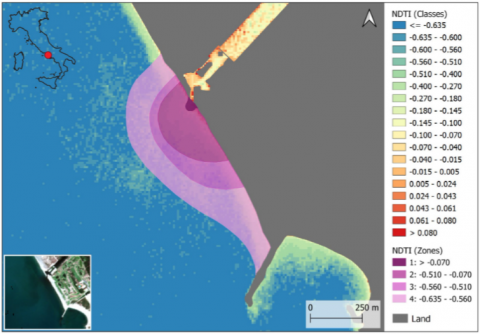
A particular classification of the NDTI values was applied to show the different sectors of the plume, as detected after the processing of the available imagery. While the remotely-sensed data allowed to define the plume extent, the higher-pixel resolution of proximally-sensed imageries allowed the definition of two zones, with a distinct water turbidity, also involving the proximity of the Regi Lagni drainage outlet into the coast (see Figure 10).
Figure 8. Combined Sentinel 2 and DJI Mavic 2 Pro NDTI map of Regi Lagni Mouth (Sept. 24, 2021)
Figure 9. Regi Lagni drainage mouth with monitoring zones delimitation
Figure 10. Geometric analysis of turbid water plume from Regi Lagni channels into Tyrrhenian Sea
By refining the classification of the NDVI index values, the fusion of satellite and drone data made it possible to identify a spatial extension of the major plume, as well as to divide it into different regions, characterized by different levels of turbidity (Figure 11).
Figure 11. Turbidity variations from NDTI fusion map with drone flight area and visible-range photo
The analysis derived from the satellite and drone data fusion relied on the application of a hierarchical monitoring approach. Such an approach allowed the reconstruction of the sub-regions of the plume of turbid waters discharged from the Regi Lagni channel network. The use of polygonal shapefiles, being available through the QGIS software, also allowed quantification of the spatial extent of the plume sub-regions and its total surface, amounting to 277,550 m2 (Table 3).
Table 3. Areal extension of the plume extent (m2) in the Italian coastal waters near Regi Lagni, as calculated through the QGIS software analysis
|
Extension of the Plume Surface (m2) |
||||
|
Zone 1 |
Zone 2 |
Zone 3 |
Zone 4 |
Total |
|
2087 |
66774 |
53360 |
155329 |
277550 |
This study showed how to create an integrated representation of multiscale data derived from the integration of remotely- and proximally-sensed multi-spectral radiometric data collected from different satellite and drone platforms. The application of a hierarchical monitoring approach allowed the integration of data with different spatial and temporal resolutions, benefitting from their different characteristics, to extract augmented information, later used to improve the situational awareness in a complex environmental scenario. In particular, this study concentrated on a preliminary assessment survey of the quality of coastal waters in order to characterize the extension of a polluted water plume in an extended region, thanks to the multi-scale, multi-layer and multi-spectral nature of collected data.
This study, where a top-down approach was applied, as one of the possible solutions of hierarchical monitoring, took advantage of the use of cyanobacterial blooms as biosensors, in order to assess their photosynthetic activity occurring in water bodies, depending on the different amount of available water pollutants as nutrients, as well as to other physical parameters (i.e.: water and air temperature, solar radiation). The photosynthetic activity was assessed through the calculation of the Normalized Difference Vegetation Index (NDVI). In parallel, the extension and spatial sub-division of the plume made it possible to identify the water turbidity levels, which were assessed using the Normalized Difference Vegetation Index (NDVI), being another multi-spectral index calculated from the collected multi-spectral data.
The elaboration and mapping of data, proving the effectiveness of the proposed experimental approach to environmental monitoring of bio-physical parameters, allowed us: a) to detect and identify the plume impacting the coastal area near the Regi Lagni drainage, and b) to define the plume extent and quantify its area in different concentrations of potential pollution.
The integration of proximal sensing platforms, such as drones, which can operate closest to the target, allow the obtaining of a higher spatial and temporal resolution (in terms of pixel resolution and potential frequency of measure repetition over the same region) with respect to satellite platforms, which, instead, guarantee a higher spatial cover for a single image. The availability of multi-spectral radiometers, that can be mounted on proximal platforms (e.g., UAV), having similar or identical frequency ranges, provides a link or bridge between in-situ sampling and satellite remote sensing.
This paper demonstrates that a multidisciplinary analysis, coordinating the use of remote and proximal sensing, can assess the environmental status of complex scenarios. In particular, this work enabled the quantification of the spatial impact of pollutant discharges through the quantification and multispectral classification of the spatial variation of pollutant concentrations.
Applying these results over statistically significant time intervals could improve the quality of information available to decision-makers while partially reducing the long-term monitoring operational costs, supporting the management and outcome of the technical processes for the classification and quality control of coastal waters [30].
This project was partly supported by the University of Naples Parthenope (Italy) under Bando di sostegno alla ricerca individuale.
[1] Liu, C., Liu, G.Y., Casazza, M., Yan, N.Y., Xu, L.Y., Hao, Y., Franzese, P.P., Yang, Z. (2022). Current status and potential assessment of China’s ocean carbon sinks. Environmental Science & Technology, 56(10): 6584-6595. https://doi.org/10.1021/acs.est.1c08106
[2] Yang, Q., Liu, G.Y., Hao, Y., Zhang, L.X., Giannetti, B.F., Wang, J.J., Casazza, M. (2019). Donor-side evaluation of coastal and marine ecosystem services. Water Research, 166: 115028. https://doi.org/10.1016/j.watres.2019.115028
[3] Smith, J.S., Winston, R.J., Tirpak, R.A., Wituszynski, D.M., Boening, K.M., Martin, J.F. (2020). The seasonality of nutrients and sediment in residential stormwater runoff: Implications for nutrient-sensitive waters. Journal of Environmental Management, 276: 111248. https://doi.org/10.1016/j.jenvman.2020.111248
[4] Wang, Y.F., Jie, F., Li., J.Y., Zhou, B.B., Wang, Q. (2021). Methodological framework for identifying sustainability intervention priority areas on coastal landscapes and its application in China. Science of The Total Environment, 766: 142603. https://doi.org/10.1016/j.scitotenv.2020.142603
[5] Liu, R.J., Pu, L., Zhu, M., Huang, S., Jiang, Y. (2020). Coastal resource-environmental carrying capacity assessment: A comprehensive and trade-off analysis of the case study in Jiangsu coastal zone, eastern China. Ocean & Coastal Management, 186: 105092. https://doi.org/10.1016/j.ocecoaman.2020.105092
[6] Lega, M., Casazza, M., Teta, R., Zappa, C.J. (2018). Environmental impact assessment: A multi-level, multi-parametric framework for coastal waters. International Journal of Sustainable Development and Planning, 13(8): 1041-1049. https://doi.org /10.2495/SDP-V13-N8-1041-1049
[7] Errico, A., Angelino, C.V., Cicala, L., Podobinski, D.P., Persechino, G., Ferrara, C., Lega, M., Vallario, A., Parente, C., Masi, G., Gaetano, R., Scarpa, G., Amitrano, D., Ruello, G., Verdoliva, L., Poggi, G. (2014). SAR/multispectral image fusion for the detection of environmental hazards with a GIS. In Earth Resources and Environmental Remote Sensing/GIS Applications V, 9245: 9-16. https://doi.org/10.1117/12.2066476
[8] Lega, M., Kosmatka, J., Casazza, M., De Maio, L., Severino, D., Teta, R. (2020). Environmental monitoring and assessment: A multi-scale and multiparameter case study in Campania Region (S Italy) on the recreational seawater quality evaluation. Regional Studies in Marine Science, 39: 101465. https://doi.org/10.1016/j.rsma.2020.101465
[9] Ferrara, C., Lega, M., Fusco, G., Bishop, P., Endreny, T. (2017). Characterization of terrestrial discharges into coastal waters with thermal imagery from a hierarchical monitoring program. Water, 9(7): 500. https://doi.org/10.3390/w9070500
[10] Lega, M., Endreny, T. (2016). Quantifying the environmental impact of pollutant plumes from coastal rivers with remote sensing and river basin modelling. International Journal of Sustainable Development and Planning, 11(5): 651-662. https://doi.org/10.2495/SDP-V11-N5-651-662
[11] Di Fiore, V., Cavuoto, G., Punzo, M., Tarallo, D., Casazza, M., Guarriello, S.M., Lega, M. (2017). Integrated hierarchical geo-environmental survey strategy applied to the detection and investigation of an illegal landfill: A case study in the Campania Region (Southern Italy). Forensic Science International, 279: 96-105. https://doi.org/10.1016/j.forsciint.2017.08.016
[12] Sieklicki, J., Bione, N.C.P., Oliveira-Filho, P.C.D., Souza, V.F.D., Martins, K.G. (2019). Relationships between land use and water quality obtained for the evaluation of genotoxic effects in plant bioindicators. Revista Ambiente & Água, 14. https://doi.org/10.4136/ambi-agua.2299
[13] Murray, N.J., Keith, D.A., Bland, L.M., Ferrari, R., Lyons, M.B., Lucas, R., Lucas, R., Pettorelli, N., Nicholson, E. (2018). The role of satellite remote sensing in structured ecosystem risk assessments. Science of the Total Environment, 619-620: 249-257. https://doi.org/10.1016/j.scitotenv.2017.11.034
[14] Appalasamy, M., Varghese, B., Sershen, Ismail, R. (2018). Examining the utility of hyperspectral remote sensing and partial least squares to predict plant stress responses to sulphur dioxide pollution: A case study of Trichilia dregeana Sond. South African Geographical Journal, 100(1): 22-40. https://doi.org/10.1080/03736245.2016.1231627
[15] Esposito, G., Teta, R., Marrone, R., De Sterlich, C., Casazza, M., Anastasio, A., Lega, M., Costantino, V. (2019). A Fast Detection Strategy for Cyanobacterial blooms and associated cyanotoxins (FDSCC) reveals the occurrence of lyngbyatoxin A in Campania (South Italy). Chemosphere, 225: 342-351. https://doi.org/10.1016/j.chemosphere.2019.02.201
[16] Teta, R., Esposito, G., Casazza, M., Zappa, C.J., Endreny, T.A., Mangoni, A., Valeria, C., Lega, M. (2019). Bioindicators as a tool in environmental impact assessment: Cyanobacteria as a sentinel of pollution. 14(1): 1-8. https://doi.org/10.2495/SDP-V14-N1-1-8
[17] Teta, R., Esposito, G., De Sterlich, C., Lega, M., Costantino, V. (2021). Early detection of cyanobacterial blooms and associated cyanotoxins using fast detection strategy. Journal of Visualized Experiments, 168: e61889. https://doi.org/10.3791/61889
[18] Teta, R., Sala, G.D., Esposito, G., Stornaiuolo, M., Scarpato, S., Casazza, M., Anastasio, A., Lega, M., Costantino, V. (2021). Monitoring cyanobacterial blooms during the COVID-19 pandemic in Campania, Italy: The case of Lake Avernus. Toxins, 13(7): 471. https://doi.org/10.3390/toxins13070471
[19] Teta, R., Romano, V., Della Sala, G., Picchio, S., De Sterlich, C., Mangoni, A., Di Tullio, G., Costantino, V., Lega, M. (2017). Cyanobacteria as indicators of water quality in Campania coasts, Italy: A monitoring strategy combining remote/proximal sensing and in situ data. Environmental Research Letters, 12(2): 024001. https://doi.org/10.1088/1748-9326/aa5649
[20] Rouse, J.W., Haas, R.H., Schell, J.A., Deering, D. W. (1974). Monitoring Vegetation Systems in the Great Plains with Erts. Nasa Scientific and Technical Publications, Washington.
[21] Rodriguez-Galiano, V.F., Luque-Espinar, J.A., Chica-Olmo, M., Mendes, M.P. (2018). Feature selection approaches for predictive modelling of groundwater nitrate pollution: An evaluation of filters, embedded and wrapper methods. Science of The Total Environment, 624: 661-672. https://doi.org/10.1016/j.scitotenv.2017.12.152
[22] Gu, X.H, Wang, L., Zhuang, W., Han, L.J. (2018). Reduction of wheat photosynthesis by fine particulate (PM2.5) pollution over the North China Plain. International Journal of Environmental Health Research, 28(6): 635-641. https://doi.org/10.1080/09603123.2018.1499881
[23] Zhou, M.G., Huang, Y.G., Li, G.L. (2021). Changes in the concentration of air pollutants before and after the COVID-19 blockade period and their correlation with vegetation coverage. Environmental Science and Pollution Research, 28: 23405-23419. https://doi.org/10.1007/s11356-020-12164-2
[24] Chen, X., Chen, W., Bai, Y.B., Wen, X.L. (2022). Changes in turbidity and human activities along Haihe River Basin during lockdown of COVID-19 using satellite data. Environmental Science and Pollution Research, 29: 3702-3717. https://doi.org/10.1007/s11356-021-15928-6
[25] Ehmann, K., Kelleher, C., Condon, L.E. (2019). Monitoring turbidity from above: Deploying small unoccupied aerial vehicles to image in‐stream turbidity. Hydrological Processes, 33(6): 1013-1021. https://doi.org/10.1002/hyp.13372
[26] Garg, V., Aggarwal, S.P., Chauhan, P. (2020). Changes in turbidity along Ganga River using Sentinel-2 satellite data during lockdown associated with COVID-19. Geomatics, Natural Hazards and Risk, 11(1): 1175-1195. https://doi.org/10.1080/19475705.2020.1782482
[27] Pica R. (2010). Capacità prestazionali dei depuratori operanti nel sistema idrio dei “Regi Lagni”. Roma: Enea. https://www.afs.enea.it/project/webenea/EAI/4-5_2012-PrimaParte.pdf.
[28] Persechino, G., Lega, M., Romano, G., Gargiulo, F., Cicala, L. (2013). IDES project: An advanced tool to investigate illegal dumping. WIT Transactions on Ecology and the Environment, 173: 603-614. https://doi.org/10.2495/SDP130501
[29] Medio, G., Severino, V., Teta, R., Endreny, T., Lega, M. (2022). Hierarchical monitoring of water quality: Coordinating the spatiotemporal resolution of multilayer and multispectral sensors to characterize pollution. WIT Transactions on Ecology and the Environment, 257: 3-15. 2022. https://doi.org/10.2495/WMEI220011
[30] Lega, M., Medio, G., Endreny, T., Esposito, G., Costantino, V., Teta, R. (2022). Attribution of pollution discharges in coastal waters during the Covid-19 lockdown using remote sensing and bioindicators. Ecology and the Environment. 257: 177-186. https://doi.org /10.2495/WMEI220151