Iwan Juwana![]() | Sinan Vidi Lazuardi
| Sinan Vidi Lazuardi![]() | Herdis Herdiansyah*
| Herdis Herdiansyah*![]()
© 2024 The authors. This article is published by IIETA and is licensed under the CC BY 4.0 license (http://creativecommons.org/licenses/by/4.0/).
OPEN ACCESS
Water governance becomes essential to meet societal needs despite water scarcity. However, in Indonesia, disparities in water governance, especially in the area of water quality perception, continue to exist. Therefore, this study investigates how water quality perception is influenced by examining key factors such as satisfaction, trust, and socio-economic status. This study was conducted in Jakarta by surveying through a questionnaire. This study employed satisfaction, trust, and socio-economic status as independent variables and the perception of water quality as a dependent variable. Also, the chi-square test and ordinal logistic regression were employed to test the hypothesis and the significance between independent and dependent variables. Chi-square tests reveal correlations between trust, socioeconomic status, and perception of water quality. However, regression analysis highlights socio-economic status and trust as the primary influential factors. The study provides evidence of unequal access to water across different socio-economic statuses and demonstrates how the need for government transparency and trust in water institutions affects urban communities' perceptions of water quality.
inequalities, socio-economic status, transparency, urban areas, water governance, water management policies
The preservation of water resources is paramount, serving as a fundamental necessity for sustaining human life and ensuring the well-being of future generations. This imperative gains significance amid escalating populations and rapid urbanization, intensifying water conservation issues [1]. Indonesia is a perfect example highlighting the criticality of water conservation, with escalating concerns over water sustainability. Data underscores these concerns, revealing a significant decline in water quality—a plunge from 72.77 to 52.62 in the Water Quality Index 2019 [2]. The drop in the water quality index in Indonesia has become a concern because it has become one of the driving factors of water scarcity, since deteriorating water quality could impede access to clean water [3]. Several studies show that water scarcity has negative impacts, such as public health risks due to potential bacterial contamination. Studies, such as one undertaken by Cronin et al. [4] in Jogjakarta, have revealed the relationship between contaminated water—infected with E. coli and Nitrate—and health risks, thereby impacting Sustainable Development Goals (SDGs). Additionally, another study indicates that water scarcity and pollution pose a high risk to sectors heavily dependent on water, such as agriculture, potentially causing substantial economic losses [5]. In addition, while there is a need for responsible water consumption to minimize water scarcity, polluted water sources caused by improper waste management have worsened the water scarcity in Indonesia [6]. Moreover, mismanagement in various sectors-such as agriculture, tourism, and manufacturing-exacerbates water scarcity concerns, necessitating robust water management policies to regulate sustainable water practices [6].
This study's significance is underscored by the wide-ranging ramifications of water dynamics, extending their influence across local and global contexts and addressing multifaceted issues that demand urgent resolution. Health-wise, contaminated water contributes to health problems and even impacts stunting rates among children due to inadequate access to safe drinking water and sanitation [7]. In addition to health considerations, water scarcity exerts extensive disruptive effects on economic-related issues [8], accounting for a staggering global economic loss of approximately 2.7 trillion US dollars [9]. Industries reliant on water face significant economic drawbacks due to water scarcity, as highlighted by Roson and Damania's findings [10], showcasing its adverse effects on economic activities and global economic inequalities.
Efforts to address water-related concerns, encompassing water security, equitable water allocation, and scarcity, demand urgent solutions. Neto [11] asserts that water governance efforts have been far below expectations, emphasizing the need for an integrated framework involving territorial and policy integration—an issue prevalent in Indonesia, where water access remains unequal, beset by fragmented water supply systems. The implementation of water governance necessitates inclusive planning to avoid reproducing vulnerabilities among urban and rural poor, as witnessed in flood risk management and water supply initiatives, exacerbating inequalities in water distribution [12]. Previous studies about the disparity of water governance with the inequality of clean water access and the vulnerability among urban and rural poor create a gap regarding the perception of clean water. Therefore, this study aims to fill this void by investigating factors influencing the perception of water quality, incorporating the roles of satisfaction with water institutions, trust in public water services, and socioeconomic status as independent variables in Indonesia. Incorporating variables contributes to evaluating the water governance in Indonesia’s urban areas regarding safe and clean water access.
1.1 Public satisfaction with water institution
Given the intricate interplay between formal and informal systems, institutions exert substantial influence over water resource management, with prior research advocating an analysis of informal institutions before policy reform [13]. Nevertheless, fragmented institutions pose coordination and funding challenges, prompting suggestions to centralize and unify these bodies, particularly in the face of climate change-induced uncertainties. Encouraging Integrated Water Resource Management and defining new legal instruments emerge as proposed solutions [14]. Conversely, Hurlbert and Mussetta [15] highlight that institutional rigidity in water governance can impede adaptive responses to water scarcity uncertainties. Participatory water governance, although innovative, encounters implementation barriers due to the weaker influence of community institutions compared to government bodies addressing local needs [16].
Satisfaction with water institutions emerges as a pivotal factor in effective water governance. Its influence lies in shaping participation, where satisfaction or dissatisfaction significantly impacts achieving good governance [17]. Satisfaction levels also crucially affect the effectiveness of water governance implementation by identifying stakeholder dissatisfaction, thereby shaping policies that influence livelihoods [18]. In addition, Nabiafjadi et al. [19] emphasize the role of water governance in safeguarding water rights and satisfaction while balancing environmental standards and economic growth, underscoring satisfaction as a significant factor in policy implementation, necessitating a balanced top-down and bottom-up approach.
Several studies have described the relationship between public satisfaction and water quality perception. A study by Delpla et al. [20] shows that general satisfaction water institutions become vital in shaping the perception of water quality of the public satisfaction components, namely odor, color, and taste. Also, another study shows the relation between satisfaction and perception of water quality caused by the role of satisfaction as a variable in measuring the quality of water provided to communities [21]. In addition, another reason for how satisfaction affects the perception of water quality has been emphasized by the study from Romano and Masserini [22], which shows that consumer satisfaction combined with organoleptic properties has influenced the estimation of water quality. However, another study in Italy regarding customer satisfaction and tap water quality shows that a lack of satisfaction by the customers with the water governing bodies needs an improvement not only on improving the water quality but also improving the general service provided [23].
1.2 Trust in water institution
Trust is a cornerstone of social capital, wielding considerable influence on the success or failure of implementing participatory systems within water governance [24]. Previous studies underscore trust's pivotal role in water governance, facilitating coordination and interaction among diverse stakeholders and critical in fostering better governance [25]. Consequently, trust should be a fundamental consideration in water governance as it significantly impacts the successful implementation of policies, fostering greater coordination through mutual trust among stakeholders.
However, trust necessitates transparency and accountability to flourish. Without these components, mistrust and barriers may hinder the implementation of water governance initiatives [26]. Therefore, enhancing trust becomes imperative, requiring governmental transparency and openness, including data disclosure, and fostering interactions among stakeholders through ICT to build trust and ensure participatory governance [27]. Transparency, particularly in data disclosure, is significant in cultivating trust, as lack can breed distrust among citizens. Trust also plays a pivotal role in achieving the goals of water governance by stimulating participation in water policies, thereby bolstering overall governance efforts [28]. Instances of water governance challenges stemming from trust issues are evident in studies like Fragkou and McEvoy's [29], highlighting distrust in water providers due to poor water quality, posing hurdles in resolving water scarcity and the distrust by public relates to water quality perception since distrust could be causing perceptual scarcity that change the water consumption behavior. In addition, several studies have strengthened the argument of the relationship between trust and water quality perception. A study by Guo et al. [30] shows that trust in the government positively correlated to the perception of water quality. When the trust level is high, the perception of water quality will be increased. Also, another study in the Lake Erie Basin by Shaffer-Morrison and Wilson [31] shows that trust becomes one of the significant predictors that could shape better local water quality perception by the communities with higher trust levels.
Aside from the relationship with water quality perception, trust also could assume significance in adapting to governance failures, especially in decentralized systems such as community-based water governance [32]. Therefore, prior research strongly emphasizes the pivotal role of trust in water governance, highlighting its potential to enhance governance while cautioning against its potential to hinder progress when communities lack trust in government initiatives.
1.3 Socio-economic factors
Previous studies on socio-economic factors in water governance highlight the need to consider micropolitics to account for the diverse socio-economic statuses influencing governance [33]. However, challenges persist in ensuring inclusivity within water governance policies, as some policies disproportionately affect lower-income households, as evidenced by Yates and Harris [34]. Achieving inclusive water governance requires a coordinated approach considering socio-economic conditions and environmental resources [35], demonstrating socio-economic factors as crucial considerations for policy inclusiveness.
Furthermore, socio-economic factors influence women's participation in community-based water management in decentralized water governance, as observed in studies such as Das [36]. Socioeconomic status significantly impacts household water security, with lower-status households experiencing higher levels of water insecurity than higher-status households [37]. Additionally, socio-economic factors intersect with water management in sectors like agriculture, influencing water management practices within this domain [38].
Regarding Sustainable Development Goal (SDG) No. 6, focusing on safe water and sanitation, the socio-economic development of countries plays a crucial role in achieving SDG 6's emphasis on equal access to water. Cai et al. [39] establish a correlation between a country's socio-economic condition and its ability to meet SDG 6, impacting water risk reduction and enhancing equality in human development. Moreover, socio-economic indicators help identify water supply and consumption inequalities, revealing disparities across different socio-economic strata [40].
The significance of socioeconomic status in water governance is highlighted by tendencies where higher socio-economic groups consume more water due to greater access, highlighting the need for inclusive water access [41]. However, socio-economic status also challenges water management, particularly for lower-income groups facing limited access to safe drinking water. This increases reliance on bottled water and poses coping strategy issues [42]. Also, those of lower socio-economic status tend to be exposed to lower-quality tap water, which could shape the perception of tap water [43]. The relationship between the perception of water quality and socioeconomic status has been described in several studies. A study by Pierce and Gonzalez [44] shows that household socioeconomic characteristics such as income and home ownership shaped the perception of water quality through increasing trust in their tap water being safe for consumption. In addition, another study by Turgeon et al. [45] in Canada shows that socio-economic factors become significant predictors that influence communities' perception of water quality through the perceived risk of their tap water, resulting in diverse perceptions of water quality.
These findings collectively emphasize the strong relationship between socio-economic factors and the implementation of water governance, impacting social, environmental, and economic aspects of water management. Meanwhile, previous studies also emphasize how socio-economic factors could influence the perception of water quality. Therefore, this study will employ socio-economic factors as one of the dependent variables. This study will use the range of income by the respondents, housing status, occupation, and education level as the indicators of socio-economic variables.
1.4 Perception of water quality
Access to clean water has become crucial to the implementation of water governance. A study by Haldar et al. [46] shows that the implementation of water reuse by the government to reduce water scarcity caused by climate change was affected by the perception of water quality. Perception becomes critical to implementing water governance because the OECD’s Water Governance Indicator was shaped through perception-based and fact-based [47]. Therefore, from a theoretical perspective, perception plays a vital role in the implementation of water governance, and the previous study shows the empirical aspects of how perception affects the implementation of water governance.
However, water consumption is related to the perception of water quality since the usability of water for human consumption could shape the perception of water quality [48]. Another study by Ko and Sakai [49] explains that the perception of water quality becomes the main factor of water consumption behavior because the perception of water quality shapes the decision to consume water. In addition, the perception of water quality has influenced tap water consumption by decreasing and increasing bottled water consumption [50].
Assessing the impact of water governance implementation crucially involves examining water consumption patterns to identify existing problems. A study by Debnath et al. [51] shows that the perception of safe water by Chattogram citizens has demonstrated the need for the government to improve the water quality. Also, a study by Okumah and Yeboah [52] shows that the perception of the public regarding water quality issues becomes vital in shaping water governance from the top-down perspective since the perception from the public could be used as feedback to the government on improving the water quality. The perception of water quality by the public becomes essential because the perception of water quality by the public leads to participation and collaboration in implementing water governance, especially in the decentralized water governance system that relies on the community’s involvement [53]. These findings collectively demonstrate that water consumption is a critical indicator in water governance, influencing decision-making processes and serving as a key metric for assessing the effectiveness of implemented water governance systems.
This study adopts a quantitative methodology employing a survey-based approach to investigate related factors. It aims to explore relationships among three independent variables and one dependent variable. The independent variables encompass satisfaction levels with water institutions, trust in Indonesian water institutions, and socio-economic status. The focal point of analysis rests upon the dependent variable: perception of water quality. The hypotheses formulated for this study are as follows:
H1: There is a relationship between satisfaction with water institutions and perception of water quality.
H0: No relationship exists between satisfaction with water institutions and perception of water quality.
H1: There is a relationship between trust and perception of water quality.
H0: There is no relationship between trust and perception of water quality.
H1: There is a relationship between socio-economic status and perception of water quality.
H0 There is no relationship between socio-economic status and perception of water quality.
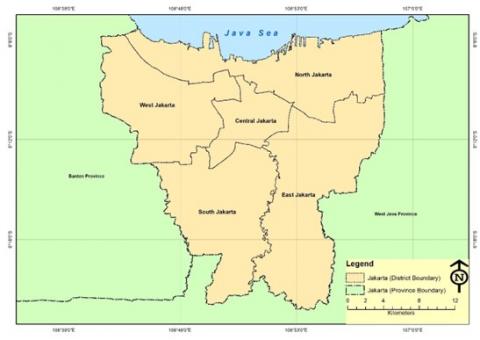
The data collection involved a survey employing simple random sampling of households in Jakarta, totaling 434 samples (Figure 1). Jakarta, being Indonesia's capital, boasts diverse socio-economic aspects. This study aims to investigate urban water issues in Jakarta, one of the most populated regions in Indonesia, with around 10 million people residing in Jakarta and prompted by the city's water quality index, which stood at 42.73 in 2020—one of the lowest indices in Indonesia [54]. With the 95% confidence (0.05 standard error) combined with the population of Jakarta, which was around 10 million people [54], 434 samples were enough to represent the population of Jakarta. The survey utilized a questionnaire with ordinal responses. Some variables in the questionnaire consist of 3 point ordinal scale and 5 point ordinal scale. However, the socio-economic status was measured from income, housing status, and education level. These variables will be computed in SPSS from the question of each variable. Also, from the calculated data in each variable, the result of the data will be categorized into low, middle, and high groups across all variables. The grouping into three categories (low, middle, and high) will be based on the interquartile range of the data from each variable (low = 1st quartile, Middle = 3rd quartile - 1st quartile, and High = 3rd quartile). Since the parametric analysis was based on linearity and the ordinal response was not according to linearity, this study using nonparametric analysis using chi-square tests within 3x3 crosstabs and Somers'D correlations was employed to explore associations between independent and dependent variables. Subsequently, ordinal logistic regression was used to predict interactions between these variables. Although the dependent variable has limitations in estimating household water consumption, Fuks and Salazar [55] propose solutions using ordinal logistic regression to overcome these limitations. Additionally, studies suggest that employing ordinal logistic regression is appropriate for dependent variables measured on an ordinal scale, cautioning against treating ordinal scales as continuous or normally distributed [56, 57]. These studies support the rationale behind employing ordinal regression in this investigation.
Figure 1. Geographical area of Jakarta
3.1 Descriptive statistics
Based on the data presented in Table 1, it is apparent that a sizeable portion of respondents, constituting 45.9%, reported having a low satisfaction level with water institutions. Conversely, 30% of respondents expressed middle satisfaction levels, while 24.2% indicated high satisfaction with water institutions. Also, based on the data presented in Table 1, it is evident that a substantial majority of respondents, comprising 53.9%, reported having a middle level of trust in water institutions. Additionally, 24% of respondents expressed a high level of trust, while 22.1% indicated a moderate level of trust in water institutions. Furthermore, on the data provided in Table 1, most respondents, accounting for 44%, reported having a low-level perception of water quality. Additionally, 41.5% of the respondents indicated a middle perception of water quality, while 14,5% reported having a high perception of water quality. In addition, the socio-economic status group from the table above (Table 1) shows the respondents were coming from middle socio-economic status at 55.5%, low socioeconomic status at 27.2%, and the lowest was the high socio-economic status group at 17.3%.
Table 1. Descriptive statistics of variables
|
Variables |
Low |
Middle |
High |
|
Satisfaction with Water Institution |
45.9% |
30% |
24.2% |
|
Trust in Water Institution |
22.1% |
53.9% |
24% |
|
Perception of Water Quality |
44% |
41.5% |
14.5% |
|
Socio-economic Status |
27.2% |
55.5% |
17.3% |
3.2 Chi-square test
Table 2 shows that among respondents with a low perception of water quality, the majority, constituting 52.3%, reported having a middle satisfaction level with water institutions. Meanwhile, respondents in the middle perception of water quality have low satisfaction with water institutions by 45.2%. In addition, those with a high perception of water quality have middle satisfaction with water institutions by 15.4%.
Table 2. Crosstabulation between satisfaction with water institutions and the perception of water quality
|
|
Satisfaction with Water Institution |
Total |
|||
|
Low |
Middle |
High |
|||
|
Perception of Water Quality |
Low |
39.7% |
52.3% |
41.9% |
44% |
|
Middle |
45.2% |
32.3% |
45.7% |
41.5% |
|
|
High |
15.1% |
15.4% |
12.4% |
14.5% |
|
|
Total |
100% |
100% |
100% |
100% |
|
Table 3. Crosstabulation between trust in water institutions and perception of water quality
|
|
Trust in Water Institution |
Total |
||||
|
Low |
Middle |
High |
|
|||
|
Perception of Water Quality |
Low |
55.2% |
44.4% |
32.7% |
44% |
|
|
Middle |
29.2% |
41.9% |
51.9% |
41.5% |
||
|
High |
15.6% |
13.7% |
15.4% |
14.5% |
||
|
Total |
100% |
100% |
100% |
100% |
||
Table 3 shows that most respondents with a low perception of water quality have low trust in water institutions, accounting for 55.2%. In the middle perception of water quality, most respondents reported having high trust in water institutions by 51.9%. In addition, respondents with an increased perception of water quality have low trust in water institutions by 15.6%.
Table 4. Crosstabulation between socio-economic status and perception of water quality
|
|
Socio-economic Status |
Total |
|||
|
Low |
Middle |
High |
|||
|
Perception of Water Quality |
Low |
6.8% |
63.5% |
40% |
44% |
|
Middle |
62.7% |
28.2% |
50.7% |
41.5% |
|
|
High |
30.5% |
8.3% |
9.3% |
14.5% |
|
|
Total |
100% |
100% |
100% |
100% |
|
Table 4 shows that among respondents with a low perception of water quality, the majority, comprising 63.5%, belonged to the middle socio-economic group. For respondents with a moderate perception of water quality, the majority, accounting for 62.7%, came from the lower socio-economic status group. Furthermore, among respondents with a high perception of water consumption, the majority, at 30.5%, were from the low socio-economic status group.
Table 5 summarizes the chi-square test results and the Somers’ D association test. The satisfaction variable with the perception of water quality shows a chi-square test of 7.185. However, since the Asymp. Sig (p-value) was more than .050 (.126>.050), and it is concluded that there is no relationship between satisfaction with water institutions and perception of water quality. This lack of relationship can be attributed to the p-value for the variable of satisfaction in water institutions with perception of water quality being more than .050, indicating statistical insignificance.
Table 5. The summary of chi-square and Somers’D value
|
Independent Variables |
Perception of Water Quality (Dependent Variable) |
|||
|
Chi-Square Value |
Asymp. Sig. |
Somers’D Value |
Approx. Sig. |
|
|
Satisfaction |
7.185 |
.126 |
-.041 |
.326 |
|
Trust |
12.275 |
.015 |
.113 |
.010 |
|
Socio-economic Status |
111.380 |
.000 |
-306 |
.000 |
As for the relationship between trust in water institutions and water consumption (Table 5), the chi-square test (12.275) indicates a significant association between trust in water institutions and water consumption (Asymp. Sig. = .015 < .050), implying a notable relationship. Yet, the Somers'D value (.113) demonstrates a very weak association, but it was statistically significant (.010 < .050), allowing for these results to be generalized to the population. Further, statistical analysis shown in Table 5 by the chi-square test of 115.902 confirmed a significant association between socio-economic status and water consumption (Asymp. Sig. = .000 < .050), rejecting the null hypothesis. The Somers'D test (-.306) revealed a weak negative association, suggesting that an increased socio-economic status could lead to decreased water consumption. Notably, the Somers'D test was statistically significant (.000 < .050), allowing these results to be generalized to the population. These analyses demonstrate varying degrees of association between different variables and perceptions of water quality, emphasizing significant associations between perceptions of water quality, trust in water institutions, and socio-economic status. However, caution is advised in when interpreting the Somers'D test results due to their weak and statistically insignificant associations.
3.3 Regression analysis
Following the chi-square test analysis detailed in Table 5, which aimed to predict the relationship between the dependent and independent variables and determine their significance, this study intends to explore this relationship further using ordinal regression analysis. The ordinal regression will provide a more nuanced estimation of the importance and association between the independent and dependent variables.
Table 6. Omnibus test
|
Likelihood Ratio Chi-square |
Df |
Sig. |
|
116.866 |
4 |
.000 |
As indicated in the preceding table (Table 6), the omnibus test reveals a likelihood ratio chi-square value of 116.866, demonstrating statistical significance (p < .050), thereby rejecting the null hypothesis. This test, serving as a likelihood-ratio chi-square evaluation of the current model against the null model, further validates the results' significance.
Following the findings in Table 7, trust and socioeconomic status were the significant variables according to the regression result. Table 7 shows that the low socio-economic status group is 1.563 (Sig value = .000 < .050), meaning that people with low socio-economic status tend to exhibit a higher perception of water quality than those with higher socio-economic status. Also, Table 7 indicates that the odds ratio (OR) for socio-economic status is 4.773, suggesting that for each unit increase in socio-economic status, the odds of a higher perception of water quality multiply by approximately 4.773 times. However, in the middle categories of socioeconomic status (Table 7), it is -.850 (Sig. value = .001 < .050), which means people with middle socio-economic status tend to exhibit a lower perception of water quality compared to those with higher socio-economic status. In addition, the odds ratio (OR) is .428, which means that for every unit increase in socioeconomic status, the odds of increasing perception of water quality will decrease if the socio-economic status is low.
Table 7. Ordinal regression result
|
Parameter |
Estimates |
Std. Error |
Hypothesis Test |
Odd Ratio |
|||
|
Wald Chi-Square |
Df |
Sig. |
|||||
|
Threshold |
[Perception=1.00] |
-.667 |
.2784 |
5.738 |
1 |
.017 |
.513 |
|
[Perception=2.00] |
1.883 |
.3056 |
37.976 |
1 |
.000 |
6.573 |
|
|
[Socio-economic Status=1.00] |
1.563 |
.2959 |
27.910 |
1 |
.000 |
4.773 |
|
|
[Socio-economic Status=2.00] |
-.850 |
.2596 |
10.709 |
1 |
.001 |
.428 |
|
|
[Socio-economic Status=3.00] |
0 |
|
. |
. |
. |
1 |
|
|
[Trust=1.00] |
.718 |
.2851 |
6.345 |
1 |
.012 |
.488 |
|
|
[Trust=2.00] |
.284 |
.2283 |
1.549 |
1 |
.213 |
.753 |
|
|
[Trust=3.00] |
0 |
|
. |
. |
. |
1 |
|
|
(Scale) |
1 |
|
|
|
|
|
|
Also, trust was a significant predictor variable in the regression analysis. Table 7 shows that the low category of trust is .718 (Sig. value = .012 < .050), which means people with a low level of trust tend to exhibit a higher perception of water quality than those with a higher trust level. However, the odds ratio was .488, which means that for every unit increase in trust level, the odds of increasing perception of water quality will decrease. An OR value exceeding one would indicate a greater likelihood of increased perception of water quality among individuals with lower and middle socio-economic status and those with lower trust in water institutions. This underscores the pivotal role of socioeconomic status and trust levels in shaping the perception of water quality, implying that lower and middle socioeconomic and low trust correlates with a higher propensity for increased perception of water quality.
The chi-square test demonstrated relationships between all independent and dependent variables (Table 5). However, Somers’D test, a measure of the relationship between independent and dependent variables, identified only socio-economic status and Trust as significantly related. Moreover, the subsequent ordinal regression analysis (Table 7) highlighted socio-economic status and trust as the significant predictors. These findings reveal that disparities in socio-economic status and trust play a pivotal role in shaping the perception of water quality, aside from existing inequalities linked to socio-economic status.
The argument to support the finding can be found in research by Yates and Harris [34], emphasizing the challenges in policy implementation concerning water management for different socio-economic status groups. Furthermore, evidence from China indicates that lower socio-economic development contributes to a higher per capita blue water footprint, exacerbating water scarcity [58]. Additionally, studies suggest that higher socio-economic growth strains water resources due to increased population growth, leading to imbalances in water supply and demand [59]. Also, the regression analysis in Table 7 implies that lower and middle socio-economic status correlates with higher water consumption. Therefore, socio-economic status becomes one factor in shaping the perception of water quality. Previous studies show that socio-economic status affects the perception of water quality.
Trust becomes a leading factor in shaping the perception of water quality. Consequently, this study underscores the necessity for inclusive water governance policies considering socio-economic status groups and trust factors to water governance implementation, especially on equal access to safe water. However, concerning trust as a variable in the regression analysis (Table 7), as the significant variable shows, the perception of water quality has relied on trust. Although trust correlates closely with social norms, influencing compliance with instructions and convenience factors in water conservation [60], trust in water governance institutions can significantly impact perceptions and acceptance of provided water services [61]. Also, previous studies have emphasized government transparency when making a policy or implementing a program since transparency is essential to reduce mistrust [26, 27]. This study's result agreed with previous studies [30, 31], showing that trust as a significant predictor of perception of water quality, a higher trust in the government or water institution will result in higher perception of water quality. In addition, this study also shows that trust plays a pivotal role in shaping the perception of water quality by the communities. Therefore, it becomes the task of a public institution that manages water conservation in each country to build trust with the community/neighborhood to ensure the perception of water quality is optimistic by improving transparency.
Similarly, satisfaction with water services exhibited statistical insignificance in the regression analysis (Table 7, p > .050), suggesting a lack of association with water consumption. Satisfaction often serves as an indicator to evaluate policy performance in water management, shape policies, and assess institutional performance [17, 18].
The focus on socio-economic aspects of inclusive water governance policies in Indonesia aligns with this study's findings. Nonetheless, while socio-economic status emerges as a significant factor, this study agrees with the previous studies by Weisner et al. [43], Pierce and Gonzalez [44], and Turgeon et al. [45]. The study by Weisner et al. [43] emphasizes that the lower socio-economic status group shaped the perception of water quality by being dissatisfied with their tap water quality. Also, the study by Pierce and Gonzalez [44] that emphasized the worse condition of tap water that happens to the low socio-economic status group could shape the perception of water quality since the worse condition of tap water affects the safety of consuming the water. Also, socioeconomic status has been shaping the perceived risk of water consumption safety; people with higher socioeconomic status tend to be satisfied with their tap water condition [45]. Therefore, the government making the policy should consider the socio-economic aspect. In addition to addressing access inequalities and water scarcity, promoting public participation in water-saving practices remains crucial [62]. These strategies align with achieving Sustainable Development Goal 6 (Clean Water and Sanitation) by ensuring universal access to water [34]. However, policies like free essential water in South Africa have faced challenges, as wealthy households could exploit them, highlighting the need for nuanced policy design [2]. Also, promoting public participation in water-saving practices needs trust since trust could stimulate participation [28].
Furthermore, trust becomes a vital factor in the perception of water quality, leading to better implementation of water governance. Trust is essential in the perception of water quality because of better coordination and interaction when people have trust [25]. Trust also could lead people to use the water service provided by the government, which leads to a successful implementation of water governance [61]. This study also agrees with previous studies that show the perception of water quality was affected by trust from the community, and their relationship was curvilinear [63, 64].
The Indonesian government's PAMSIMAS program, involving community participation in urban water management, demonstrates an effort to address water access disparities. However, concerns arise from population growth in urban areas, increasing water demands, and potentially exacerbating scarcity [1]. These challenges call for comprehensive policies facilitating access and educating communities on prudent water usage. Educating communities also could shape the perception of water quality that reduces the perception of water quality that has been provided by PDAM (Indonesia’s Water Service).
Studies in Bandung suggest that vulnerable households access unimproved water, necessitating infrastructure improvements and educational programs [65]. Inclusive policies catering to all socio-economic groups must address inequalities and scarcity. Leveraging socio-economic survey data can aid in identifying and supporting vulnerable households through cross-subsidies in water access. Also, transparency from the government was essential to build trust in the communities since trust became one of the main factors in successfully implementing water governance.
This study emphasizes the associations between satisfaction with water institutions, trust in water institutions, and socioeconomic status in the perception of water quality, offering insights for identifying governance challenges in Indonesia. The regression analysis highlights trust and socio-economic status as significant variables influencing the perception of water quality. This finding implies that higher trust and socio-economic status will influence the perception of water quality, particularly in urban areas with diverse socio-economic statuses. The observed influence of socio-economic status and trust on the perception of water quality underscores potential governance issues related to water access inequalities, transparency, and adopting water-saving practices among different socio-economic strata and building trust since it could be shaping the perception of water quality by the citizens. Given the critical role of socio-economic status in ensuring universal access to safe water and promoting prudent usage, Indonesian water institutions should adopt more inclusive policies. In addition, trust is essential to shaping the public perception of water quality. Therefore, it is crucial to implement transparent water governance to build this trust.
To address water scarcity, Indonesian water institutions must devise policies inclusive of all socio-economic groups. Strategies like cross-subsidies and variable tariffs aligned with socio-economic status can encourage prudent water use and illuminate disparities in safe water access. Additionally, conducting socio-economic surveys to prioritize water infrastructure development for groups with lower socio-economic status could be beneficial. These policies were vital since they could bridge the inequalities and improve citizens’ perception of water quality.
Meanwhile, policymaking to enhance water services positively impacts citizen behavior towards more responsible water consumption practices by shaping their perception of water quality. Therefore, since trust was one of the significant predictors of the perception of water quality, transparency by the government through data sharing and involvement of public participation in water governance was vital to building trust from the citizens to the government, resulting in a positive perception of water quality. Furthermore, the government should aim to minimize citizens' distrust by involving them in decision-making and actively communicating every policy and program, as trust plays a vital role in shaping water quality perceptions. With a positive perception of water quality, citizens could become aware of the condition of water quality and the driving factor to a sustainable water management practice.
The authors would like to acknowledge the financial support provided by Institut Teknologi Nasional Bandung for making this publication possible.
[1] Janottama, S.Z., Triana, K. (2022). Delineating the groundwater protection zone (GPZ) around a water supply plant in Bekasi, West Java, Indonesia. Groundwater for Sustainable Development, 17: 100762. https://doi.org/10.1016/j.gsd.2022.100762
[2] The Ministry of Environment and Forestry Republic of Indonesia. (2020). Strategic Planning of The Ministry of Environment and Forestry Republic of Indonesia 2020-2024. https://www.menlhk.go.id/site/single_post/3298/renstra-klhk-tahun-2020-2024.
[3] Li, M., Yang, X., Wang, K., Di, C., Xiang, W., Zhang, J. (2024). Exploring China’s water scarcity incorporating surface water quality and multiple existing solutions. Environmental Research, 246: 118191. https://doi.org/10.1016/j.envres.2024.118191
[4] Cronin, A.A., Odagiri, M., Arsyad, B., Nuryetty, M.T., Amannullah, G., Santoso, H., Darundiyah, K., Nasution, N.A. (2017). Piloting water quality testing coupled with a national socioeconomic survey in Yogyakarta province, Indonesia, towards tracking of Sustainable Development Goal 6. International Journal of Hygiene and Environmental Health, 220(7): 1141-1151. https://doi.org/10.1016/j.ijheh.2017.07.001
[5] Berawi, M.A., Miraj, P., Windrayani, R., Berawi, A.R.B. (2019). Stakeholders’ perspectives on green building rating: A case study in Indonesia. Heliyon, 5(3): e01328. https://doi.org/10.1016/j.heliyon.2019.e01328
[6] Mohan, G., Chapagain, S.K., Fukushi, K., Papong, S., Sudarma, I.M., Rimba, A.B., Osawa, T. (2021). An extended Input-Output framework for evaluating industrial sectors and provincial-level water consumption in Indonesia. Water Resources and Industry, 25: 100141. https://doi.org/10.1016/j.wri.2021.100141
[7] Cameron, L., Chase, C., Haque, S., Joseph, G., Pinto, R., Wang, Q. (2021). Childhood stunting and cognitive effects of water and sanitation in Indonesia. Economics and Human Biology, 40: 100944. https://doi.org/10.1016/j.ehb.2020.100944
[8] Juwana, I., Muttil, N., Perera, B.J.C. (2014). Application of west Java water sustainability index to three water catchments in west Java, Indonesia. Ecological Indicators, 70: 401-408. https://doi.org/10.1016/j.ecolind.2016.06.017
[9] Chen, X., Zhao, B., Shuai, C., Qu, S., Xu, M. (2022). Global spread of water scarcity risk through trade. Resources, Conservation and Recycling, 187: 106643. https://doi.org/10.1016/j.resconrec.2022.106643
[10] Roson, R., Damania, R. (2017). The macroeconomic impact of future water scarcity: An assessment of alternative scenarios. Journal of Policy Modeling, 39(6): 1141-1162. https://doi.org/10.1016/j.jpolmod.2017.10.003
[11] Neto, S. (2016). Water governance in an urban age. Utilities Policy, 43: 32-41. https://doi.org/10.1016/j.jup.2016.05.004
[12] Shi, L., Ahmad, S., Shukla, P., Yupho, S. (2021). Shared injustice, splintered solidarity: Water governance across urban-rural divides. Global Environmental Change, 70: 102354. https://doi.org/10.1016/j.gloenvcha.2021.102354
[13] Lukat, E., Pahl-Wostl, C., Lenschow, A. (2022). Deficits in implementing integrated water resources management in South Africa: The role of institutional interplay. Environmental Science and Policy, 136: 304-313. https://doi.org/10.1016/j.envsci.2022.06.010
[14] Valdés-Pineda, R., Pizarro, R., García-Chevesich, P., Valdés, J.B., Olivares, C., Vera, M., Balocchi, F., Pérez, F., Vallejos, C., Fuentes, R., Abarza, A., Helwig, B. (2014). Water governance in Chile: Availability, management and climate change. Journal of Hydrology, 519: 2538-2567. https://doi.org/10.1016/j.jhydrol.2014.04.016
[15] Hurlbert, M., Mussetta, P. (2016). Creating resilient water governance for irrigated producers in Mendoza, Argentina. Environmental Science and Policy, 58: 83-94. https://doi.org/10.1016/j.envsci.2016.01.004
[16] Popovici, R., Erwin, A., Ma, Z., Prokopy, L.S., Zanotti, L., Bocardo Delgado, E.F., Pinto Cáceres, J.P., Zeballos Zeballos, E., Salas O’Brien, E.P., Bowling, L.C., Arce Larrea, G.R. (2021). Outsourcing governance in Peru’s integrated water resources management. Land Use Policy, 101: 105105. https://doi.org/10.1016/j.landusepol.2020.105105
[17] Lopus, S., McCord, P., Gower, D., Evans, T. (2017). Drivers of farmer satisfaction with small-scale irrigation systems. Applied Geography, 89: 77-86. https://doi.org/10.1016/j.apgeog.2017.10.004
[18] Montgomery, J., Xu, W., Bjornlund, H., Edwards, J. (2016). A table for five: Stakeholder perceptions of water governance in Alberta. Agricultural Water Management, 174: 11-21. https://doi.org/10.1016/j.agwat.2016.04.013
[19] Nabiafjadi, S., Sharifzadeh, M., Ahmadvand, M. (2021). Social network analysis for identifying actors engaged in water governance: An endorheic basin case in the Middle East. Journal of Environmental Management, 288: 112376. https://doi.org/10.1016/j.jenvman.2021.112376
[20] Delpla, I., Legay, C., Proulx, F., Rodriguez, M.J. (2020). Perception of tap water quality: Assessment of the factors modifying the links between satisfaction and water consumption behavior. Science of The Total Environment, 722: 137786. https://doi.org/10.1016/j.scitotenv.2020.137786
[21] Babel, M.S., Shinde, V.R., Sharma, D., Dang, N.M. (2020). Measuring water security: A vital step for climate change adaptation. Environmental Research, 185: 109400. https://doi.org/10.1016/j.envres.2020.109400
[22] Romano, G., Masserini, L. (2020). Factors affecting customers’ satisfaction with tap water quality: Does privatisation matter in Italy? Journal of Cleaner Production, 258: 120593. https://doi.org/10.1016/j.jclepro.2020.120593
[23] Doria, M., de F., Pidgeon, N., Hunter, P.R. (2009). Perceptions of drinking water quality and risk and its effect on behaviour: A cross-national study. Science of the Total Environment, 407(21): 5455-5464. https://doi.org/10.1016/j.scitotenv.2009.06.031
[24] Rahimi-Feyzabad, F., Yazdanpanah, M., Gholamrezai, S., Ahmadvand, M. (2022). Social network analysis of institutions involved in groundwater resources management: Lessons learned from Iran. Journal of Hydrology, 613(PA): 128442. https://doi.org/10.1016/j.jhydrol.2022.128442
[25] Edelenbos, J., van Meerkerk, I. (2015). Connective capacity in water governance practices: The meaning of trust and boundary spanning for integrated performance. Current Opinion in Environmental Sustainability, 12: 25-29. https://doi.org/10.1016/j.cosust.2014.08.009
[26] Fielmua, N. (2021). Understanding water governance from a systems’ perspective: A precursor for an enhanced water governance in small towns. Habitat International, 116: 102418. https://doi.org/10.1016/j.habitatint.2021.102418
[27] Mukhtarov, F., Dieperink, C., Driessen, P. (2018). The influence of information and communication technologies on public participation in urban water governance: A review of place-based research. Environmental Science and Policy, 89: 430-438. https://doi.org/10.1016/j.envsci.2018.08.015
[28] D’Agostino, D., Borg, M., Hallett, S.H., Sakrabani, R.S., Thompson, A., Papadimitriou, L., Knox, J.W. (2020). Multi-stakeholder analysis to improve agricultural water management policy and practice in Malta. Agricultural Water Management, 229: 105920. https://doi.org/10.1016/j.agwat.2019.105920
[29] Fragkou, M. C., McEvoy, J. (2016). Trust matters: Why augmenting water supplies via desalination may not overcome perceptual water scarcity. Desalination, 397: 1-8. https://doi.org/10.1016/j.desal.2016.06.007
[30] Guo, T., Gill, D., Johengen, T.H., Cardinale, B.L. (2019). What determines the public’s support for water quality regulations to mitigate agricultural runoff? Environmental Science and Policy, 101: 323-330. https://doi.org/10.1016/j.envsci.2019.09.008
[31] Shaffer-Morrison, C.D., Wilson, R.S. (2024). Understanding drivers of local water quality perception in the Lake Erie Basin. Journal of Great Lakes Research, 102311. https://doi.org/10.1016/j.jglr.2024.102311
[32] McCord, P., Waldman, K., Baldwin, E., Dell’Angelo, J., Evans, T. (2018). Assessing multi-level drivers of adaptation to climate variability and water insecurity in smallholder irrigation systems. World Development, 108: 296-308. https://doi.org/10.1016/j.worlddev.2018.02.009
[33] Xu, Q., Boelens, R., Veldwisch, G.J. (2022). Rural drinking water governance politics in China: Governmentality schemes and negotiations from below. Political Geography, 97: 102703. https://doi.org/10.1016/j.polgeo.2022.102703
[34] Yates, J.S., Harris, L.M. (2018). Hybrid regulatory landscapes: The human right to water, variegated neoliberal water governance, and policy transfer in Cape Town, South Africa, and Accra, Ghana. World Development, 110: 75-87. https://doi.org/10.1016/j.worlddev.2018.05.021
[35] Wei, Y., Wang, Z., Wang, H., Yao, T., Li, Y. (2018). Promoting inclusive water governance and forecasting the structure of water consumption based on compositional data: A case study of Beijing. Science of the Total Environment, 634: 407-416. https://doi.org/10.1016/j.scitotenv.2018.03.325
[36] Das, P. (2014). Women’s participation in community-level water governance in urban India: The gap between motivation and ability. World Development, 64: 206-218. https://doi.org/10.1016/j.worlddev.2014.05.025
[37] Stoler, J., Miller, J.D., Brewis, A., et al. (2021). Household water insecurity will complicate the ongoing COVID-19 response: Evidence from 29 sites in 23 low- and middle-income countries. International Journal of Hygiene and Environmental Health, 234: 113715. https://doi.org/10.1016/j.ijheh.2021.113715
[38] Bjornlund, V., Bjornlund, H. (2019). Understanding agricultural water management in a historical context using a socioeconomic and biophysical framework. Agricultural Water Management, 213: 454-467. https://doi.org/10.1016/j.agwat.2018.10.037
[39] Cai, J., Zhao, D., Varis, O. (2021). Match words with deeds: Curbing water risk with the Sustainable Development Goal 6 index. Journal of Cleaner Production, 318: 128509. https://doi.org/10.1016/j.jclepro.2021.128509
[40] Adelodun, B., Ajibade, F.O., Ighalo, J.O., Odey, G., Ibrahim, R.G., Kareem, K.Y., Bakare, H.O., Tiamiyu, A.O., Ajibade, T.F., Abdulkadir, T.S., Adeniran, K.A., Choi, K.S. (2021). Assessment of socioeconomic inequality based on virus-contaminated water usage in developing countries: A review. Environmental Research, 192: 110309. https://doi.org/10.1016/j.envres.2020.110309
[41] Gondo, R., Kolawole, O.D., Mbaiwa, J.E., Motsholapheko, M.R. (2020). Demographic and socio-economic factors influencing water governance in the Okavango Delta, Botswana. Scientific African, 10: e00602. https://doi.org/10.1016/j.sciaf.2020.e00602
[42] Lee, G.O., Whitney, H.J., Blum, A.G., Lybik, N., Cevallos, W., Trueba, G., Levy, K., Eisenberg, J.N.S. (2020). Household coping strategies associated with unreliable water supplies and diarrhea in Ecuador, an upper-middle-income country. Water Research, 170: 115269. https://doi.org/10.1016/j.watres.2019.115269
[43] Weisner, M.L., Root, T.L., Harris, M.S., Mitsova, D., Liu, W. (2020). Tap water perceptions and socioeconomics: Assessing the dissatisfaction of the poor. Sustainable Production and Consumption, 21: 269-278. https://doi.org/10.1016/j.spc.2019.08.008
[44] Pierce, G., Gonzalez, S. (2016). Mistrust at the tap? Factors contributing to public drinking water (mis)perception across US households. Water Policy, 19(1): 1-12. https://doi.org/10.2166/wp.2016.143
[45] Turgeon, S., Rodriguez, M. J., Thériault, M., Levallois, P. (2004). Perception of drinking water in the Quebec City region (Canada): The influence of water quality and consumer location in the distribution system. Journal of Environmental Management, 70(4): 363-373. https://doi.org/10.1016/j.jenvman.2003.12.014
[46] Haldar, K., Kujawa-Roeleveld, K., Schoenmakers, M., Datta, D.K., Rijnaarts, H., Vos, J. (2021). Institutional challenges and stakeholder perception towards planned water reuse in peri-urban agriculture of the Bengal delta. Journal of Environmental Management, 283: 111974. https://doi.org/10.1016/j.jenvman.2021.111974
[47] Johns, C., VanNijnatten, D. (2021). Using indicators to assess transboundary water governance in the Great Lakes and Rio Grande-Bravo regions. Environmental and Sustainability Indicators, 10: 100102. https://doi.org/10.1016/j.indic.2021.100102
[48] Rangecroft, S., Dextre, R.M., Richter, I., Grados Bueno, C.V, Kelly, C., Turin, C., Fuentealba, B., Hernandez, M. C., Morera, S., Martin, J., Guy, A., Clason, C. (2023). Unravelling and understanding local perceptions of water quality in the Santa basin, Peru. Journal of Hydrology, 625: 129949. https://doi.org/10.1016/j.jhydrol.2023.129949
[49] Ko, S.H., Sakai, H. (2021). Perceptions of water quality, and current and future water consumption of residents in the central business district of Yangon city Myanmar. Water Supply, 22(1): 1094-1106. https://doi.org/10.2166/ws.2021.212
[50] Delpla, I., Legay, C., Proulx, F., Rodriguez, M.J. (2020). Perception of tap water quality: Assessment of the factors modifying the links between satisfaction and water consumption behavior. Science of The Total Environment, 722: 137786. https://doi.org/10.1016/j.scitotenv.2020.137786
[51] Debnath, P., Mamun, M.M.A., Al, Karmakar, S., Uddin, M.S., Nath, T.K. (2022). Drinking water quality of Chattogram city in Bangladesh: An analytical and residents’ perception study. Heliyon, 8(12): e12247. https://doi.org/10.1016/j.heliyon.2022.e12247
[52] Okumah, M., Yeboah, A.S. (2020). Exploring stakeholders’ perceptions of the quality and governance of water resources in the Wenchi municipality. Journal of Environmental Planning and Management, 63(8): 1375-1403. https://doi.org/10.1080/09640568.2019.1663724
[53] Chiang, H.H., Basu, M., Sianipar, C.P.M., Onitsuka, K., Hoshino, S. (2021). Capital and symbolic power in water quality governance: Stakeholder dynamics in managing nonpoint sources pollution. Journal of Environmental Management, 290: 112587. https://doi.org/10.1016/j.jenvman.2021.112587
[54] Central Agency of Statistics. (2021). Indonesian Environmental Statistics 2021. https://www.bps.go.id/publication/2021/11/30/2639657be1e8bd2548469f0f/statistik-lingkungan-hidup-indonesia-2021.html.
[55] Fuks, M., Salazar, E. (2008). Applying models for ordinal logistic regression to the analysis of household electricity consumption classes in Rio de Janeiro, Brazil. Energy Economics, 30(4): 1672-1692. https://doi.org/10.1016/j.eneco.2007.09.006
[56] Bürkner, P.C., Vuorre, M. (2019). Ordinal Regression Models in Psychology: A Tutorial. Advances in Methods and Practices in Psychological Science, 2(1): 77-101. https://doi.org/10.1177/2515245918823199
[57] Herdiansyah, H., Octavianto, A.G., Aritonang, E.G., Imaduddin, M.N., Rilaningrum, M. (2017). Capacity analysis of parking lot and volume of vehicle toward sustainable parking convenience. In IOP Conference Series: Earth and Environmental Science, 88(1): 012031). https://doi.org/10.1088/1755-1315/88/1/012031
[58] Zhao, D., Liu, J., Yang, H., Sun, L., Varis, O. (2021). Socioeconomic drivers of provincial-level changes in the blue and green water footprints in China. Resources, Conservation and Recycling, 175: 105834. https://doi.org/10.1016/j.resconrec.2021.105834
[59] Mehboob, M.S., Kim, Y. (2021). Effect of climate and socioeconomic changes on future surface water availability from mountainous water sources in Pakistan’s Upper Indus Basin. Science of The Total Environment, 769: 144820. https://doi.org/10.1016/j.scitotenv.2020.144820
[60] Tong, Y., Fan, L., Niu, H. (2017). Water conservation awareness and practices in households receiving improved water supply: A gender-based analysis. Journal of Cleaner Production, 141: 947-955. https://doi.org/10.1016/j.jclepro.2016.09.169
[61] Ross, V.L., Fielding, K.S., Louis, W.R. (2014). Social trust, risk perceptions and public acceptance of recycled water: Testing a social-psychological model. Journal of Environmental Management, 137: 61-68. https://doi.org/10.1016/j.jenvman.2014.01.039
[62] Juwana, I., Rahardyan, N.A., Permadi, D.A., Sutadian, A.D. (2022). Uncertainty and sensitivity analysis of the effective implementation of water quality improvement programs for Citarum River, West Java, Indonesia. Water, 14(24): 4077. https://doi.org/10.3390/w14244077
[63] Okumah, M., Yeboah, A.S., Bonyah, S. K. (2020). What matters most? Stakeholders’ perceptions of river water quality. Land Use Policy, 99: 104824. https://doi.org/10.1016/j.landusepol.2020.104824
[64] Voogd, R., de Vries, J.R., Beunen, R. (2021). Understanding public trust in water managers: Findings from the Netherlands. Journal of Environmental Management, 300: 113749. https://doi.org/10.1016/j.jenvman.2021.113749
[65] Muntalif, B.S., Nastiti, A., Roosmini, D., Sudradjat, A., Meijerink, S.V., Smits, A.J.M. (2017). Household water supply strategies in urban Bandung, Indonesia: Findings and implications for future water access reporting. Journal of Engineering and Technological Sciences, 49(6): 811-832. https://doi.org/10.5614/j.eng.technol.sci.2017.49.6.8