Abdul Razzaq M. Khalefah![]() | Isam I. Omran
| Isam I. Omran![]() | Maki J.M. Al-Waily*
| Maki J.M. Al-Waily*![]()
© 2024 The authors. This article is published by IIETA and is licensed under the CC BY 4.0 license (http://creativecommons.org/licenses/by/4.0/).
OPEN ACCESS
Waste oil represents a major challenge to soil quality and environmental sustainability. This study was conducted to determine the environmental impact of refinery effluent on the soil within the refinery site and surrounding area. Six different test sites were selected to measure soil pollutant concentrations according to their distance from the untreated effluent discharge lagoon. The study period lasted six months, as the testing work began in April and ended in September 2023. Standard methods were used to determine the physical, chemical, and biological pollutants of the soil, and soil pollution indices (PLI, CF, and Igeo) were adopted in determining soil quality. The results showed a clear effect of untreated wastewater on soil properties. The soil of the testing sites near the refinery appeared to be highly contaminated with organic pollutants (O&G, TOC, and phenol) and gradually decreased towards the city. The concentrations of heavy metals in the soil were less than the permissible limit of WHO at the various testing sites, with the exception of the concentrations of Cd and Pb. The Cd concentration was approximately 200% higher than the permissible limit, while the Pb concentration was close to the permissible limit or slightly more. Generally, the measured concentrations of these metals followed the order: Ni<Pb<Co<Cd<Cu, while there was no effect of other heavy metals or biological contamination at all testing sites. The refinery soil and the surrounding area were classified according to index (PLI) within the baseline level in terms of heavy metals, while index (CF) indicated that it was highly contaminated with cadmium and had little contamination with other heavy metals. The index (Igeo) indicated that the soil was highly polluted with cadmium, while it did not indicate contamination with other heavy metals. The study recommends that in order to reduce pollution from refinery effluent, the responsible administration must implement waste drainage networks, establish a treatment plant for the untreated effluent, and also use modern technologies to reduce gaseous emissions and their deposits on the soil.
refinery effluent, petroleum pollutants, soil pollution indices, oil and grease, TOC, phenol, heavy metals
Petroleum plays an important role in meeting the needs of various aspects of human life. The process of exploitation, refining, and storage of petroleum products, coupled with limited technical progress, leads to the inevitable release of waste residues (gaseous emissions deposits and untreated effluents) containing petroleum chemicals into the soil, which exacerbates the problem of environmental pollution.
The primary focus of some environmental protection research has been the ecological behavior of rock and oil pollutants in soil [1, 2]. The presence of large quantities of oil within the soil environment had a profound impact on its characteristics [3, 4].
The degree of soil pollution depends on the soil type and the polluting chemicals, which means increasing the difficulty of getting rid of these pollutants due to the various interactions between them. The impact of soil pollutants can be reduced in various ways (physical, chemical, and biological), but some pollutants, including petroleum, cannot be completely removed [5]. Monitoring the amount of crude oil present in the soil is a good way to avoid its contamination and reduce its impact on soil characteristics [6, 7].
Soil pollution also affects plant cultivation, and the degree of pollution depends largely on the dose to which the soil is exposed to concentrations of petroleum pollutants. It is now believed that identifying and using plants that have a high ability to adapt to pollution caused by crude oil is a safer and more cost-effective solution than other options to address food security issues and environmental concerns caused by crude oil [8, 9]. The study [10] indicated that spent motor oil in any concentration seriously affects soil properties, and phytochemical analysis showed the inhibitory effects of spent motor oil on plant growth.
Many studies have confirmed that oil pollution of the soil affects the physical properties of the soil and thus affects the lives of residential areas that are located within or near the pollution area because organic fluids affect the geotechnical behavior of the soil [11, 12]. The results obtained from the study [13] showed that the physical properties of the soil (moisture content, liquid and plastic limit) were affected due to oil pollution, and the hydraulic conductivity decreased by 10% due to oil contamination.
At present, basic physical and chemical treatment methods, such as thermal treatment and other filtration methods, are used for the purpose of determining the concentration of soil pollutants, although there is also a need to develop some other central treatment technologies at a limited cost that are non-secondary, especially in order to quickly treat pollution in emergency situations such as explosions, accidents and oil spills [14].
The study [15] reported that the high concentration of spent oil in the soil affected most of the soil specifications. Therefore, periodic testing of soil contamination with spent motor oil must be carried out carefully to ensure the sustainability of the productivity of agricultural areas.
Another study [16] discussed the compositions and properties of petroleum pollutants, investigated some methods for restoring oil-contaminated soils, and compared and analyzed the advantages and disadvantages of three types of bioremediation techniques. Prospects for physical and chemical remediation, bioremediation, and microbial plant remediation were also presented to provide some suitable principles for soil remediation contaminated with oil.
The study [17] showed that lubricating oil residues negatively affected both the physical and chemical properties of the soil. It has also been proven that lubricating oils contain many toxic and hazardous substances, such as PCBs, PAHs, benzene, lead, arsenic, zinc, etc., which pollute the soil.
Other researchers have achieved indirect methods to reduce soil pollution by improving vehicle fuel specifications. Nanoparticles have been added to reduce the amount of fuel used, enhance braking power, and reduce hydrocarbon emissions [18].
This review aims to investigate the environmental impact of untreated oil refinery waste on soil characteristics and to determine soil quality according to standard soil pollution indices.
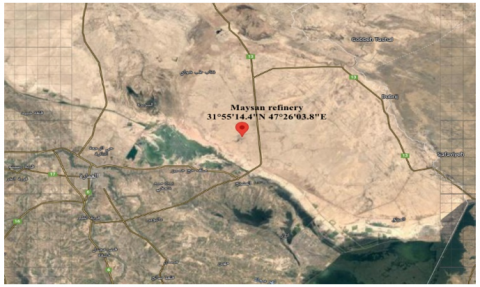
Maysan Governorate is located in the southeast of the country (Iraq), and the city of Amara represents the main center of the governorate. The city of Amara is about 320km away from the capital of Iraq (Baghdad). The population of the governorate is about 1,202,175 people, according to the statistics of the Ministry of Planning in Iraq for the year 2021. Figure 1 shows the location of the Maysan governorate and its refinery (study area).
The Maysan refinery represents one of the most promising strategic oil projects in the governorate, as large numbers of technical personnel from the governorate work there. Due to its importance to the environment, Maysan Refinery was chosen as a study area. The refinery's location coordinates were determined to be within latitude 31.922524 and longitude 47.43468, as shown in Figure 1. The production capacity of the Maysan refinery is about 40 thousand barrels per day, and it consists of four refining units, each with a capacity of 10 thousand barrels per day of gasoline, gas, oil, and other petroleum products. The city of Al-Masharah is considered the closest population center to the refinery site, as it is about 10km away from it, while the refinery is about 32km away from the city of Amara. The refinery is classified as a strategic project that uses modern technologies in the production process, but it lacks basic systems to protect the environment, such as regular sewage networks and a waste treatment plant. The refinery discharges untreated petroleum effluent into adjacent open areas, which leads to harm to the environment (air, soil, and water) in those areas, as shown in Figure 2.
a) Location of maysan governorate within the map of Iraq
b) Location of maysan refinery (google earth) https://maps.app.goo.gl/ex4QoL6uLra8f6vq9
Figure 1. Location of maysan governorate and its refinery (study area)
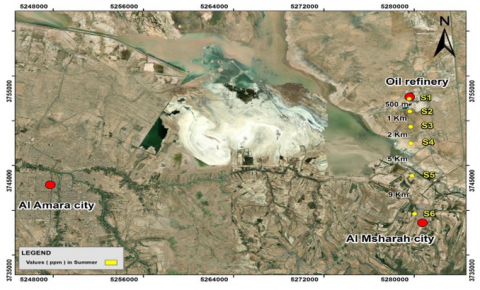
(a) Soil sample sites
(b) Soil sampling
Figure 2. Views of the testing works
Two pollution indices (pollution load index (PLI) and Geo-accumulation Index (Igeo)) were used for the purpose of investigating soil pollution in the study area. The selection of these indices was due to their high accuracy and reliability [19]. Also, due to the lack of data on the background values of heavy metal concentrations in the study area, the background level of heavy metals from previous studies was used in similar conditions and far from the influence of human and industrial activities [20, 21].
3.1 Pollution load index
The PLI was calculated using the following Eq. (1) [22]:
$P L I=\left(C F_1 * C F_2 * C F_3 * \ldots \ldots C F_n\right)^{1 / n}$ (1)
where,
n is the number of heavy metals, and CF is the contamination factor, which is calculated as follows:
$C F=C_{\text {metal }} / C_{\text {background }}$ (2)
where,
C metals and C background represent the measured concentration of the heavy metal in the soil sample and in the background sample, respectively. It is noteworthy to highlight that PLI values were assessed according to the categories reported by [22-24], as follows:
CF Value Pollution: CF<1 Low, 1≤CF≥3 Moderate, 3≤CF≥6 Considerable, CF>6 Very high.
PLI Value Pollution: 0 Unpolluted, <1 Baseline Level, ≥1 Polluted.
3.2 Geo-accumulation index (Igeo)
The geo-accumulation index (I geo) was calculated by using the following Eq. (3) [25]:
$I_{\text {geo }}=I_{\text {og } 2}\left(C_{\text {metal }} / 1.5 C_{\text {background }}\right)$ (3)
Igeo was classified into seven grades, according to Table 1 [26]:
Table 1. Classification of geo-accumulation index (Igeo) [25, 26]
|
I Geo |
I Geo Grade |
Pollution |
|
<0 |
0 |
Unpolluted |
|
0-1 |
1 |
Unpolluted to moderate |
|
1-2 |
2 |
Moderate polluted |
|
2-3 |
3 |
Moderate to high polluted |
|
3-4 |
4 |
High polluted |
|
4-5 |
5 |
High to extremely polluted |
|
5-6 |
>5 |
Extremely polluted |
Soil pollutant concentrations in the refinery and surrounding areas were measured at six different test sites. The sites were chosen based on their distance from the untreated effluent collection lagoon, which has an area of about 0.5km2 and a depth of 1.5 to 2.0m. The first site was near the lagoon, another within the refinery area, three in the area surrounding the refinery, and one in the nearest urban area, which is the city of Al-Masharah. The study lasted for six months, from April to September 2023. Soil samples were collected, placed in polyethylene bags, numbered according to the study, and brought to the laboratory. The collected samples were dried for 48h at 105℃ in preparation for chemical analysis. Next, the dried samples were ground and passed through a 106μm sieve. To minimize the potential for external contamination, digestion was performed using a microwave-assisted digestion approach.
Digested samples were allowed to cool to 20℃±1℃ at room temperature before being filtered using 0.45-μm Whatman filters. After collecting the filtrate, 50ml of it was produced, and an AAS device was used to measure the heavy metal content. In terms of biological analysis, the most probable number (MPN) method was applied to determine the total number of bacteria. Using this method, duplicate portions of the original samples are cultured to confirm the presence of bacteria in each portion. The results of laboratory analysis were used to demonstrate their impact on soil pollution and to compare them with the specifications specified by the WHO.
Four samples of untreated petroleum effluent were taken from different sites in the collection lagoon. Table 2 shows the average values of the most prominent parameters of the effluent. Also, soil samples were taken from six testing sites at a depth of one meter to determine the effect of untreated effluent on soil properties. Table 3 shows the physical, chemical, and biological parameters of soil samples taken from the test sites.
Table 2. Values of refinery petroleum effluent parameters
|
Analysis of Refinery Petroleum Effluent |
|
|
Parameter |
Value |
|
pH |
7.9-9.1 |
|
TDS |
32650mg/l |
|
Turbidity |
340mg/l |
|
BOD |
116mg/l |
|
COD |
408mg/l |
|
Oil and grease |
196mg/l |
|
TOC |
162mg/l |
|
Phenol |
13mg/l |
|
Ni |
1.883mg/l |
|
Cu |
3.927mg/l |
|
Cd |
1.206mg/l |
|
Pb |
1.116mg/l |
|
Co |
1.005mg/l |
|
Remaining of the heavy elements |
Nill |
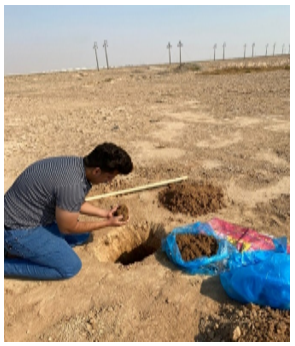
5.1 Concentration of organic petroleum pollutants in the soil samples
The organic petroleum pollutants (O&G, phenol, and TOC) are listed in Table 3. It can be clearly seen from Figure 3 that the O&G concentration was at range (51-326mg/kg), the concentration of phenol was at range (1.67-23.24mg/kg), and the TOC concentration percentage was at range (2.06%-13.07%). According to WHO limits, high contamination appears in the soil of the nearby test sites (S1, S2, and S3) at a rate of about (230%, 1100%, and 760%) for the parameters (O&G, phenol, and TOC), respectively. While these percentages decrease to (50%, 600%, and 100%) at testing sites (S4, S5, and S6) far from the refinery and close to the city.
Table 3. Values of the physical, chemical, and biological parameters of the soil at the testing sites
|
Soil Parameters |
Permissible Limits According to WHO Specifications |
Testing Locations |
|||||
|
|
|
S1 |
S2 |
S3 |
S4 |
S5 |
S6 |
|
pH |
6.5-8.0 |
7.83 |
7.88 |
7.72 |
7.78 |
7.91 |
7.90 |
|
EC (mS/m) |
570 |
789 |
775 |
793 |
801 |
809 |
811 |
|
Ni (mg/kg) |
10 |
1.61 |
1.33 |
1.05 |
0.44 |
0.46 |
0.32 |
|
Cu (mg/kg) |
10 |
7.25 |
6.8 |
6.55 |
5.30 |
4.25 |
4.76 |
|
Cd (mg/kg) |
3.0 |
6.85 |
6.5 |
6.95 |
6.76 |
6.60 |
6.45 |
|
Pb (mg/kg) |
2.0 |
3.11 |
3.04 |
2.70 |
2.31 |
2.33 |
2.40 |
|
Co (mg/kg) |
50 |
4.75 |
4.55 |
4.42 |
4.25 |
4.31 |
4.45 |
|
Oil and Grease (mg/kg) |
100.0 |
326 |
246 |
133 |
112 |
42 |
51 |
|
TOC (%) |
2.0 |
13.07 |
7.64 |
3.11 |
2.09 |
1.89 |
2.06 |
|
Phenol (mg/kg) |
0.54 |
23.24 |
5.46 |
4.36 |
4.42 |
3.05 |
1.67 |
|
Total number of bacteria (No./g) |
1010 |
7x10⁵ |
8x10⁵ |
11x105 |
14x105 |
3x10⁶ |
11x106 |
|
SO4 (mg/kg) |
400 |
454 |
546 |
586 |
514 |
514 |
516 |
|
Cl (mg/kg) |
500 |
577 |
584 |
651 |
636 |
640 |
656 |
Notes (see Figure 3): S1: A test site 5meters away from the refinery effluent lagoon, towards the nearest surface water source (Al-Masharah River adjacent to the city). S2: A test site 500meters away from the refinery effluent lagoon, towards the nearest surface water source (Al-Masharah River adjacent to the city). S3: A test site 1.0km away from the refinery effluent lagoon, towards the nearest surface water source (Al-Masharah River adjacent to the city). S4: A test site 2.0km away from the refinery effluent lagoon, towards the nearest surface water source (Al-Masharah River adjacent to the city). S5: A test site 5.0km away from the refinery effluent lagoon, towards the nearest surface water source (Al-Masharah River adjacent to the city). S6: A test site 9.0km away from the refinery effluent lagoon, towards the nearest surface water source (Al-Masharah River adjacent to the city)
Figure 3. Values of organic petroleum pollutants in the testing sites
Figure 4. Values of heavy metal pollutants in the testing sites
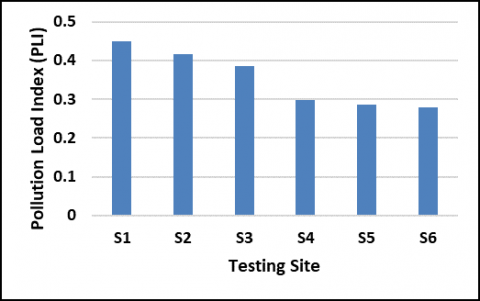
Figure 5. Values of pollution load index (PLI) for the heavy metals in the study area
5.2 Concentration of inorganic pollutants in the soil samples
Inorganic pollutants (SO4-2, Cl-) and others (pH, EC, and number of bacteria) have also been listed in Table 3. It turns out that all of them were close to the permissible limits, or slightly more. It was observed that it increased at a relatively small rate in sites far from the refinery, which means that it was not affected by the industrial activity of the refinery but rather that human and agricultural activity near the city may have an effective role in this result.
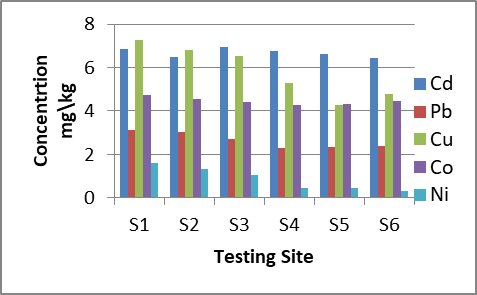
5.3 Concentration of heavy metals in the soil samples
Table 3 lists the concentrations of the studied heavy metals (Ni, Cu, Cd, Pb, and Co) in the soil samples collected from the study area. It can be seen from Figure 4 that the Cd concentration was the highest in the range (6.45-6.95mg/kg), and the Ni concentration was the lowest in the range (0.32-1.61mg/kg). Generally, the measured concentrations of these metals followed the order: Ni<Pb<Co<Cd<Cu, while the others are Nill.
In general, the concentrations of heavy metals in the soil were less than the permissible limit of WHO in the various testing sites, except for the concentrations of Cd and Pb. The Cd concentration was about 200% more than the permissible limit, while the lead concentration was close to the permissible limit or slightly more.
It is worth noting that the arrangement of pollutants (the size of the heavy metals studied) can be attributed to the chemical composition of both the soil of the study area and the industrial and human activities in the region.
5.4 Evaluation of soil contamination with heavy metal
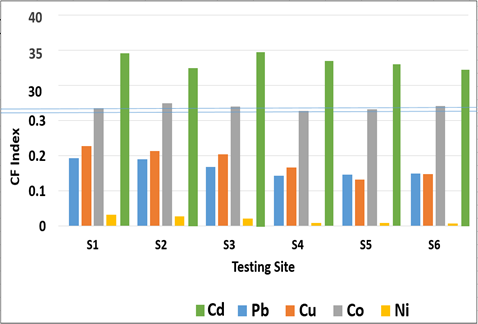
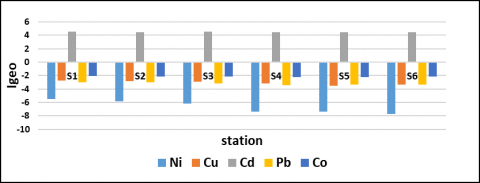
Figure 5 shows the calculated values of PLI for the studied heavy metals in soil samples. The highest PLI value was at test site 1, followed by site 2, while the lowest value was at site 6. In general, PLI values are higher at sites close to the refinery. PLI values are in the range (0.280-0.449), which confirms that they are within the baseline level of pollution. By using the CF index, Figure 6 indicated that the soil was highly contaminated with cadmium and had little contamination with other heavy metals. The CF values indicated a relative increase in testing sites close to the refinery, especially for the Cd parameter (34.250), and remained constant approximately at this rate (32.250) in sites close to the city, while the CF of other heavy metals was low in the various testing sites, indicating that they were low in pollution. Figure 7 also showed that the Igeo values agree with the CF indicator values. It appeared that all Igeo values were negative (no pollution), except for the Cd parameter values, which indicated high pollution. It reached about (4.514) in the location closest to the refinery, while it reached (4.427) in the location closest to the city.
Figure 6. Values of contamination factor (Cf) for the heavy metals in the study area
Figure 7. Values of geo-accumulation index (Igeo) for the heavy metals in the study area
The current study was devoted to studying the environmental impact of untreated Maysan refinery effluent on soil pollution. The most prominent conclusions reached by this study were as follows:
1. The soil of the testing sites near the refinery appeared to be highly contaminated with organic pollutants (O&G, TOC, and phenol) and gradually decreased towards the city.
2. The effect of inorganic pollutants (SO4-2, Cl-) and the total number of bacteria did not appear in the soil of the study area. However, their concentrations increasing in testing sites close to the city, and this may be due to human and agricultural activities.
3. In general, at the various testing sites, the concentrations of heavy metals in the soil were below the permissible limits set by WHO, except for Cd and Pb. The Cd concentration was approximately 200% higher than the permissible limit, while the Pb concentration was close to the permissible limit or slightly more.
4. The pollution index PLI indicated that the soil is at the baseline level of pollution. However, the two pollution indicators, CF and Igeo, concurred that soil at the testing sites, both near and distant from the refinery, is contaminated with Cd. There was no significant effect on the concentrations of other heavy metals. The values of the indicators decreased gradually at testing sites increasingly distant from the refinery and close to the city.
[1] Hu, M. (2020). Environmental behavior of petroleum in soil and its harmfulness analysis. In IOP Conference Series: Earth and Environmental Science, IOP Publishing, 450(1): 012100. https://doi.org/10.1088/1755-1315/450/1/012100
[2] Adeniran, M.A., Oladunjoye, M.A., Doro, K.O. (2023). Soil and groundwater contamination by crude oil spillage: A review and implications for remediation projects in Nigeria. Frontiers in Environmental Science, 11: 1137496. https://doi.org/10.3389/fenvs.2023.1137496
[3] Hazim, R.N., Al-Ani, M.A. (2019). Effect of petroleum hydrocarbons contamination on soil microorganisms and biodegradation. Rafidain Journal of Science, 28(1): 13-22. https://doi.org/10.33899/rjs.2019.159391
[4] Adeyemo, I.A., Aliu, O. (2021). Effect of oil spillage on soil bacteriological and physicochemical properties in Awoye Community, Ilaje, Ondo State, Nigeria. East African Scholars Journal of Agricultural & Life Sciences, 4(1): 1-5. https://doi.org/10.36349/easjals.2021.v04i01.001
[5] Zahermand, S., Vafaeian, M., Bazyar, M.H. (2020). Análisis de las propiedades físicas y químicas de suelos contaminados con hidrocarburos oleosos (petróleo)./Analysis of the physical and chemical properties of soil contaminated with oily (petroleum) hydrocarbons. Earth Sciences Research Journal, 24(2): 163-168. https://doi.org/10.15446/esrj.v24n2.76217
[6] Moses, E.A., Uwah, E.I. (2015). The effect of crude oil pollution on some soil fertility parameters in Ikot Oboreyin, Ikot Abasi, Akwa Ibom State, Nigeria. Merit Research Journal of Environmental Science and Toxicology, 3(2): 17-24.
[7] Osuagwu, A.N., Okigbo, A.U., Ekpo, I.A., Chukwurah, P.N., Agbor, R.B. (2013). Effect of crude oil pollution on growth parameters, chlorophyll content and bulbils yield in air potato (Dioscorea bulbifera L.). International Journal of Applied Science and Technology, 3(4): 37-42.
[8] Ngozi, E.J., Ifechukwu, A.E., Lawrence, A.N. (2017). Effects of used engine oil polluted-soil on seeds’ germination and seedlings’ growth characteristics of some tropical crops. International Journal of Environment, Agriculture and Biotechnology (IJEAB), 2(2): 812-818. https://doi.org/10.22161/ijeab/2.2.32
[9] Marinescu, M., Toti, M., Tanase, V., Plopeanu, G., Calciu, I., Marinescu, M. (2011). The effects of crude oil pollution on physical and chemical characteristics of soil. Research Journal of Agricultural Science, 43(3): 125-129.
[10] Okonokhua, B.O., Ikhajiagbe, B., Anoliefo, G.O., Emede, T.O. (2007). The effects of spent engine oil on soil properties and growth of maize (Zea mays L.). Journal of Applied Sciences and Environmental Management, 11(3): 147-152. https://doi.org/10.4314/jasem.v11i3.55162
[11] Hasan, R.A. (2021). Evaluating the impact of light crude oil contaminations on geotechnical behaviors of the soil. Anbar Journal of Agricultural Sciences, 19(2): 143-157. https://doi.org/10.32649/aagrs.2022.100-00
[12] Shahid, H., Iqbal, M.Z., Shafiq, M., Athar, M. (2017). Effects of crude oil polluted soil on the seedling growth of pennisetum glaucum (L.) R. BR. Journal of Plant Development, 24: 33-43.
[13] Devatha, C.P., Vishnu Vishal, A., Purna Chandra Rao, J. (2019). Investigation of physical and chemical characteristics on soil due to crude oil contamination and its remediation. Applied Water Science, 9: 1-10. https://doi.org/10.1007/s13201-019-0970-4
[14] Uquetan, U.I., Essoka, P.A., Egor, A.O., Osang, J.E., Bawan, A.M. (2016). Case study of the effects of oil pollution on soil properties and growth of tree crops in Cross River State, Nigeria. International Journal of Scientific & Engineering Research, 7(1): 2229-5518.
[15] Ngozi, E.J., Ifechukwu, A.E., Lawrence, A.N. (2017). Effects of used engine oil polluted-soil on seeds’ germination and seedlings’ growth characteristics of some tropical crops. International Journal of Environment, Agriculture and Biotechnology (IJEAB), 2: 812-818. https://doi.org/10.22161/ijeab/2.2.32
[16] Wang, S.G., Xu, Y., Lin, Z.F., Zhang, J.S., Norbu, N., Liu, W. (2017). The harm of petroleum-polluted soil and its remediation research. In AIP Conference Proceedings, 1864(1): 020222. https://doi.org/10.1063/1.4993039
[17] Udonne, J.D., Onwuma, H.O. (2014). A study of the effects of waste lubricating oil on the physical/chemical properties of soil and the possible remedies. Journal of Petroleum and Gas, 5(1): 9-14. https://doi.org/10.5897/JPGE2013.0163
[18] Elkelawy, M., Alm-Eldin Mohamad, H., Abo-Samra, S., Abd-Elhay Elshennawy, I. (2023). Nanoparticles additives for diesel/biodiesel fuel blends as a performance and emissions enhancer in the applications of direct injection diesel engines: A comparative review. Journal of Engineering Research (ERJ), 7(1): 1-10. https://doi.org/10.21608/ERJENG.2023.183920.1138
[19] Venkatesha Raju, K., Somashekar, R.K., Prakash, K.L. (2012). Heavy metal status of sediment in river Cauvery, Karnataka. Environmental Monitoring and Assessment, 184: 361-373. https://doi.org/10.1007/s10661-011-1973-2
[20] Mohiuddin, K.M., Otomo, K., Ogawa, Y., Shikazono, N. (2012). Seasonal and spatial distribution of trace elements in the water and sediments of the Tsurumi River in Japan. Environmental Monitoring and Assessment, 184: 265-279. https://doi.org/10.1007/s10661-011-1966-1
[21] Wang, Y., Yang, Z.F., Shen, Z.Y., Tang, Z.W., Niu, J.F., Gao, F. (2011). Assessment of heavy metals in sediments from a typical catchment of the Yangtze River, China. Environmental Monitoring and Assessment, 172: 407-417. https://doi.org/10.1007/s10661-010-1343-5
[22] Tomlinson, D.L., Wilson, J.G., Harris, C.R., Jeffrey, D.W. (1980). Problems in the assessment of heavy-metal levels in estuaries and the formation of a pollution index. Helgoländer Meeresuntersuchungen, 33: 566-575. https://doi.org/10.1007/BF02414780
[23] Hakanson, L. (1980). An ecological risk index for aquatic pollution control. A sedimentological approach. Water Research, 14(8): 975-1001. https://doi.org/10.1016/0043-1354(80)90143-8
[24] Harikumar, P.S., Jisha, T.S. (2010). Distribution pattern of trace metal pollutants in the sediments of an urban wetland in the Southwest Coast of India. International Journal of Engineering Science and Technology, 2(5): 840-850.
[25] Karim, Z., Qureshi, B.A., Mumtaz, M. (2015). Geochemical baseline determination and pollution assessment of heavy metals in urban soils of Karachi, Pakistan. Ecological Indicators, 48: 358-364. https://doi.org/10.1016/j.ecolind.2014.08.032
[26] Buccolieri, A., Buccolieri, G., Cardellicchio, N., Dell'Atti, A., Di Leo, A., Maci, A. (2006). Heavy metals in marine sediments of Taranto Gulf (Ionian Sea, southern Italy). Marine Chemistry, 99(1-4): 227-235. https://doi.org/10.1016/j.marchem.2005.09.009