Adnan Adnan*![]() | Yaya Suryana | Abdul Aziz
| Yaya Suryana | Abdul Aziz![]() | Taslim Rochmadi | Arie Rakhman Hakim
| Taslim Rochmadi | Arie Rakhman Hakim![]() | Andari Risliawati
| Andari Risliawati![]() | Arifuddin Kasim | Fahrodji Fahrodji | Amrullah Kamaruddin
| Arifuddin Kasim | Fahrodji Fahrodji | Amrullah Kamaruddin![]() | Wenny Oktaviani | Laela Nuraini
| Wenny Oktaviani | Laela Nuraini![]() | Anugerah Fitri Amalia
| Anugerah Fitri Amalia![]() | Nizam Ghazali | Adim Hadi | Taufik Iqbal Ramdhani
| Nizam Ghazali | Adim Hadi | Taufik Iqbal Ramdhani![]() | Puji Lestari
| Puji Lestari![]() | Willy Bayuardi Suwarno
| Willy Bayuardi Suwarno![]() | Trikosoemaningtyas Trikosoemaningtyas
| Trikosoemaningtyas Trikosoemaningtyas![]() | Sobir Sobir
| Sobir Sobir![]()
© 2024 The authors. This article is published by IIETA and is licensed under the CC BY 4.0 license (http://creativecommons.org/licenses/by/4.0/).
OPEN ACCESS
While core collections offer various advantages, achieving a balance between representing genetic diversity and ensuring the practical manageability of the entire genebank collection is crucial. This study investigated the utility of the Shannon-Weaver diversity index and machine learning as a support system for the acceptability of new maize accessions into the genebank collection. This study examined 1279 maize germplasm accessions from the Agricultural Genebank Indonesia. The maize germplasm collection was divided into two parts. The first part, namely subset A, contains 600 accessions, which acted as original collections and were randomly selected for calculating the diversity values in each kernel character using the Shannon-Weaver diversity index. The second part, subset B, consisting of 679 accessions, was used to determine whether each accession was similar or different from subset A using an Excel macro-based application built by the authors. Principal component analysis (PCA) and Mahalanobis distances were used in the first step to identify outliers in data points with nine independent variables, namely kernel type, kernel color, presence of white cap, mottled type, kernel upper surface shape, kernel weight, kernel length, width, and thickness. Seventeen outlier samples, detected through PCA and Mahalanobis distances, were intentionally excluded from the dataset to ensure the integrity of subsequent machine learning analyses. The subset B was then divided into two parts to perform conventional and novel machine learning, i.e., linear discriminant analysis (LDA) and Tabnet. The results of this study show that the model's accuracy of LDA and TabNet were 89.36% and 86.4%, respectively. By integrating the Shannon-Weaver diversity index and machine learning methodologies, this research offers a comprehensive decision support system for guiding the acceptance of new maize accessions. The proposed system implies optimizing genebank strategies for the integrity and adaptability of maize germplasm collections.
Shannon-Weaver diversity index, machine learning, accession, maize, core collection, genebank, TabNet
Maize (Zea mays L.) is one of the world's most important cereal crops, providing a staple food supply for millions of people and crucial feedstock for cattle [1]. The genetic diversity of maize contains a wide range of traits that contribute to its adaptability, yield, and nutritional quality [2]. Despite shifting climate conditions and changing customer preferences, managing and preserving this diversity is critical for protecting food security and sustainable agriculture practices [3].
The concept of a core collection developed as a strategic approach to representing a species' genetic diversity in a manageable element, making preservation and exploitation more practical. The structure of a collection influences its ability to facilitate breeding activities, germplasm exchange, and trait exploration. In a gene bank, a core collection is a subset of the entire germplasm collection that depicts a species' genetic diversity in a more manageable arrangement [4].
While core collections provide several benefits, it is critical to attain a balance between depicting genetic variety and practical manageability of the whole collection in the genebank. Some constraints should be considered when adding more varieties to the genebank collection [5]. First, genebanks' storage space, budgets, and staff expertise are frequently limited. Continuously increasing the germplasm collection by incorporating the new accession may strain these resources and risk the overall effectiveness of genebank activities [6]. Second, an overabundance of the collection may degrade its representativeness. Adding too many accessions, particularly those closely related to present collection members, may impair the collection's ability to capture unique gene variations efficiently [7]. Third, the fundamental purpose of a core collection is to provide a valuable resource for researchers and breeders. Excessive expansion of the core collection may reduce its usability by adding unnecessary complexity or redundancy [8].
Expert judgment based on phenotypic traits and basic knowledge of genetic diversity has traditionally guided the decision of germplasm acquisition in the genebank. There is no approach that all experts agree on to determine a decision [5]. Various genebank institutions employ diverse methodologies to curate their collections. One approach involves screening collections for specific traits of interest, such as protein and lysine content in wheat [9]. Alternatively, evaluating accessions based on their breeding potential considers factors like color profiling and total polyphenolic content in sour cherry [10]. Optimization tools like Kullback-Leibler divergence assist in efficient resource allocation and selecting accessions for genotyping [11]. Moreover, genebanks prioritize collection growth, considering national programs, stakeholder involvement, diversity scope, and available funding [12].
The Shannon-Weaver diversity index is one of the methods that has long been used in ecology to measure species diversity within a population. This index quantifies species richness and evenness, providing an intuitive measure of diversity. This index provides an alternate perspective for evaluating the contribution of new accessions to the collection by converting genetic diversity into a measurable value [13]. While the Shannon-Weaver diversity index offers advantages, it also has disadvantages when applied to the decision-making process of adding a new accession to a genebank's collection. Some drawbacks include sensitivity to abundance, incapability of genetic information reflection at the DNA level, lack of trait specificity, failure to address redundancy, and subjectivity in parameter selection. Thus, incorporating the Shannon-Weaver diversity index into the decision-making process of adding new accession to a genebank collection should be done cautiously [13].
However, there is an opportunity to improve the decision-making process of germplasm acquisition into genebank collection in the era of data-driven insights and machine learning. Linear Discriminant Analysis (LDA), a conventional supervised machine learning method, emerges as a potential decision-support tool in this case. LDA, a powerful multivariate statistical technique, has found extensive use in pattern recognition, classification, and dimensionality reduction tasks [14, 15]. In the context of limiting the addition of collection, LDA has the potential to examine the discriminative capacity of new accessions by identifying the underlying factors contributing to their distinctiveness and similarity with existing collections. Using the genetic and phenotypic information associated with each accession, LDA can help differentiate valuable additions from those that may not contribute significantly to the genebank collection's representativeness [16, 17].
Another machine learning, TabNet, a novel method, represents an innovative deep learning structure designed for handling tabular data. Employing a sequential attention mechanism, TabNet selects relevant features at each decision step, ensuring the effective utilization of the model's capacity for the most meaningful attributes. Additionally, this instance-level feature selection approach not only enhances the efficiency of the learning process but also facilitates a clearer understanding of decision-making by allowing visualization of the selection masks [18].
This study aims to investigate and assess the utility of the Shannon-Weaver diversity index and machine learning as a decision support system on the acceptability of new maize accessions into the genebank collection. The importance of this study arises from the crucial need to achieve an ideal compromise between expanding the collection to include valuable genetic diversity and ensuring the collection remains focused, representational, and practical for a wide range of applications. To the best of the authors' knowledge, no publication has been published that discusses the development of a decision support system for acquiring new accessions into the maize collection in the genebank using the Shannon-Weaver diversity index and machine learning.
In introducing a novel integration of the Shannon-Weaver diversity index and machine learning, this research enhances precision in genebank management for maize accession selection. The proposed system is expected to offer a framework for optimizing accession strategies, ensuring the integrity and adaptability of maize germplasm collections.
2.1 Germplasm materials
This study examined 1279 maize germplasm accessions from the Agricultural Genebank Indonesia. The production dates of the seed vary, ranging from 2006 to 2020. Nine kernel properties, consisting of five qualitative and four quantitative traits, were observed using a maize plant descriptor (IBPGR-CIMMYT 1991) with minor modifications. According to the standard score, qualitative kernel characters, i.e., kernel type, kernel color, presence of white cap, mottled type, and kernel upper surface shape, were visually observed. Quantitative kernel characters, i.e., 1000-kernel weight, were calculated using the ISTA method, and kernel length, width, and thickness measurements were taken from 10 randomly chosen kernels from the seed storage across all accessions [19].
2.2 Shannon-Weaver diversity index
The maize germplasm accessions dataset was divided into two parts. The first part, Subset A, comprises 600 accessions selected through a random process using the RAND() function in Excel. This subset serves as the original collection in this study and was utilized for calculating diversity values in each kernel character through the Shannon-Weaver diversity index (Eq. (1)). The average Shannon-Weaver diversity index (H') of the nine traits became the threshold value to determine whether the new accession is similar or different compared to the original collection.
$H^{\prime}=\sum_{i=0}^n p_i \log _e p_{i^4}$ (1)
where, pi = frequency of phenotypic class data, n = number of class data.
The second part of the data, consisting of 679 accessions (Subset B), was used to determine whether each accession was similar or different from the original collection using an Excel macro-based application built by the authors (Figure 1). The decision was determined in the description as follows. If H' of a new accession addition > H' of the original collection, the new accession was determined different and can be accepted as a new collection. Vice versa, if the H' of a new accession addition ≤ H' of the original collection, the new accession was determined similar and can be rejected to be acquired into the original collection.
Figure 1. Maize germplasm acquisition assistance
2.3 Outlier detection
The Subset B dataset consists of 9 traits, i.e., kernel type, kernel color, presence of white cap, mottled type, kernel upper surface shape, 1000-kernel weight, kernel length, width, and thickness as independent variables, and decision parameters as dependent variables. Outlier detection was performed as follows.
Principal component analysis (PCA) and Mahalanobis distances were used to identify outliers in data points with nine independent variables. Data that deviates from the Mahalanobis distance curve is regarded as an outlier. Outlier detection was performed utilizing the mt package with a specified confidence level of 0.975 for the Mahalanobis distances [20]. The data was zero-centered and scaled before the analysis to ensure accurate results.
2.4 Machine learning
Upon the successful removal of outliers, the Subset B dataset was randomly partitioned into two distinct segments to facilitate the machine learning process. The initial segment, constituting 70% of the dataset, was designated as the training data, allowing for the construction and development of the machine learning model. The latter segment, comprising 30% of the dataset, was the designated prediction dataset for validating the trained model's predictive capabilities. The machine learning procedure was conducted using R application version 4.2.2 in conjunction with the Rcmdr package [21, 22], ensuring a comprehensive and systematic approach to the data analysis within the defined research framework. The machine learning techniques employed in this study encompass both conventional and novel approaches, with linear discriminant analysis (LDA) representing the conventional method and TabNet serving as the innovative counterpart.
2.4.1 Linear discriminant analysis
The LDA model provided crucial outputs, including the coefficients of linear discriminants, a comprehensive confusion matrix, and the accuracy level. The first discriminant function (LD1), a pivotal linear combination derived from the nine identified traits, was visually represented through a boxplot to effectively evaluate the precision and efficacy of the developed LDA model. These analytical outcomes and visual representations are instrumental in understanding the discriminative abilities of the model and its potential applications within the studied domain.
Linear discriminant analysis was conducted employing the MASS package [23], with the following formula: Decision = kernel type + kernel color + presence of white cap + mottled type + kernel upper surface shape + kernel weight + kernel length + width + thickness. Notably, the class proportion was maintained as equal, and the method relied on standard mean and variance estimators. Furthermore, insightful visualizations were created from the analysis results using the ggplot2 package.
2.4.2 TabNet
The Subset B dataset underwent a normalization process before being utilized for training a TabNet model using the tabnet package [18]. The model was initialized with an epoch value of 100, a validation split ratio of 0.1, and a learning rate set to 5e-3. Subsequently, the trained model was applied to the prediction dataset for a comprehensive evaluation, encompassing key performance metrics such as accuracy, precision, recall, and the roc auc value. This thorough analysis provides valuable insights into the model's predictive capabilities and potential for effective application within the study's context.
3.1 Shannon-Weaver diversity index
The diversity assessment of the Subset A collection, consisting of 600 randomly selected maize accessions, was conducted using the Shannon–Weaver diversity index (H′). Table 1 provides an overview of each trait's calculated Shannon Index values, with an average value of 1.945892, indicating substantial diversity within the collection. H' values range from 0 to 5, usually 1.5 to 3.5. Higher H' values indicate greater species diversity in a population. Conversely, a low H' value implies a lack of species variety [24].
In accordance with the present results, previous studies have demonstrated that the average H' value for the common maize type ranges from 1.83-2.02, while it ranges for popcorn maize type from 1.41-1.67. This previous study used sampling variables as follows: the identification of the landraces (name, cultivation time, and risk factors of loss), morphological characteristics of the kernel (type of endosperm, size, and color), geographical location (municipality, community, longitude, and latitude), use values and conservation. The variation in the Shannon index is related to the variability in the number of samples acquired from the different sampling methods [25].
Table 1. Shannon-Weaver diversity index (H′) of the original collection
|
No. |
Traits |
H' |
|
1 |
Kernel type |
0.758567 |
|
2 |
Kernel colour |
1.477076 |
|
3 |
Whitecap |
0.692792 |
|
4 |
Mottled type |
0.346548 |
|
5 |
Upper shape surface shape |
0.903054 |
|
6 |
Kernel length |
3.005305 |
|
7 |
Kernel width |
2.705407 |
|
8 |
Kernel thickness |
2.655456 |
|
9 |
1000 seed weight |
4.968826 |
|
10 |
Average |
1.945892 |
Various maize accessions with an average H' value of 1.945892 indicate a generally equal abundance of a balanced distribution of genetic resources that may benefit a broad range of breeding purposes, environmental issues, and consumer preferences (Table 1). As a result, subset A of the present study can serve as a source of genetic variation that may be strategically used for crop research and development. In this case, the Shannon–Weaver diversity index provides a foundation for subsequent analyses and decision-making processes.
While the decision rule based on the Shannon-Weaver index and the average H' value serves as a valuable tool for accession selection, it is essential to acknowledge potential limitations associated with this approach. One notable limitation is the sensitivity of the threshold to variations in germplasm characteristics. The average H' value may not capture subtle nuances in diversity patterns, potentially leading to the inclusion or exclusion of accessions based on an overarching criterion. Moreover, the Shannon-Weaver diversity index is often used for a single parameter in its conventional application [26].
This raises considerations about its applicability to multidimensional datasets, where interactions among various traits might not be fully captured. The effectiveness of this approach could also be influenced by the scale and distribution of diversity within the germplasm collection. Variability in traits or genetic markers might affect the generalizability of the threshold, making it crucial to consider the context and specific objectives of the genebank carefully.
3.2 Outliers detection
Principal Component Analysis (PCA) and Mahalanobis distances were conducted as a preliminary step before proceeding with machine learning. The purpose of PCA and Mahalanobis distances was to detect any outliers in the dataset that could affect the accuracy and robustness of subsequent analyses. In this context, outliers are data points that differ significantly from the general pattern represented by most of the data [27].
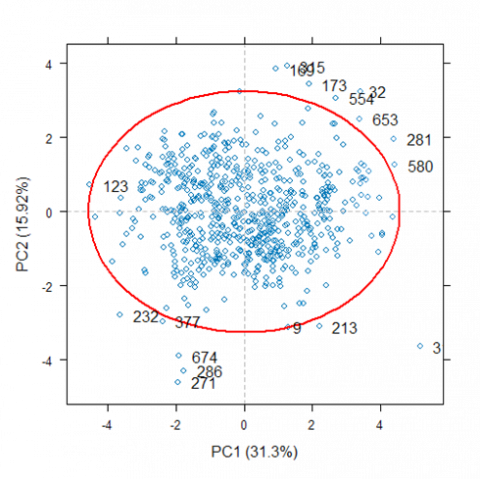
Figure 2. The outliers detection using principal component analysis
The red ellipse was the Mahalanobis distance curve. The outliers were samples that were located outside of the red ellipse.
The total variation explained by the first two principal components, PC1 and PC2, was 47.22% of the total variance in the original dataset (Figure 2). The total value of 47.22% indicates that nearly half of the variability in the original dataset is captured in PC1 and PC2. PC1 and PC2 provide a valuable basis for visualizing variations within data by accounting for almost half of the variance. As a result, any trends, clusters, or groups revealed in a scatter plot, or PCA plot based on these components are likely to correlate closely with the most significant characteristics of the dataset [28]. The results of PCA and Mahalanobis distances revealed the presence of 17 outlier samples (number 9, 32, 123, 169, 173, 213, 232, 271, 281, 286, 313, 315, 377, 554, 580, 653, 674), depicted visually outside the bounds of the red ellipses in Figure 2. These ellipses are graphical representations of the statistical distribution of the data, with points beyond the ellipse boundary lines indicating probable outliers.
Identifying these outliers is critical because they can significantly impact subsequent analyses, potentially resulting in skewed or incorrect results. Outliers can occur because of measurement errors, data entry errors, or exceptional traits that do not match most of the dataset. While removing outliers improves analysis quality, it is critical to recognize that outlier detection and removal might impact the general composition of the dataset. As a result, while employing outlier removal techniques, researchers must exercise caution and transparency, ensuring that the rationale and methodology are properly stated [28].
The identified outlier samples were purposely removed from the dataset to maintain the integrity and reliability of subsequent machine learning. Machine learning can then be performed on a dataset more representative of the underlying genetic and phenotypic variability in maize accessions.
3.3 Linear discriminant analysis
Table 2 shows the coefficients of linear discriminant produced by the LDA on the exclude-identified outliers dataset. The highest negative coefficient in the mottled type indicates a substantial negative impact on the decision. This trait seems to be a significant determinant. The upper shape surface shape is the following trait with the highest coefficient value. A positive coefficient indicates that the upper surface shape of the kernels is aligned with the decision class.
Table 2. Coefficients of linear discriminants
|
Traits |
LD1 |
Confidence Intervals |
|
|
2.50% |
97.50% |
||
|
Kernel type |
0.1238 |
-0.1100 |
0.4999 |
|
Kernel colour |
0.0716 |
0.0044 |
0.4421 |
|
Whitecap |
0.1198 |
-0.1734 |
0.3075 |
|
Mottled type |
-1.2002 |
-1.1460 |
-0.7044 |
|
Upper shape surface shape |
0.5764 |
-0.0203 |
0.6223 |
|
Kernel length |
-0.0071 |
-0.4537 |
0.3226 |
|
Kernel width |
-0.0235 |
-0.5104 |
0.1694 |
|
Kernel thickness |
-0.044 |
-0.5247 |
-0.0117 |
|
1000 seed weight |
0.0038 |
-0.2111 |
0.5465 |
Following the LDA model, the bootstrap confidence intervals for the LD1 coefficients offer valuable insights into predictor variables' robustness and statistical significance in predicting group distinctions (Table 2). In general, if the confidence interval includes zero, it implies that the corresponding variable may not be statistically significant in predicting the group differences represented by LD1. On the other hand, if the interval does not include zero, it suggests that the variable is likely to be statistically significant in explaining the variation in LD1. For example, the true effect of kernel type is likely to be within the range covered by the 95% confidence interval for the coefficient of kernel type, which is between -0.1100 and 0.4999. If this interval includes zero, it suggests potential non-significance. Conversely, the interval for mottled type (-1.14600-0.7044) does not encompass zero, implying a statistically significant negative impact on LD1.
Table 3. Confusion matrix
|
Different |
Similar |
|
|
Different |
3 |
2 |
|
Similar |
19 |
174 |
The obtained confusion matrix achieved by the LDA model is presented in Table 3. The matrix contrasts the model's predictions with the actual classes across different and similar categories. True positives (TP) and true negatives (TN) are occurrences that were accurately classified in their respective classifications, with 3 and 174 cases, respectively. The model, however, tended to false positive (FP) and false negative (FN) errors, incorrectly categorizing two occurrences as similar when they were different and incorrectly classifying 19 occurrences as different when they belonged to a similar group. The model's accuracy, calculated as (TP + TN) divided by the total cases, was 89.36%, generally considered promising.
The LDA model reveals insightful information regarding the prior probabilities of group assignments. The provided probabilities indicate the likelihood of an observation belonging to each group before incorporating any information derived from the predictor variables. Specifically, the analysis reveals a prior probability of approximately 14.01% for the different group and 85.99% for the similar group. These probabilities represent the inherent distribution of observations in the training dataset across the identified groups.
The assessment of whether a Linear Discriminant Analysis (LDA) accuracy is good or bad is influenced by several factors, including the research's context, scope, and objective. No accepted criteria indicate an excellent or lousy accuracy because it varies greatly depending on multiple factors. Generally, accuracy above 80% is considered good [29-32]. As a result, the LDA model, which has an accuracy of 89.36%, can be considered a decision support system for adding new accessions to the maize germplasm collection.
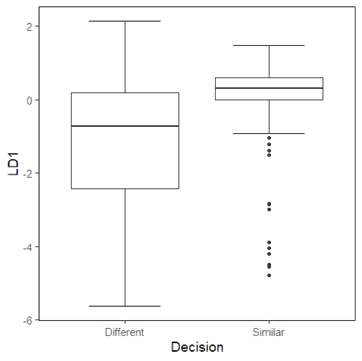
Figure 3. Boxplot of the linear discriminant value of the decision (The black circle is considered outlier data)
LDA, a decision support system for adding new additions to the maize germplasm collection, is supported by differences in similar and different decision distribution data (Figure 3). Figure 3 shows that LD1 values of the similar decision are in the positive data range, whereas different decision values are in the negative data range.
The black circles represent outliers with the negative value of LD1 (Figure 3). Based on Figure 3, negative values of LD1 should be considered as decision different, which is decided to be accepted into the collection. These findings further support the concept that LDA can be used as an accurate decision-support system. The accumulation of different and outlier data yields 21, accounting for 10.6%. This percentage corresponds to the average size for core collection development, which is 10%, which is considered to represent the entire collection [33, 34]. Previous research on maize core collection development at the same genebank reported that a similar number (11.7%) had retained the entire collection's maximum diversity [35].
3.4 TabNet
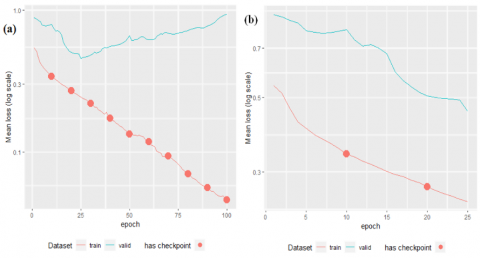
The findings derived from the supervised training model, conducted over 100 epochs, have been visually illustrated in Figure 4(a). Notably, the analysis reveals a discernible trend wherein the model begins to exhibit signs of overfitting subsequent to epoch 25, coinciding with the point at which the validation-set loss attains its minimum value. Drawing from these crucial observations, the authors made an informed decision to opt for the intrinsic features of the model at epoch 25 (Figure 4(b)).
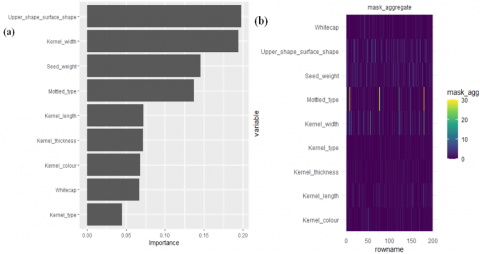
Illustrated in Figure 5(a) are the pivotal parameters contributing to the construction of the model, specifically emphasizing the upper shape surface shape and kernel width. The mask distribution across the upper shape surface shape, as depicted in Figure 5(b), exhibits a notably even dispersion compared to the distribution observed for kernel width. However, it is noteworthy that the kernel width demonstrates a significantly higher mask value in select samples, as denoted by its lighter color.
This observation underscores the comparable significance of the importance value associated with both the upper shape surface shape and the kernel width. It highlights the pivotal role played by the distribution and value of the mask, emphasizing their contribution to the determination of the overall importance of parameter value within the framework of the model (Figure 5(a) and (b)).
Figure 4. The model with supervised training (a) epoch=100, (b) epoch=25
Figure 5. Intrinsic explainability feature (a) Importance value (b) Mask aggregate value
Table 4. Confusion matrix
|
Different |
Similar |
|
|
Different |
3 |
0 |
|
Similar |
27 |
168 |
The presented confusion matrix in Table 4 illustrates the model's performance in distinguishing between instances categorized as different and similar. The model accurately classified three samples as different and 168 as similar, signifying a strong predictive capability in identifying similar samples.
The absence of false negatives in the results suggests that the model effectively avoided misclassifying any samples of different as similar, underscoring its adeptness in mitigating false negative errors (Table 4). These findings highlight the model's reliability in accurately categorizing samples, demonstrating its efficacy in decision-making and its potential for dependable performance in differentiating between the specified categories. However, the presence of 27 false positives, as indicated by samples incorrectly classified as similar when they were different, underscores a notable limitation within the model's sensitivity to specific classification categories (Table 4). These findings emphasize the necessity for further investigation to enhance the model's discriminative abilities, particularly in minimizing false positive errors and improving its overall classification accuracy.
Table 5 provides an overview of the model's performance metrics, including accuracy, precision, recall, and roc auc, obtained at epoch 25. The recorded accuracy of 86.40% indicates a high overall correctness in the model's predictions. The precision value of 100% underscores the model's proficiency in accurately identifying positive samples. However, the comparatively lower recall value of 10.00% highlights a challenge in capturing the complete set of actual positive instances.
Table 5. Performance
|
Parameter |
Performance |
|
accuracy |
0.864 |
|
precision |
1.000 |
|
recall |
0.100 |
|
roc_auc |
0.460 |
Furthermore, the roc auc value of 46.0% indicates the model's moderate to low discriminative ability in distinguishing between positive and negative classes. The low roc auc value is likely attributed to class imbalance, as evidenced by the disparities in the Shannon-Weaver diversity index (H’) values across traits in Table 1.
Class imbalance in machine learning occurs when there is an unequal distribution of training samples among different classes. This imbalance can result in biased models, where the majority class dominates the training process, leading to an inadequate representation of the minority class. Such imbalance poses challenges, fostering unfairness among classes and compromising the model's generalization ability. The impact is particularly significant in applications like healthcare, where biased models can hinder accurate diagnoses [36, 37].
3.5 Comparison between machine learning model
Linear Discriminant Analysis (LDA) and TabNet models as decision support systems for acquiring new maize accessions revealed distinctive insights into their respective predictive capabilities within the maize germplasm collection. Despite showcasing an impressive accuracy of 89.36%, the application of LDA encountered limitations in effectively differentiating between different and similar categories, as evident from the confusion matrix in Table 3. Conversely, the TabNet model, as depicted in Table 4, demonstrated robustness in identifying samples classified as similar, although it exhibited a constraint in effectively recognizing samples categorized as different. The TabNet model showed a moderate accuracy of 86.4%, alongside a precision of 100% and a relatively lower recall value of 10.0%, emphasizing its proficiency in correctly identifying positive samples but encountering challenges in comprehensively capturing the entire set of positive samples.
Further scrutiny into the intrinsic explainability features revealed significant associations between the upper shape surface shape and the kernel width in the TabNet model, as highlighted in Figure 5. In contrast, the LDA model, detailed in Table 2, emphasized the considerable impact of traits such as mottled type and upper shape surface shape on the decision-making process. While both models offered valuable insights into the characterization of maize accessions, the TabNet model exhibited a notable capacity to capture intrinsic complexities within the dataset. In contrast, the LDA model underscored the significance of specific traits in the decision-making process, albeit with certain limitations in classification accuracy.
Considering trade-offs, TabNet may offer computational efficiency for handling complex patterns, while LDA is computationally less demanding as a linear model. LDA provides straightforward interpretability, whereas TabNet's complex architecture may pose challenges. Ease of use favors LDA as a traditional method, while TabNet may require more expertise and resources. Ultimately, the choice should align with specific application requirements.
Linear discriminant analysis has found widespread application within the agricultural sector, notably in decision support systems. For instance, its utility was demonstrated in identifying fusarium head blight in winter wheat ears. Traditionally, disease assessment methods heavily relied on subjective visual inspections carried out by farmers or pathologists in the field. However, such visual ratings are inherently subjective, leading to potential error variations based on the evaluator's expertise. Leveraging LDA, this study achieved an accuracy of 77.1%, 85.7%, and 62.9% for the side, front, and erect angles, respectively, in spectral analysis and image processing [38].
TabNet is increasingly being recognized as a valuable asset in agricultural decision-making processes. Its effectiveness is evident in constructing crop classification models, as exemplified in a recent study. The incorporation of channel attention into the TabNet method notably enhanced its performance, particularly in crop classification and extraction within the cultivated land area of Inner Mongolia. The model's derived crop planting area strongly complies with the corresponding statistical data, highlighting the efficacy of the proposed classification approach for accurate and refined crop extraction across expansive agricultural regions [39].
In conclusion, this study aimed to investigate and assess the utility of the Shannon-Weaver diversity index and machine learning as a decision support system for determining the acceptability of new maize accessions into the genebank collection. The developed machine learning model, utilizing both Linear Discriminant Analysis (LDA) and TabNet, demonstrated high accuracies of 89.36% and 86.4%, respectively. The utilization of Linear Discriminant Analysis (LDA), a conventional and established method, facilitates an extensive investigation into the role of distinct traits in the decision-making process within maize germplasm collections. In contrast, the adoption of TabNet, a cutting-edge deep learning architecture, facilitated the intricate analysis of complex patterns and intrinsic feature distributions, thereby enabling a more nuanced understanding of the dataset. The proposed system, integrating established and advanced techniques, holds significant implications for the broader scientific community involved in genebank management by offering a framework to optimize accession strategies, ensuring the integrity and adaptability of maize germplasm collections. The model's accuracy is limited by its reliance on the Shannon index to assess diversity within the input database to develop the machine learning model. To establish a robust decision support system for acquiring new accessions into genebank collections, future research should focus on alternative methods for determining similarity or different, beyond the Shannon–Weaver diversity index. Exploring methods such as Principal Component Analysis (PCA) and comparing their effectiveness in conjunction with machine learning approaches could enhance the understanding and accuracy of accession selection strategies.
The authors thank Dr. Mastur, the Director of BSIP Biogen, for the access to the maize germplasm at the genebank. This work is supported by DIPA ICABIOGRAD fiscal year of 2020 for financial support of this study.
[1] Tanumihardjo, S.A., McCulley, L., Roh, R., Lopez-Ridaura, S., Palacios-Rojas, N., Gunaratna, N.S. (2020). Maize agro-food systems to ensure food and nutrition security in reference to the Sustainable Development Goals. Global Food Security, 25: 100327. https://doi.org/10.1016/j.gfs.2019.100327
[2] Gedil, M., Menkir, A. (2019). An integrated molecular and conventional breeding scheme for enhancing genetic gain in maize in Africa. Frontiers in Plant Science, 10: 490537. https://doi.org/10.3389/fpls.2019.01430
[3] Swarup, S., Cargill, E.J., Crosby, K., Flagel, L., Kniskern, J., Glenn, K.C. (2021). Genetic diversity is indispensable for plant breeding to improve crops. Crop Science, 61(2): 839-852. https://doi.org/10.1002/csc2.20377
[4] Raturi, D., Chaudhary, M., Bhat, V., Goel, S., Raina, S.N., Rajpal, V.R., Singh, A. (2022). Overview of developed core and mini core collections and their effective utilization in cultivated rice and its related species (Oryza sp.)—A review. Plant Breeding, 141(4): 501-512. https://doi.org/10.1111/pbr.13029
[5] Mascher, M., Schreiber, M., Scholz, U., Graner, A., Reif, J.C., Stein, N. (2019). Genebank genomics bridges the gap between the conservation of crop diversity and plant breeding. Nature Genetics, 51(7): 1076-1081.
[6] Herbold, T., Engels, J.M.M. (2023). Genebanks at risk: Hazard assessment and risk management of national and international genebanks. Plants, 12(15): 2874.
[7] Hyun, D.Y., Gi, G.Y., Sebastin, R., Cho, G.T., Kim, S.H., Yoo, E., Lee, S., Son, D.M., Lee, K.J. (2020). Utilization of phytochemical and molecular diversity to develop a target-oriented core collection in tea germplasm. Agronomy, 10(11): 1667. https://doi.org/10.3390/agronomy10111667
[8] Soleimani, B., Lehnert, H., Keilwagen, J., Plieske, J., Ordon, F., Rad, S.N., Ganal, M., Beier, S., Perovic, D. (2020). Comparison between core set selection methods using different Illumina marker platforms: A case study of assessment of diversity in wheat. Frontiers in Plant Science, 11: 531292. https://doi.org/10.3389/fpls.2020.01040
[9] Berkner, M.O., Weise, S., Reif, J.C., Schulthess, A.W. (2023). Genomic unveiling of the diversity in grain protein and lysine content throughout a genebank collection of winter wheat. bioRxiv. https://doi.org/10.1101/2023.07.05.547805
[10] Desiderio, F., Szilagyi, S., Békefi, Z., Boronkay, G., Usenik, V., Milić, B., Mihali, C., Giurgiulescu, L. (2023). Polyphenolic and fruit colorimetric analysis of hungarian sour cherry genebank accessions. Agriculture, 13(7): 1287. https://doi.org/10.3390/agriculture13071287
[11] Reyes-Valdés, M.H., Burgueño, J., Sansaloni, C.P., Payne, T., Pacheco, A., González-Cortés, A. (2022). Metrics for optimum allocation of resources on the composition and characterization of crop collections: The CIMMYT wheat collection as a proof of concept. Australian Journal of Crop Science, 16(5): 580-586.
[12] Leroy, G., Blackburn, H., Danchin-Burge, C., Tejerina Ampudia, F., Hiemstra, S.J., Ligda, C., Boettcher, P., Baumung, R. (2022). Genebank collections in relation to risk status in livestock species. In Proceedings of 12th World Congress on Genetics Applied to Livestock Production (WCGALP): Technical and species orientated innovations in animal breeding, and contribution of genetics to solving societal challenges, pp. 1057-1060.
[13] Zhao, Z., Hui, G., Yang, A., Zhang, G., Hu, Y. (2022). Assessing tree species diversity in forest ecosystems: A new approach. Frontiers in Ecology and Evolution, 10: 971585. https://doi.org/10.3389/fevo.2022.971585
[14] Nanga, S., Bawah, A.T., Acquaye, B.A., Billa, M.I., Baeta, F.D., Odai, N.A., Obeng, S.K., Nsiah, A.D. (2021). Review of dimension reduction methods. Journal of Data Analysis and Information Processing, 9(3): 189-231. https://doi.org/10.4236/jdaip.2021.93013
[15] Li, S., Zhang, H., Ma, R., Zhou, J., Wen, J., Zhang, B. (2023). Linear discriminant analysis with generalized kernel constraint for robust image classification. Pattern Recognition, 136: 109196. https://doi.org/10.1016/j.patcog.2022.109196
[16] Barrett, C.F., Santee, M.V., Fama, N.M., Freudenstein, J.V., Simon, S.J., Sinn, B.T. (2022). Lineage and role in integrative taxonomy of a heterotrophic orchid complex. Molecular Ecology, 31(18): 4762-4781. https://doi.org/10.1111/mec.16617
[17] Akter, S., Wos-Oxley, M.L., Catalano, S.R., Hassan, M.M., Li, X., Qin, J.G., Oxley, A.P. (2023). Host species and environment shape the gut microbiota of cohabiting marine bivalves. Microbial Ecology, 86(3): 1755-1772. https://doi.org/10.1007/s00248-023-02192-z
[18] Arik, S.Ö., Pfister, T. (2021). Tabnet: Attentive interpretable tabular learning. In Proceedings of the AAAI conference on artificial intelligence, 35(8): 6679-6687. https://doi.org/10.1609/aaai.v35i8.16826
[19] Risliawati, A., Sobir, S., Trikoesoemaningtyas, T., Suwarno, W.B., Lestari, P. (2022). Existing diversity profile for kernel characteristics of maize germplasm in IAARD-ICABIOGRAD gene bank. In AIP Conference Proceedings, 2462(1): 020007. https://doi.org/10.1063/5.0075178
[20] Lin, W. (2022). Metabolomics data analysis toolbox. R package version 2.0-1.19. https://cran.csail.mit.edu/web/packages/mt/mt.pdf.
[21] R Core Team. (2014). R: A language and environment for statistical computing. Computer Science, Mathematics.
[22] Fox, J. (2005). The R commander: A basic-statistics graphical user interface to R. Journal of statistical software, 14(9): 1-42. https://doi.org/10.18637/jss.v014.i09
[23] Venables, W.N., Ripley, B.D. (2013). Modern Applied Statistics with S-PLUS. Springer Science & Business Media.
[24] Khoobdel, M., Keshavarzi, D., Mossa-Kazemi, S.H., Sobati, H. (2019). Species diversity of mosquitoes of the Genus Culex (Diptera, Culicidae) in the coastal areas of the Persian Gulf. AIMS Public Health, 6(2): 99. https://doi.org/10.3934%2Fpublichealth.2019.2.99
[25] Vidal, R., Silva, N.C.D.A., Ogliari, J.B. (2019). Old tools as new support for on farm conservation of different types of maize. Scientia Agricola, 77: e20180091. https://doi.org/10.1590/1678-992X-2018-0091
[26] Vodyanitskii, Y.N. (2017). Shannon–Weaver index as an integrated indicator of metal differentiation in soil and plant samples. Moscow University Soil Science Bulletin, 72: 175-179. https://doi.org/10.3103/S0147687417040081
[27] Privé, F., Luu, K., Blum, M.G., McGrath, J.J., Vilhjálmsson, B.J. (2020). Efficient toolkit implementing best practices for principal component analysis of population genetic data. Bioinformatics, 36(16): 4449-4457. https://doi.org/10.1093/bioinformatics/btaa520
[28] Leys, C., Delacre, M., Mora, Y.L., Lakens, D., Ley, C. (2019). How to classify, detect, and manage univariate and multivariate outliers, with emphasis on pre-registration. International Review of Social Psychology, 32(1). http://doi.org/10.5334/irsp.289
[29] Miralles-Muñoz, F.A., Gonzalez-Parreño, S., Martinez-Mendez, D., Gonzalez-Navarro, B., Ruiz-Lozano, M., Lizaur-Utrilla, A., Alonso-Montero, C. (2022). A validated outcome categorization of the knee society score for total knee arthroplasty. Knee Surgery, Sports Traumatology, Arthroscopy, 30(4): 1266-1272. https://doi.org/10.1007/s00167-021-06563-2
[30] Fernandes, B.S., Karmakar, C., Tamouza, R., et al. (2020). Precision psychiatry with immunological and cognitive biomarkers: A multi-domain prediction for the diagnosis of bipolar disorder or schizophrenia using machine learning. Translational Psychiatry, 10(1): 162. https://doi.org/10.1038/s41398-020-0836-4
[31] Dutt, A., Ismail, M.A. (2019). Can we predict student learning performance from LMS data? A classification approach. In Proceedings of the 3rd International Conference on Current Issues in Education (ICCIE 2018), pp. 24-29. https://doi.org/10.2991/iccie-18.2019.5
[32] Perfecto-Avalos, Y., Garcia-Gonzalez, A., Hernandez-Reynoso, A., et al. (2019). Discriminant analysis and machine learning approach for evaluating and improving the performance of immunohistochemical algorithms for COO classification of DLBCL. Journal of translational medicine, 17: 1-12. https://doi.org/10.1186/s12967-019-1951-y
[33] Galwey, N.W. (1995). Verifying and validating the representativeness of a core collection. Core Collections of Plant Genetic Resources, 187-198.
[34] Brown, A.H.D. (1989). Core collections: A practical approach to genetic resources management. Genome, 31(2): 818-824. https://doi.org/10.1139/g89-144
[35] Risliawati, A., Suwarno, W.B., Lestari, P., Trikoesoemaningtyas, Sobir. (2023). A strategy to identify representative maize core collections based on kernel properties. Genetic Resources and Crop Evolution, 70(3): 857-868. https://doi.org/10.1007/s10722-022-01469-5
[36] Wu, O. (2023). Rethinking class imbalance in machine learning. ArXiv:2305.03900. https://doi.org/10.48550/arXiv.2305.03900
[37] Ganaie, M.A., Sajid, M., Malik, A.K., Tanveer, M. (2023). Graph embedded intuitionistic fuzzy RVFL for class imbalance learning. ArXiv:2307.07881. https://doi.org/10.1109/TNNLS.2024.3353531
[38] Huang, L., Wu, Z., Huang, W., Ma, H., Zhao, J. (2019). Identification of fusarium head blight in winter wheat ears based on fisher’s linear discriminant analysis and a support vector machine. Applied Sciences, 9(18): 3894. https://doi.org/10.3390/app9183894
[39] Tang, J., Zhang, X., Chen, Z., Bai, Y. (2022). Crop identification and analysis in typical cultivated areas of Inner Mongolia with single-phase sentinel-2 images. Sustainability, 14(19): 12789. https://doi.org/10.3390/su141912789