Rita Hayati![]() | Firzha Ade Maulina
| Firzha Ade Maulina![]() | Agus Arip Munawar*
| Agus Arip Munawar*![]()
© 2024 The authors. This article is published by IIETA and is licensed under the CC BY 4.0 license (http://creativecommons.org/licenses/by/4.0/).
OPEN ACCESS
Presented paper aimed to apply the near infrared spectroscopy (NIRS) for rapid, non-destructive and simultaneous prediction of moisture and fat content on intact cocoa beans. Near infrared spectral data were acquired using a portable NIRS instrument (PSD NIRS i16, Universitas Syiah Kuala) in the wavelength range of 1000-2500 nm. Actual moisture and fat contents were measured and determined by means of thermo-gravimetry and soxhlet methods respectively. Spectral data were enhanced and corrected using standard normal variate (SNV) and de-trending order 2 (Dt-2) methods. Prediction models, used to determine the moisture and fat contents were established using partial least square regression (PLSR) and principal component regression (PCR). The results showed that moisture content and fat content can be predicted non-destructively and simultaneously using NIRS with maximum prediction index (RPD) are 2.16 for moisture content and 2.39 for fat content respectively which can be categorized as good model performances. Moreover, SNV found to be the ebst spectra correction method in predicting both moisture and fat contents.
NIRS, cacao, moisture content, fat content, regression models
Cocoa (Theobroma cacao L.) holds great significance in Indonesia as it is the world's largest producer of cocoa, contributing significantly to the country's foreign exchange. Indonesia consistently produces around 550 thousand tons of cocoa beans each year, making it a consistent player in the global cocoa market [1]. Additionally, smallholder cocoa cultivation and cocoa farmers dominates the cocoa sector, covering approximately 2,028,596 hectares or 94% of the total cocoa area in 2020. Notably, Indonesia's cocoa yields have been experiencing rapid growth at an annual rate of around 8.19% [2].
The demand for cocoa beans continues to rise, particularly in Western European countries and America, where chocolate is extensively used as a main ingredient in food production. To seize this opportunity and boost foreign exchange earnings, Indonesia, as a major cocoa producer, must focus on increasing its exports of cocoa beans [3]. This approach will allow the country to capitalize on the growing demand and strengthen its position in the global cocoa trade.
By leveraging its status as the world's largest cocoa producer and strategically enhancing its cocoa bean exports, Indonesia has the potential to significantly increase its foreign exchange earnings and further establish itself as a key player in the global cocoa industry.
Indonesian cocoa has received less attention at the world trade level, basically due to various factors, for example: improper post-harvest causing an inappropriate fermentation process, inadequate drying process, lack of uniformity or inconsistent in grain size and seed fragility. Foresterotype Indonesian cocoa (lindak) is widely planted in smallholder plantations. The cocoa pod consists of four components: skin, placenta, pulp, and seed. Quality standards are used as monitoring standards for cocoa [4, 5]. One of them is the moisture content of the cocoa beans formed during drying and storage. Cocoa processing business requires cocoa beans with a percentage of 6-7% moisture content; if the moisture content is below 5%, the seeds are very brittle and break easily during transportation if the moisture content is above 8% [6].
In general, several methods are widely used to determine the quality of cocoa beans and other agricultural products. Whereas, most of these methods rely on liquid and solvent extraction followed by other laboratory procedures. These methods sometimes take quite a long time so they are not suitable for application in the cocoa industry and distribution. These techniques can be very time consuming, making them unsuitable for use in cocoa production and distribution [7, 8].
Therefore, a fast, reliable, and non-destructive method is needed to analyze the quality of raw materials for agricultural products [9, 10]. The cocoa industry needs to be equipped with an appropriate and ideal fast method that can monitor cocoa processing and post-harvest steps in real-time, thereby facilitating the process of making urgent and important decisions. In recent years, near infrared spectroscopy (NIRS) has emerged as one of the most promising methods applied in many fields including agriculture [11, 12]. Compared to standard laboratory analysis, the advantages of NIRS are that it does not require chemicals, fast, non-destructive and environmental friendly [13]. In addition, NIRS can predict multiple parameters simultaneously.
The main objective of this presented study is to develop a near infrared spectroscopy (NIRS) as a fast, reliable, and non-destructive method for analyzing the quality of cocoa beans in Indonesia's cocoa industry. This method aims to provide real-time monitoring of cocoa processing and post-harvest steps, enabling timely and informed decision-making. By implementing NIRS technology, the study aims to enhance the competitiveness of Indonesian cocoa in the global market, improve overall quality standards, and maximize foreign exchange earnings through increased cocoa bean exports.
2.1 Cocoa bean samples
The cocoa sample used in the study consists of 50 grams of the Lindak variety, harvested during the most recent cultivation period in September-October 2022 at Pidie Jaya chocolate plantation. Prior to transportation to the laboratory, the materials underwent a thorough drying and sorting process. Subsequently, they were securely sealed in plastic and stored at a temperature below 20℃ in a refrigerator at the Instrumentation Laboratory, Universitas Syiah Kuala. This preparation is for the subsequent steps of spectrum acquisition and the measurement of both moisture and fat content.
2.2 NIR spectra acquisition of cocoa beans
Near infrared spectral data of all intact cocoa bean samples were acquired using a bench top portable sensing device NIRS instrument (PSD NIRS i16 USK) with an interval of 0.02 nm in a wavelength range from 1000 to 2500 nm [14, 15]. To achieve the maximum spectrum data, the optical attenuation was amplified 4 times and the number of scans is set to 64 scanning. Standard laboratory techniques were used to measure the moisture and fat content by means of Thermo-gravimetry and Soxhlet methods [3].
2.3 Moisture content measurement
Measurement of moisture content using the indirect method with the Grainer Moisture Tester/PM-300 tool, namely weighing 100 grams of cocoa beans as recommended and then putting them into the Grainer Moisture Tester tool.
2.4 Fat content measurement
Actual fat content of cocoa bean samples was measured and determnined sing the Soxhlet method. The volumetric flask was first dried in an oven for 1 hour at 105℃ as part of the measuring procedure. After that it was cooled in a desiccator. Then it is weighed, and the results are recorded. 10 g of sample is implanted in an extraction thimble or sleeve, which is then coated with cotton and placed in a soxhlet apparatus. The extraction procedure was started immediately after adding 100-150 ml of n-hexane to the volumetric flask [2, 16].
N-hexane were cleared after 6 hours of extraction at 95℃. A rotating rotary evaporator was also used to evaporate the n-hexane until only the liquid fat remained. After 30 minutes drying at 105℃ in the oven, the volumetric flask filled with fat was then cooled in a desiccator. The volumetric flask was weighed again and the results were recorded after cooling. The equation used to calculate total fat content (KL):
Fat content $(\%)=\frac{\mathrm{W} 3-\mathrm{W} 2}{\mathrm{~W} 1} \times 100 \%$
where,
$\mathrm{W}_1=$ Sample weight (g)
$\mathrm{W}_2=$ Weight of empty measuring flask (g)
$\mathrm{W}_3=$ Weight of measuring flask + extracted fat $(\mathrm{g})$
2.5 Spectral data correction
Before developing a predictive model, it is important to pre-process and correct the data spectrum to achieve more precise and accurate prediction results. This correction is carried out to minimize the effect of interference due to renewal of light from the material and the surrounding environment. The infrared spectrum were corrected using two spectral correction methods, namely the standard normal variete (SNV) and De-trending order 2 (Dt-2) spectrum smoothing methods.
2.6 Prediction of cocoa bean quality parameters
Near infrared technology has been applied to swiftly assess the quality of cocoa beans, focusing on two key parameters: moisture content and fat content. These assessments are compared with results obtained from conventional laboratory methods. Data have been collected to predict the quality of cocoa beans by constructing a regression model that correlates the Near-Infrared (NIR) Spectrum data (data X) with the parameters of moisture and fat content (data Y1 and Y2, respectively). This regression model was constructed using two methods: Partial Least Squares Regression (PLSR) and Principal Component Regression (PCR).
2.7 Validation and evaluation of predictive models
The predicted cocoa bean quality parameters from the NIRS technology rapid test and the actual measurement results of the chemical method was compared in validation process by means of k-fold cross validation. Model performance evaluation is carried out by looking at statistical parameters, namely: the coefficient of determination (R2) and the correlation coefficient (r) between the predicted results and the measurement results. ideally, a feasible prediction should have a high correlation coefficient value above 0.8. Also, other statistical parameters that will be looked at are the predicted standard error (RMSE) and latent variable (LV). The expected RMSE and LV values are small. Another limit is the record of model dependence, especially the proportion of forecast to deviation (RPD). A reliable model is a model with an RPD value above 2 [13, 17, 18].
3.1 Chemical analysis
Descriptive statistics of actual observed moisture and fat contents of intact cocoa beans is presented in Table 1.
Table 1. NIRS data recapitulation of moisture and fat content of cocoa beans
|
Parameter |
Minimum |
Maximum |
Average |
Standard Deviation |
|
|
Moisture content |
6.74 |
12.08 |
9.03 |
1.27 |
|
|
Fat level |
35.26 |
45.75 |
40.32 |
2.15 |
|
Standard deviation (SD) is used to indicate the variation of data in a study. The results of data recapitulation using the NIRS method show that the water content has the lowest standard deviation and the highest fat content. This shows that the distribution of fat content data is more optimal than the distribution of water content data.
3.2 Spectrum data analysis
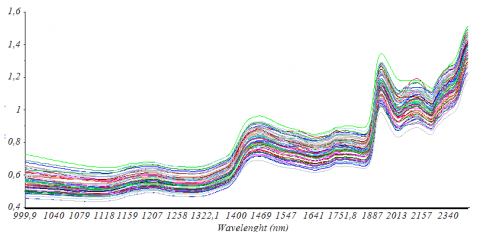
NIR spectral acquisition was conducted within the wavelength range of 1000 to 2500 nm at intervals of 0.02 nm. The selection of this range was strategic; wavelengths below 1000 nm are often prone to instability and damage, rendering them ineffective in providing the necessary information. The chemical composition of the cocoa beans influences the NIR spectra, resulting in distinctive peaks and troughs. Figure 1 depicts the initial spectrum of the cocoa beans, referred to as the raw spectrum.
Almost all cocoa samples exhibit similar spectral shapes but with varying levels of reflectance, as indicated by the raw (initial) Near-Infrared Spectroscopy (NIRS) reflectance spectrum. Each peak within the spectrum is characteristic and corresponds to the chemical constituents of the cocoa beans.
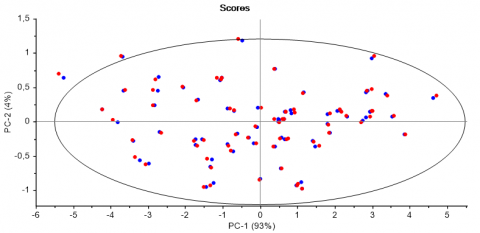
3.3 Outlier data analysis
Data that is different from other data is referred to as outlier data. To check the original spectrum data, a PCA-based spectrum data projection is used (Figure 2). The findings reveal that the original spectrum has very few outlier data (data outside the ellipse) after using the Hotteling T2 elliptical approach. This shows that elimination of outliers in the spectrum is not necessary. In addition, the spectrum projection using PCA shows how the PCA and NIRS approaches can distinguish various types of cocoa beans according to their species. Combined PCA and NIRS have the ability to characterize and categorize wine, fruit, cheese and other types of food charts [19, 20].
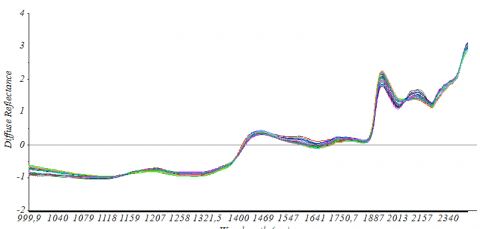
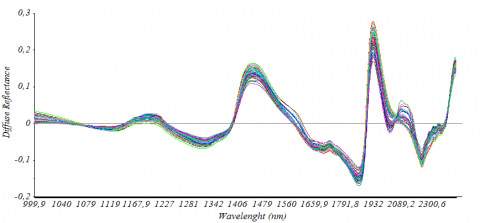
3.4 Spectrum pretreatment
Spectrum pretreatment is carried out to eliminate "noise" in the spectrum which is carried out at the beginning of data processing before carrying out further data processing. In the data analysis this time the researcher used the standard normal variete (SNV) and De-trending order 2 (Dt-2) methods. Figures 3 and 4 show that the spectrum has been corrected and improved by the SNV and DT methods.
Figure 1. Raw spectrum cocoa beans
Figure 2. Outliers data analysis results hotelling T2 ellipse PCA (raw data) sample
Figure 3. Spectrum of cocoa beans + SNV
Figure 4. Spectrum of cocoa beans + DT
The SNV method theoretically reduces the spectrum according to the average data distribution. To eliminate nonlinear trends in the data, use the De-trending (DT) approach. This pre-treatment, like the others, aims to smooth the spectrum by reducing the impact of noise wave interference. The DT method tends to erase nonlinear trends in spectroscopy data.
It is clear that the difference in the spectrum of the standard normal variete (SNV) in the wave range 1416-1625 nm is more sloping compared to De-trending order 2 (Dt-2). The wave range of 1884-2046 nm is seen at the peak DT which is much higher than that of the SNV method. The spectra of the two seem to overlap where [21] states that the finer, denser and neater the spectrum indicates that the prediction results are more accurate. The SNV method was developed to reduce the spread of light in the diffuse reflection and transmission spectrum so that the spectrum will be closer to the center or to the average value of the spectrum.
3.5 Moisture and fat contents prediction
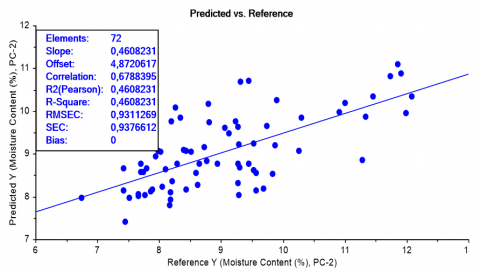
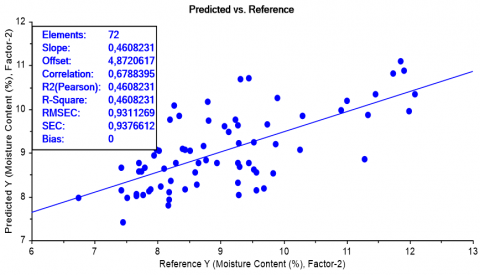
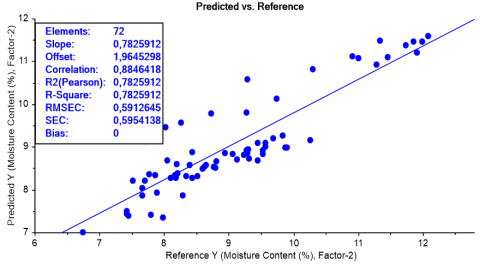
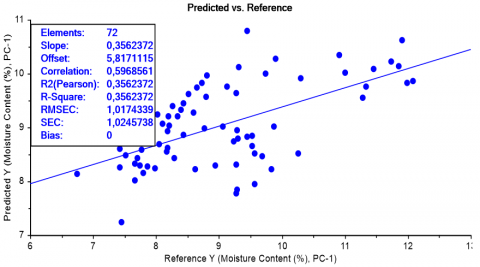
The moisture content of cocoa beans can be predicted by analyzing the values presented in Table 2. The latent variables selected are 2 and 1 because, within these variables, the correlation coefficient (r) values are nearly unity or reach a high figure. The highest correlation coefficient (r) was observed in the SNV+PCR and SNV+PLS methods, with a value of 0.88. It was followed by the RAW+PCR and RAW+PLS methods, which had a correlation coefficient (r) of 0.67. For the DT+PCR and DT+PLS methods utilizing Latent Variable 1, the correlation coefficient (r) was 0.59. The coefficient of determination (R2) was highest for SNV+PCR and SNV+PLS at 0.78, followed by RAW+PCR and RAW+PLS at 0.46, with DT+PCR and DT+PLS recording the lowest at 0.35. A coefficient of determination (R2) value that is close to 1 indicates a more reliable correlation in the model. This aligns with the assertion that a coefficient of determination (R2) value greater than 0.87 can be classified as providing a good interpretation.
Table 2. Results of calibration of moisture content of cocoa beans
|
Treatment |
Latent Variables |
r |
R2 |
RMSEC (%) |
RPD |
|
RAW+PCR |
2 |
0.67 |
0.46 |
0.93 |
1.37 |
|
RAW+PLS |
2 |
0.67 |
0.46 |
0.93 |
1.37 |
|
SNV+PCR |
2 |
0.88 |
0.78 |
0.59 |
2,16 |
|
SNV+PLS |
2 |
0.88 |
0.78 |
0.59 |
2,16 |
|
DT+PCR |
1 |
0.59 |
0.35 |
1.01 |
1.25 |
|
DT+PLS |
1 |
0.59 |
0.35 |
1.01 |
1.25 |
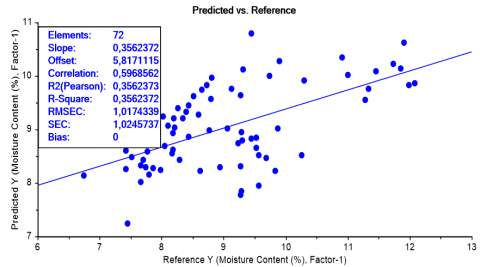
The root mean square error (RMSE) value represents the error in the predictive model; therefore, the more accurate the model, the lower the RMSE value will be. It is evident that the most favorable RMSE values were achieved with SNV+PCR and SNV+PLS, both yielding 0.59. This performance was followed by RAW+PCR and RAW+PLS, which registered RMSE values of 0.93, and finally DT+PCR and DT+PLS, with the highest RMSE values of 1.01. Both RMSE and R-squared values are heavily dependent on the validation method employed, and it is crucial to avoid using an excessive number of components within a model and to ensure the implementation of the appropriate modeling techniques. Figures 5-10 exhibit the calibration comparisons using the raw spectrum + PCR, raw spectrum + PLS, SNV + PCR, SNV + PLS, DT + PCR, and DT + PLS methods for predicting moisture content.
For the moisture content parameter, the lowest RPD was DT+PCR and DT+PLS, namely 1.25, followed by RAW+PCR, RAW+PLS with a value of 1.37 and the best RPD value was found in SNV+PCR and SNV+PLS, namely 2. 16. The RPD index with a value of 1.5 to 2.0 is roughly categorized as a good prediction model. RPD above 2 is classified as a relatively good performance on calibration. The accuracy of the calibration model is determined based on the value of R2 and RPD.
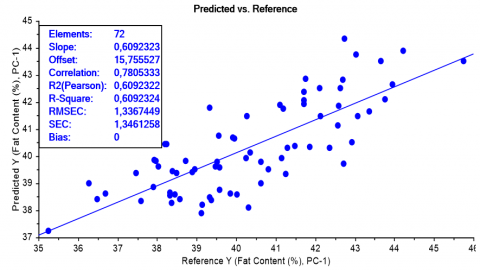
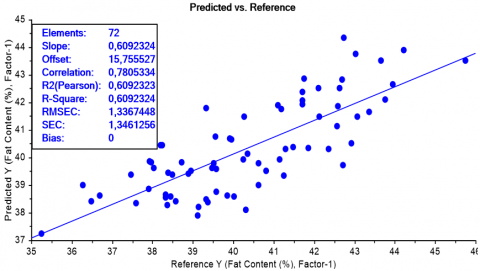
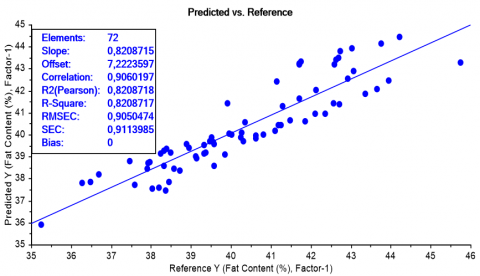
The fat content of cocoa beans can be predicted by looking at the values shown in Table 3. The latent variables used are 1 and 6 because in these latent variables the value of the correlation coefficient (r) is close to one or reaches a high value, where the correlation coefficient (r) is the highest was found in DT+PCR and DT+PLS which was 1 and followed by SNV+PCR and SNV+PLS with a correlation coefficient value (r) 0.90, while the lowest was found in RAW+PCR and RAW+PLS with a correlation coefficient value (r) 0.78.
Table 3. Calibration results of cocoa bean fat content
|
Treatment |
Latent Variables |
r |
R2 |
RMSEC (%) |
RPD |
|
RAW+PCR |
1 |
0.78 |
0.60 |
1.33 |
1.61 |
|
RAW+PLS |
1 |
0.78 |
0.60 |
1.33 |
1.61 |
|
SNV+PCR |
1 |
0.90 |
0.82 |
0.90 |
2.39 |
|
SNV+PLS |
1 |
0.90 |
0.82 |
0.90 |
2.39 |
|
DT+PCR |
6 |
1 |
1 |
1.55 |
1.38 |
|
DT+PLS |
6 |
1 |
1 |
1.55 |
1.38 |
Figure 5. Graph of comparison of predicted NIR moisturer content with chemical analysis results at the calibration stage (raw spectrum + PCR)
Figure 6. Graph of the comparison of predicted NIR moisturer content with chemical analysis results at the calibration stage (raw spectrum + PLS)
Figure 7. Graph of the comparison of predicted NIR moisturer content with chemical analysis results at the calibration stage (raw spectrum + SNV + PCR)
Figure 8. Graph of comparison of predicted NIR moisturer content with chemical analysis results at the calibration stage (raw spectrum + SNV + PLS)
Figure 9. Graph of comparison of predicted NIR moisturer content with chemical analysis results at the calibration stage (raw spectrum + DT + PCR)
Figure 10. Graph of the comparison of predicted NIR moisturer content with chemical analysis results at the calibration stage (raw spectrum + DT + PLS)
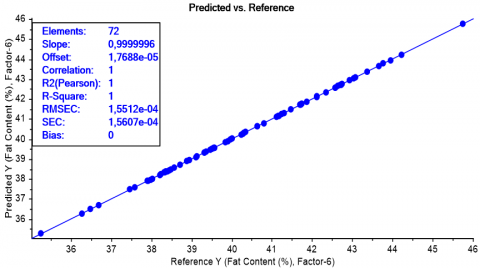
Figure 11. Graph of comparison of fat content predicted by NIR with fat content as a result of chemical analysis at the calibration stage (raw spectrum + PCR)
Figure 12. Graph of comparison of fat content predicted by NIR with fat content as a result of chemical analysis at the calibration stage (raw spectrum + PLS)
Figure 13. Graph of comparison of fat content predicted by NIR with fat content as a result of chemical analysis at the calibration stage (raw spectrum + SNV + PLS)
Figure 14. Graph of comparison of fat content predicted by NIR with fat content as a result of chemical analysis at the calibration stage (raw spectrum + DT + PCR)
Figure 15. Graph of comparison of fat content predicted by NIR with fat content as a result of chemical analysis at the calibration stage (raw spectrum + DT + PLS)
The coefficient of determination (R2) was found to be the highest, namely DT+PCR and DT+PLS, followed by SNV+PCR and SNV+PLS, namely 0.82 and the smallest was found in RAW+PCR and RAW+PLS , namely 0.78. Predictive performance can be assessed through the following statistical parameters: Coefficient of determination (R2), correlation coefficient (r), prediction error (defined as root mean square error - RMSE), and RPD. Figures 11-15 are the results of calibration comparisons using the raw spectrum + PCR, raw spectrum + PLS, SNV + PCR, SNV + PLS, DT + PCR and DT + PLS methods for fat content prediction.
It can be seen that the best RMSE were SNV+PCR and SNV+PLS which were 0.90 followed by RAW+PCR and RAW+PLS which were 1.33 and finally DT+PCR and DT+PLS which were 1.55. In the water content parameter, the lowest RPD was DT+PCR and DT+PLS, namely 1.38 followed by RAW+PCR, RAW+PLS with a value of 1.61 and the best RPD value was found in SNV+PCR and SNV+PLS, namely 2.39. It is clear that a good and superior predictive performance must have an RPD of more than 2 and a lower RSME value. The expected standard error is close to zero but because the near infrared (NIR) method is faster and non-destructive in analysis, an error of 0.1 in the analysis can be tolerated in line with research that if the error value is found to be less than the standard deviation then the actual data is good. Residual Predictive Deviation (RPD) between 1.5 and 1.9 is a rough estimate and still needs calibration improvement. Adequate predictive models have an RPD between 2 and 2.5. An RPD value of 2.5 to 3 or greater indicates good to very strong predictive model accuracy [13, 18, 22-24].
The Near-Infrared Spectroscopy (NIRS) method proves to be precise in predicting the moisture and fat content in cocoa beans, offering a non-destructive and simultaneous estimation without the need for chemical reagents. In this study, the SNV+PCR and SNV+PLS models emerged as the best methods, demonstrating commendable performance in forecasting the chemical composition of cocoa beans. These models achieved an RPD (Ratio of Performance to Deviation) value of 2.16 for moisture content and 2.39 for fat content, highlighting their efficacy in the analytical process. However, it is important to acknowledge the limitations of this study. The findings are specific to cocoa beans and may not be directly applicable to other agricultural products.
Additionally, the sample size used may have impacted the representativeness of the results. Moreover, the use of calibration models, like SNV+PCR and SNV+PLS, introduces the possibility of bias or inaccuracies if not properly calibrated or validated. Moving forward, future work should focus on validating the findings through independent datasets and optimizing the calibration models.
Exploring the application of NIRS in predicting other chemical composition parameters of cocoa beans or different agricultural products would be a valuable direction for research. Comparative studies against alternative prediction methods can provide a more comprehensive understanding of NIRS' effectiveness. Furthermore, assessing the real-world feasibility and cost-effectiveness of implementing NIRS for quality assessment and grading of cocoa beans is worth exploring.
We sincere acknowledge to the directorate of Research and Community Service LPPM Universitas Syiah Kuala for funding this study through PP scheme 2023.
[1] Drees, A., Brockelt, J., Cvancar, L., Fischer, M. (2023). Rapid determination of the shell content in cocoa products using FT-NIR spectroscopy and chemometrics. Talanta, 256: 124310. https://doi.org/10.1016/j.talanta.2023.124310
[2] Zulfahrizal, Z., Munawar, A.A. (2021). Near-infrared technology in agriculture: Non-destructive determination of inner quality parameters in intact cocoa beans. Trends in Sciences, 18(20): 31-31. https://doi.org/10.48048/tis.2021.31
[3] Hayati, R., Zulfahrizal, Z., Munawar, A.A. (2021). Robust prediction performance of inner quality attributes in intact cocoa beans using near infrared spectroscopy and multivariate analysis. Heliyon, 7(2): e06286. https://doi.org/10.1016/j.heliyon.2021.e06286
[4] Teye, E., Anyidoho, E., Agbemafle, R., Sam-Amoah, L.K., Elliott, C. (2020). Cocoa bean and cocoa bean products quality evaluation by NIR spectroscopy and chemometrics: A review. Infrared Physics & Technology, 104: 103127. https://doi.org/10.1016/j.infrared.2019.103127
[5] Hernández-Hernández, C., Fernández-Cabanás, V.M., Rodríguez-Gutiérrez, G., Bermúdez-Oria, A., Morales-Sillero, A. (2021). Viability of near infrared spectroscopy for a rapid analysis of the bioactive compounds in intact cocoa bean husk. Food Control, 120: 107526. https://doi.org/10.1016/j.foodcont.2020.107526
[6] Teye, E., Huang, X., Dai, H., Chen, Q. (2013). Rapid differentiation of Ghana cocoa beans by FT-NIR spectroscopy coupled with multivariate classification. Spectrochimica Acta Part A: Molecular and Biomolecular Spectroscopy, 114: 183-189. https://doi.org/10.1016/j.saa.2013.05.063
[7] Teye, E., Huang, X.Y., Lei, W., Dai, H. (2014). Feasibility study on the use of Fourier transform near-infrared spectroscopy together with chemometrics to discriminate and quantify adulteration in cocoa beans. Food Research International, 55: 288-293. https://doi.org/10.1016/j.foodres.2013.11.021
[8] Álvarez, C., Pérez, E., Cros, E., Lares, M., Assemat, S., Boulanger, R., Davrieux, F. (2012). The use of near infrared spectroscopy to determine the fat, caffeine, theobromine and (−)-epicatechin contents in unfermented and sun-dried beans of Criollo cocoa. Journal of Near Infrared Spectroscopy, 20(2): 307-315. https://doi.org/10.1255/jnirs.990
[9] Hayati, R., Munawar, A.A., Marliah, A. (2021). Rapid quantification of rice (Oryza sativa) qualities based on adaptive near infrared spectroscopy. IOP Conference Series: Earth and Environmental Science, 922(1): 012020. https://doi.org/10.1088/1755-1315/922/1/012020
[10] Munawar, A.A., von Hörsten, D., Wegener, J.K., Pawelzik, E., Mörlein, D. (2016). Rapid and non-destructive prediction of mango quality attributes using Fourier transform near infrared spectroscopy and chemometrics. Engineering in Agriculture, Environment and Food, 9(3): 208-215. https://doi.org/10.1016/j.eaef.2015.12.004
[11] Munawar, A.A., Satriyo, P., Bahari, S.A. (2022). Near infrared spectroscopy: Rapid and simultaneous approach to predict the fixed carbon, volatile matter and ash contents in biochar produced from agricultural residues. Acta Technologica Agriculturae, 25(1): 1-6. https://doi.org/10.2478/ata-2022-0001
[12] Munawar, A.A., Meilina, H., Pawelzik, E. (2022). Near infrared spectroscopy as a fast and non-destructive technique for total acidity prediction of intact mango: Comparison among regression approaches. Computers and Electronics in Agriculture, 193: 106657. https://doi.org/10.1016/j.compag.2021.106657
[13] Pasquini, C. (2018). Near infrared spectroscopy: A mature analytical technique with new perspectives–A review. Analytica Chimica Acta, 1026: 8-36. https://doi.org/10.1016/j.aca.2018.04.004
[14] Munawar, A.A., Hizir, H., Muhammad, S., Yusmanizar, Y. (2023). Rapid detection of patchouli oil adulteration using support vector machine classification and discriminant analysis with near-infrared spectroscopy. Mathematical Modelling of Engineering Problems, 10(3): 1074-1080. https://doi.org/10.18280/mmep.100343
[15] Munawar, A.A., Hörsten, D.V., Mörlein, D., Pawelzik, E., Wegener, J.K. (2013). Rapid and non-destructive prediction of mango sweetness and acidity using near infrared spectroscopy. Massendatenmanagement in der Agrar-und Ernährungswirtschaft–Erhebung–Verarbeitung–Nutzung.
[16] Satriyo, P., Munawar, A.A. (2020). Data analysis on near infrared spectroscopy as a part of technology adoption for cocoa farmer in Aceh Province, Indonesia. Data in Brief, 29: 105251. https://doi.org/10.1016/j.dib.2020.105251
[17] Cen, H., He, Y. (2007). Theory and application of near infrared reflectance spectroscopy in determination of food quality. Trends in Food Science & Technology, 18(2): 72-83. https://doi.org/10.1016/j.tifs.2006.09.003
[18] Arendse, E., Fawole, O.A., Magwaza, L.S., Opara, U.L. (2018). Non-destructive prediction of internal and external quality attributes of fruit with thick rind: A review. Journal of Food Engineering, 217: 11-23. https://doi.org/10.1016/j.jfoodeng.2017.08.009
[19] Wajizah, S., Munawar, A.A. (2020). Near infrared spectroscopy (NIRS) data analysis for a rapid and simultaneous prediction of feed nutritive parameters. Data in Brief, 29: 105211. https://doi.org/10.1016/j.dib.2020.105211
[20] Munawar, A.A., Syah, H. (2019). Fast and robust quality assessment of honeys using near infrared spectroscopy. IOP Conference Series: Earth and Environmental Science, 365(1): 012053. https://doi.org/10.1088/1755-1315/365/1/012053
[21] Deng, Y., Wang, Y., Zhong, G., Yu, X. (2018). Simultaneous quantitative analysis of protein, carbohydrate and fat in nutritionally complete formulas of medical foods by near-infrared spectroscopy. Infrared Physics & Technology, 93: 124-129. https://doi.org/10.1016/j.infrared.2018.07.027
[22] Nordey, T., Joas, J., Davrieux, F., Chillet, M., Léchaudel, M. (2017). Robust NIRS models for non-destructive prediction of mango internal quality. Scientia Horticulturae, 216: 51-57. https://doi.org/10.1016/j.scienta.2016.12.023
[23] Munawar, A.A., Devianti, D., Satriyo, P., Yunus, Y. (2019). Rapid and simultaneous prediction of soil quality attributes using near infrared technology. International Journal of Scientific & Technology Research, 8(9): 725-728.
[24] Agustina, R., Munawar, A.A. (2019). Electro-optic properties of dried Pliek U powder: local ingredients from Aceh. IOP Conference Series: Earth and Environmental Science, 365(1): 012042. https://doi.org/10.1088/1755-1315/365/1/012042