Ahmed S. Al-Fahal*![]() | Ahmed S. Ahmed
| Ahmed S. Ahmed![]() | Akram K. Mohammed
| Akram K. Mohammed![]() | Wesam S. Mohammed-Ali
| Wesam S. Mohammed-Ali![]()
© 2024 The authors. This article is published by IIETA and is licensed under the CC BY 4.0 license (http://creativecommons.org/licenses/by/4.0/).
OPEN ACCESS
Rainwater harvesting is one of the solutions to avoid water loss in the future because it provides sufficient supply and is more economical when compared to other conventional types. The shortage of water supply become a concern due to the growing population as well as the environmental pollution. Rainwater harvesting is seen as the most accessible and easy-to-use resource for drinking and other domestic uses. The current study consists of two main parts; the first part is a hydrological study that includes studying the possibility of benefiting from the amount of rainfall and developing future plans to benefit from this collected water and how to manage it through the implementation of water harvesting technology by collecting rainwater from the roofs to provide part of the population's water needs instead of its wastage and loss. The second part is an environmental study that includes a study of evaluating the quality of water collected through the harvesting of rainwater technology and comparing it with World Health Organization (WHO) specifications for water-drinking purposes. Rainwater samples were analyzed in the environmental laboratory to compare with (WHO) World Health Organization specifications. Samples were obtained at, (28.3, 84.9, and 33.96) liters, respectively, where the average is (49.05) liters. The depths of rain were recorded in the measuring cylinder (5, 14.6, and 9) mm, respectively, where the average is (9.53) mm; the measurement is a negative indicator compared to the expected (26.15) mm. The variables identified (total hardness, calcium, nitrates, sulfates, chlorides, and dissolved substances). Furthermore, 33.33, 0.80, 35.67, 8.83, and 95.0) mg/L, respectively, while the pH (7.97) and conductivity (µs/cm 170.13) were within the specification and the Temperature (23.60℃) and turbidity 10.47 NTU)) It was not in conformity with the specification, as the specification refers to placing in heat (20℃) and turbidity (5 NTU). The current study discloses that the overall quality of water is quite satisfactory as per WHO specifications. The harvesting of rainwater system offers an adequate amount of water and energy savings through lower consumption. Furthermore, considering the cost of fixing and maintenance expenditures, the system is effective and economical. This current study provides the environmental benefits of rainwater harvesting and identifies its probable boundaries and its role in developing a more sustainable water resource management under climate change. This study contributes to improving adaptability strategies of rainwater harvesting for sustainable water resources management under changing climate.
rainwater harvesting, roof rainwater, storage tank, water quality, water resources, water reuse
Rainwater harvesting is a multipurpose way of providing drinkable during a drought period, recharging the groundwater and finally reducing the runoff and water logging during the season of heavy rainfall [1]. Rooftop rainwater harvesting (RTRWH) is the most common method of harvesting rainwater (RWH) for domestic consumption. Water is covered on the roofs of buildings that are used for its consumption, as it is used to recharge groundwater, or the tank saves water when it is consumed. It rains in the evening. Affected by rainwater, animals or birds, insects, dirt, and organic matter. Therefore, it is important to carry out regular maintenance (cleaning, repairs, etc.), as well as treatment of the water used (such as filtration and/or disinfection). Rainwater harvesting systems gradually become an integral part of the toolkit for sustainable rainwater management. However, there is a need to design more carefully the environmental and life cycle impacts of these systems [2].
The quality of rainwater often exceeds surface water and may be comparable to groundwater because it does not pass through soil and rocks and is not in contact with them, where it can dissolve salts and minerals that are in the atmosphere, which harms potable uses [3]. On the other hand, rainwater is valued for its purity and softness. The quality of rainwater is usually affected by geographical location, human activity in the area, and the storage tank. However, with minimal treatment and adequate care of the water harvesting system, rainwater can be used as potable water as well as for irrigation [4, 5].
A large percentage of the world's population does not have access to safe sources of water. WHO/UNICEF reports that 1.1 billion people do not have access to "safe drinking water sources" (WHO/UNICEF 2000). Although great efforts are being made to deliver safe piped water to the world's population, the reality is that water supplies that provide safe drinking water will not be available to all people in the near future [6]. The World Health Organization's Millennium Declaration set a goal of halving the proportion of the world's population without access to safe drinking water by the year 2015. It is clear that all possible methods must be tried to reduce the drinking water problem and help families obtain drinking water more safely [7].
The quality of any water is determined by identifying the quality of the source water, the extent of its exposure to pollutants during its collection and treatment, and the method of storing it until it reaches the consumer. The rooftop rainwater collection system consists of a collection system (Roof), a transportation system (pipes), and a storage system (tank). Water pollution may occur at any of these stages. Rainwater is generally uncontaminated or at least of fairly good purity. However, it may be acidic and contain traces of lead, pesticides, and some pollutants, depending on the area and prevailing winds [8, 9].
The first flow phenomenon is known to be distinctive because its concentrations are very high at the beginning of the rainfall in the first minutes and later decrease towards a constant value. In general, these dynamic effects are observed within the first 2 mm of runoff height. The first flow effect occurs as a result of one or a combination of the following three processes:
The quality of rainwater collected through first flow diversion can be significantly improved. However, most of the time, this interest is not considered due to a variety of reasons. Proper maintenance of the first flush alone can greatly improve the quality of the collected rainwater [10].
Contrary to popular belief that rainwater collected from rooftops is as clean as pure water, there are a number of pollutants in such water - and many previous studies have confirmed this. Recognizing this fact, it has become possible to control the quality of water and reach acceptable levels using simple and inexpensive devices [11, 12].
Current research addresses these issues in addition to reviewing the quality of harvested rainwater due to its exposure to pollutants. In this background, the study also shows water quality management strategies in the post-harvest stages.
2.1 Area of the study
The current study was conducted in Erbil city north of Iraq. The house roof area is a hundred square meters (with dimensions of 5 × 20 meters), as shown in Figure 1. The rain period is usually between October to May, and the average annual rainfall is between 45.8 mm and 0.4 mm (2020), with an average of between 180-210 days annually. The study area was selected due to the lack of a river in the city, which is the main source of water for domestic use from wells. Unfortunately, most wells dry out in the dry season when the rain stops. The people depend heavily on available rainwater because it is believed to be economical, affordable, and drinkable during the rainy season.
For each rainfall intensity and each other, the height of the water in the collection tank is measured to determine the volume of water collected from the rainfall intensity.
Figure 1. Iraq map and roof plan of the house
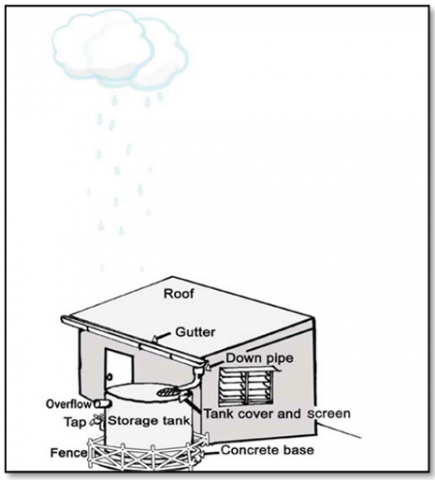
The system consists of the following items, as shown in Figure 2.
As for measuring the intensity of rain, a measuring cylinder with a 10 cm diameter was placed above the Roof of the house, and between one rain and another, the height of the water in the measuring cylinder was taken to calculate and estimate the type of rain intensity.
Figure 2. Harvesting of rainwater system
2.2 Method of sampling and collecting
2.2.1 Harvesting of rainwater
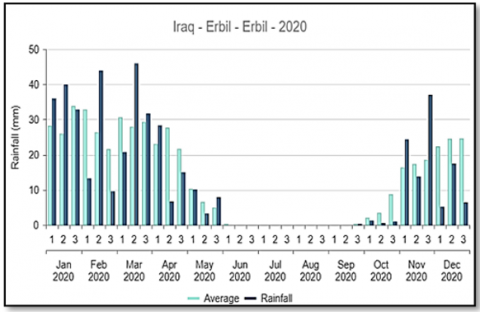
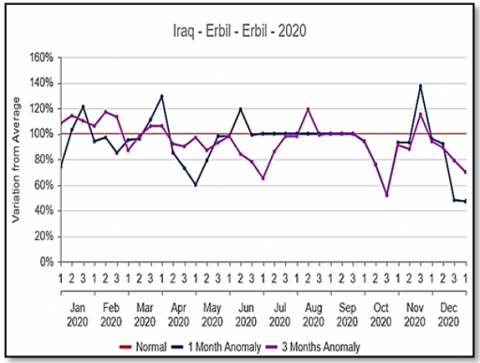
The samples of rainwater were collected from the selected house roof. In the year 2020, during January-April, the rainwater was collected from the study area. The tank was washed with clean water and drained before using to gather the rainwater samples from the system. The tank with a pipe rainwater was connected to the derange of the house (system), and then collected the water from the rainwater; after the process of water collecting, water quality was tested. The Temperature and pH of the rainwater sample were measured immediately after gathering. The samples were kept in a sterilized capped bottle and then taken to the laboratory for microbial and chemical analysis. Mean annual rainfall was around 26.15 (mm/month) in 2020, as shown in Figures 3 and 4. The figures show the amounts of rainfall this year (dark blue) and the average amounts for the previous years (20 years, 1994-2013) in light blue. The figures show rainfall in the region and its distribution over the months, especially for periods when rainfall is consistently above or below average, during the early stages of the season, and during times of need [13].
Figure 3. Rainfall hytograph for the study area
Figure 4. Rainfall anomaly variation
2.2.2 Water quality testing
Water quality exams must be regularly carrying out by a relevant in-country agency, such as the Ministry of Health. The parameters, total hardness, calcium, nitrates, sulfates, chlorides, and dissolved substances pH, Temperature, Electrical Conductivity, and turbidity must be examined and compared to WHO specifications. According to the World Health Organization (WHO), water use purposes of drinking have an important impact on health. Therefore, preserving the quality of water is very important. World health organization and other national and international organizations have put specifications of water quality to be used as references for preserving water quality [14]. Table 1 shows the parameters from World Health Organization Specifications:
Table 1. World Health Organization specifications [7]
|
# |
Parameters |
Specific |
|
1 |
Total Hardness (TH) mg/l |
300 |
|
2 |
Calcium mg/l |
75 |
|
3 |
Nitrate mg/l |
10 |
|
4 |
Sulfate mg/l |
400 |
|
5 |
Chloride mg/l |
250 |
|
6 |
Total Dissolved Solids (TDS) mg/l |
500 |
|
7 |
pH |
6.5 – 8.5 |
|
8 |
Temperature ℃ |
20 |
|
9 |
Electrical Conductivity Ec µs/cm |
1000 |
|
10 |
Turbidity NTU |
5 |
3.1 Harvesting of rainwater
For the harvesting of rainwater, the results as shown in Table 2:
Table 2. Water harvesting variables
|
# |
Parameters |
S1* |
S2 |
S3 |
Average |
|
1 |
Volume of rainwater (L) |
28.3 |
84.9 |
33.96 |
49.05 |
|
2 |
The depth of water in cylindrical measurement (mm) |
5 |
14.6 |
9 |
9.53 |
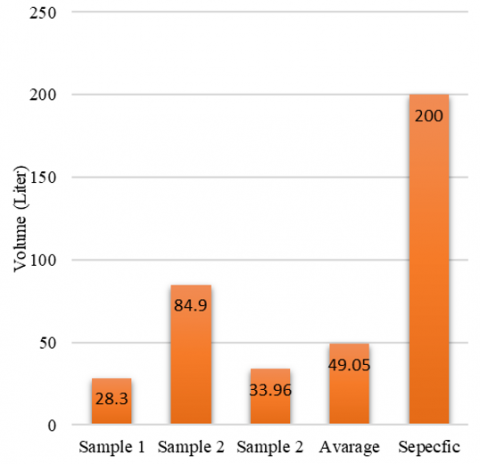
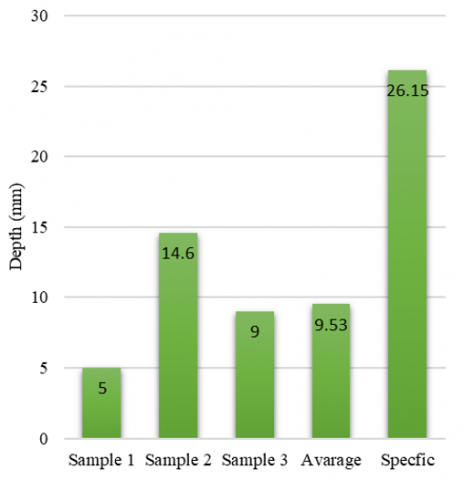
The volume of water harvested in the second sample was (84.9) liters, which is greater than the first and third samples, which were (28.3 and 33.96) liters, respectively, with an average of (49.05) liters less than the expected (200) liters due to the dry season and lack of rain, as shown in Figure 5. As for measuring the height of rainwater with the measuring cylinder, where the reading was 14.6 mm, compared to the first and third samples, it was (5 and 9) mm, respectively. As for the rate of measuring the height of rainwater with the measuring cylinder is (9.53) mm, it is also considered a negative indicator because it is much less than the expected 26.8 mm, as shown in Figure 6.
Figure 5. The volume of rainwater
Figure 6. The depth of water in cylindrical measurement
3.2 Water quality analysis
For the water quality, samples of three different rainfall intensities were examined in the laboratory, as shown in Table 3, and compared with the determinants of the water quality indicator according to the quality of the variable.
Table 3. The sample of parameters
|
# |
Parameters |
S1 |
S2 |
S3 |
Av. |
WHO |
|
1 |
Total hardness mg/l |
206 |
79.2 |
79.2 |
121.47 |
300 |
|
2 |
Calcium mg/l |
64 |
20 |
16 |
33.33 |
75 |
|
3 |
Nitrate mg/l |
0.7 |
0.9 |
0.8 |
0.80 |
10 |
|
4 |
Sulfate mg/l |
45 |
29 |
33 |
35.67 |
400 |
|
5 |
Chloride mg/l |
8.5 |
8.5 |
9.5 |
8.83 |
250 |
|
6 |
Total dissolved solids (TDS) mg/l |
199 |
37 |
49 |
95.0 |
500 |
|
7 |
pH |
8.6 |
7.8 |
7.5 |
7.97 |
6.5 – 8.5 |
|
8 |
Temperature ℃ |
23.6 |
23.6 |
23.6 |
23.60 |
20 |
|
9 |
Electrical Conductivity Ec µs/cm |
333.5 |
77 |
99.9 |
170.13 |
1000 |
|
10 |
Turbidity NTU |
27.5 |
3.4 |
0.5 |
10.47 |
5 |
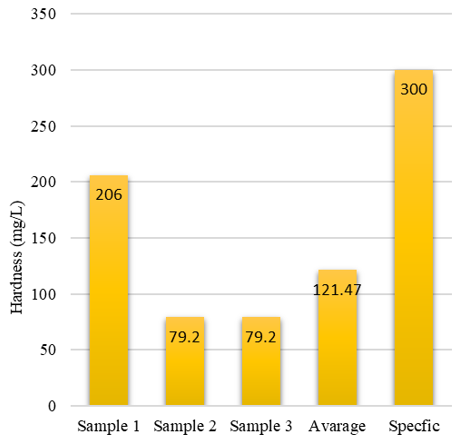
Figure 7 shows the relationship between the samples of total hardness (206, 79.2 and 79.2) mg/l and its average (121.47) mg/l compared with WHO-specific (300) mg/l.
Figure 7. The total hardness for samples
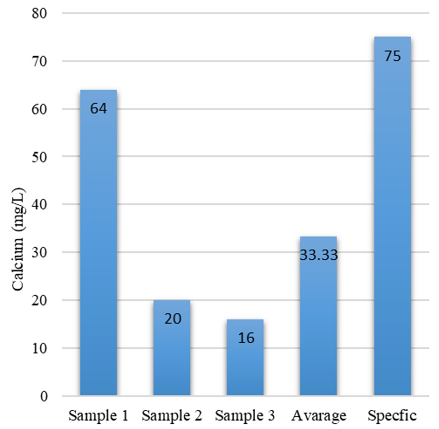
Figure 8 shows the relationship between the samples of calcium (64, 20 and 16) mg/l and its average (33.33) mg/l compared with WHO-specific (75) mg/l.
Figure 8. The Calcium value for samples
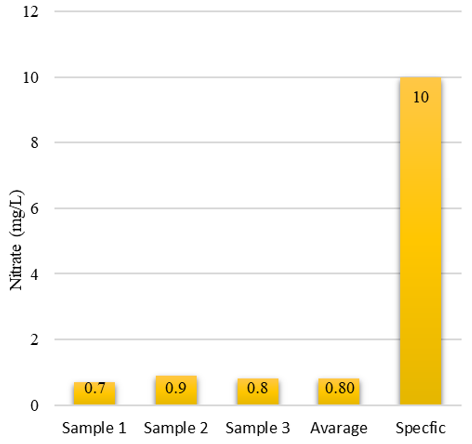
Figure 9 shows the relationship between the samples of Nitrate (0.7, 0.9 and 0.8) mg/l and its average (0.8) mg/l compared with WHO-specific (10) mg/l.
Figure 9. The Nitrate for samples
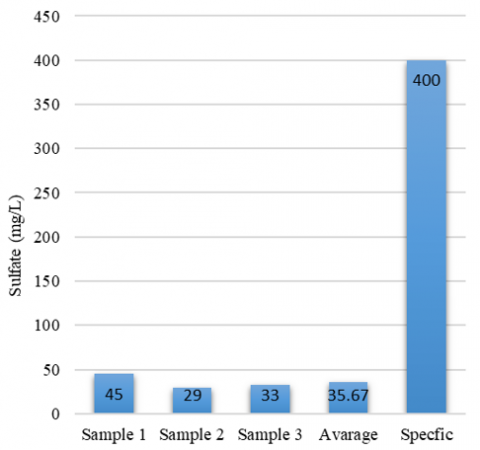
Figure 10 shows the relationship between the samples of Sulfate (45, 29 and 33) mg/l and its average (35.67) mg/l compared with WHO-specific (400) mg/l.
Figure 10. The Sulfate value for samples
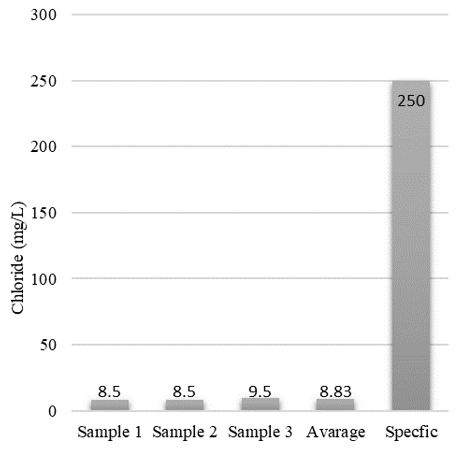
Figure 11. The Chloride for samples
Figure 11 shows the relationship between the samples of Chloride (8.5, 8.5 and 9.5) mg/l and its average (8.83) mg/l compared with WHO-specific (250) mg/l.
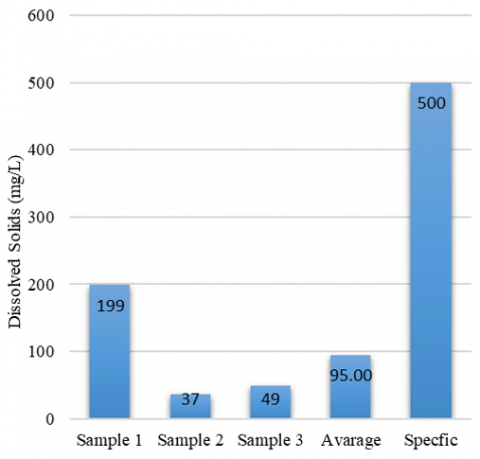
Figure 12 shows the relationship between the samples of total dissolved solids (199, 37 and 49) mg/l and its average (95) mg/l compared with WHO-specific (500) mg/l.
Figure 12. Total dissolved solids
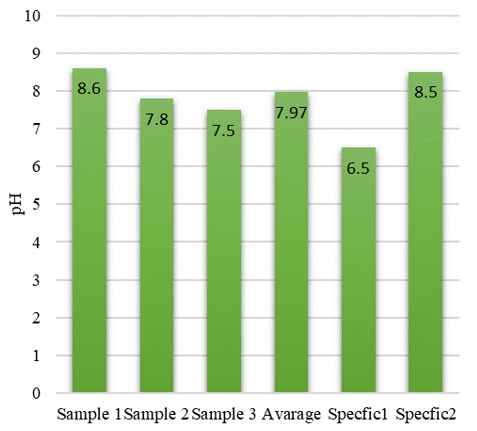
Figure 13. The pH value for the collected samples
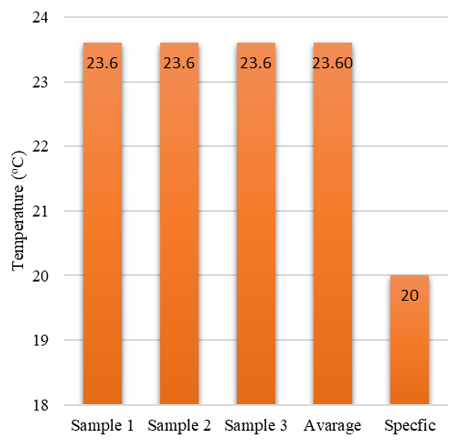
Figure 14. The temperature of the samples
Figure 13 shows the relationship between the samples of pH (8.6, 7.8, and 7.5) and its average (7.97) compared with the upper and lower WHO-specific (6.5-8.5).
Figure 14 shows the relationship between the sample's Temperature (23.6, 23.6, and 23.6)℃ and its average (23.6)℃ compared with WHO-specific (20)℃.
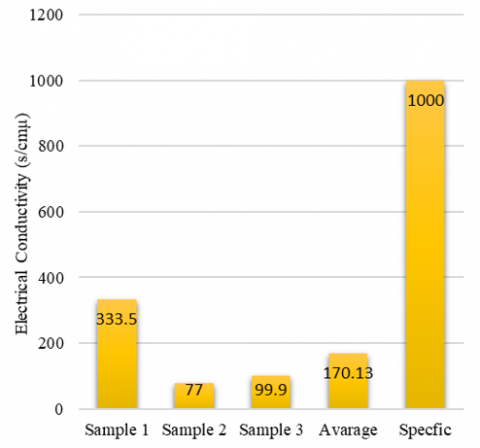
Figure 15 shows the relationship between the samples of electrical Conductivity (333.5, 77, and 99.9) s/cmµ and its average (170.13) µs/cm compared with WHO-specific (1000) µs/cm.
Figure 15. Electrical conductivity for the collected samples
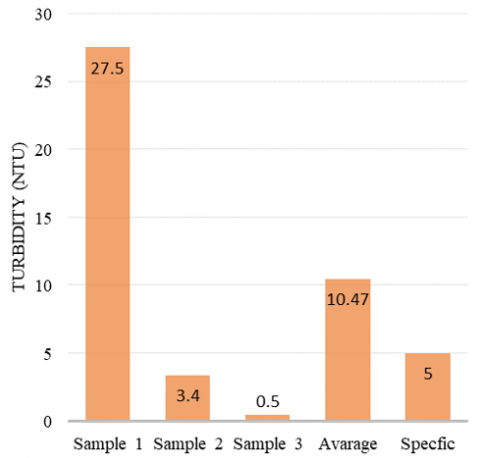
Figure 16 shows the relationship between the samples of turbidity (27.5, 3.4, and 0.5) NTU and its average (10.47) NTU compared with WHO-specific (5) NTU.
Figure 16. The turbidity of the collected samples
The parameters were identified as total hardness (121.47 mg/l), calcium (33.33 mg/l), nitrates (0.8 mg/l), sulfates (35.67), chlorides (8.83 mg/l), and total dissolved substances (95.0 mg/l), while the pH (7.97) and conductivity (µs/cm 170.13) were within the specification, and the Temperature (23.60℃) and turbidity 10.47 NTU It was not in conformity with the specification, as the specification refers to placing in heat (20℃) and turbidity (5 NTU).
It is possible to say that there is ample scope to study water harvesting from an economic perspective, especially in cities that depend on marketing water to users at high costs.
[1] Rahman, S., Khan, M.T.R., Akib, S., Bin Che Din, N., Biswas, S.K., Shirazi, S.M. (2014). Sustainability of rainwater harvesting system in terms of water quality. The Scientific World Journal, 2014: 721357. https://doi.org/10.1155/2014/721357
[2] Che-Ani, A.I., Shaari, N., Sairi, A. (2009). Rainwater harvesting as an alternative water supply in the future. European Journal of Scientific Research, 34(1): 132-140.
[3] Payus, C., Meng, K.J. (2015). Consumption of rainwater harvesting in terms of water quality. International Journal of GEOMATE, 9(2): 1515-1522. https://doi.org/10.21660/2015.18.95782
[4] Olaoye, R.A., Olaniyan, O.S. (2012). Quality of rainwater from different roof material. International Journal of Engineering and Technology, 2(8): 1413-1421.
[5] Khanoosh, A.A., Khaleel, E.H., Mohammed-Ali, W.S. (2023). The resilience of numerical applications to design drinking water networks. International Journal of Design & Nature and Ecodynamics, 18(5): 1069-1075. https://doi.org/10.18280/ijdne.180507
[6] Meera, V., Ahammed, M.M. (2006). Water quality of rooftop rainwater harvesting systems: A review. Journal of Water Supply: Research and Technology-Aqua, 55(4): 257-268. https://doi.org/10.2166/aqua.2006.0010
[7] Guidelines for drinking-water quality: First addendum to the fourth edition. (2017). Journal AWWA, 109(7): 44-51. https://doi.org/10.5942/jawwa.2017.109.0087
[8] Ganoulis, J. (2009). Risk Analysis of Water Pollution. John Wiley & Sons.
[9] Mohammed-Ali, W.S., Khairallah, R.S. (2022). Review for some applications of riverbanks flood models. IOP Conference Series: Earth and Environmental Science, 1120: 012039. https://doi.org/10.1088/1755-1315/1120/1/012039
[10] Gwenzi, W., Dunjana, N., Pisa, C., Tauro, T., Nyamadzawo, G. (2015). Water quality and public health risks associated with roof rainwater harvesting systems for potable supply: Review and perspectives. Sustainability of Water Quality and Ecology, 6: 107-118. https://doi.org/10.1016/j.swaqe.2015.01.006
[11] Tebbutt, T.H.Y. (1997). Principles of Water Quality Control. Elsevier.
[12] Mohamme-Ali, W.S., Khaleel, E.H. (2023). Assessing the feasibility of an explicit numerical model for simulating water surface profiles over weirs. Mathematical Modelling of Engineering Problems, 10(3): 1025-1030. https://doi.org/10.18280/mmep.100337
[13] Climate explorer. https://dataviz.vam.wfp.org/climate-explorer, accessed on Feb. 22, 2024.
[14] Yidana, S.M., Yidana, A. (2010). Assessing water quality using water quality index and multivariate analysis. Environmental Earth Sciences, 59: 1461-1473. https://doi.org/10.1007/s12665-009-0132-3