Alaa H. Shneishil*![]() | Maithem H. Rasheed
| Maithem H. Rasheed![]() | Jaber O. Dahloos
| Jaber O. Dahloos![]()
© 2023 IIETA. This article is published by IIETA and is licensed under the CC BY 4.0 license (http://creativecommons.org/licenses/by/4.0/).
OPEN ACCESS
The aim of this work is to aid researchers and engineers in installing PV systems. A performance analysis of a 1 MWp grid-connected solar PV power plant was modeled for the Baghdad/Iraq site (latitude 33°14′ north and longitude 44°25′ east). From January 2020 until December 2020, the installed system was simulated using MATLAB. The results show that the maximum value of monthly tilted solar irradiation is 225.23 kWh/m2 in August and the minimum value is 112.5 kWh/m2 in November. The effects of temperature lead to a loss in the efficiency of the solar cell, and an increase in the level of solar radiation does not necessarily result in an increase in the power generated by a solar panel. We observe that the amounts of power and energy produced in March are higher than those produced in summer; thus, the maximum value of power (about 0.91 MW) was produced in March at solar noon, whereas the minimum value was about 0.09 MW at solar noon in May. To maximize the effectiveness of solar panels, a cooling system must be used, which can increase power output and solar panel lifespan despite the high temperatures in Iraq, especially in the summer.
solar PV plant, grid connected PV system, capacity factor, performance ratio
Global economies rely heavily on energy. Access to an electricity supply system is still a major issue in many developing nations [1], but nearly 40% of a nation’s electrical energy is consumed by the residential building sector [2, 3]. The growing use of energy at various levels over the past few decades and emergence of novel technologies have led to considerable increase in energy consumption. Moreover, environmental problems have also increased [4]. The European Council released a framework for energy and climate change in 2014, aiming to share 27% of renewable energy consumption by 2030 [5]. Aimed at preventing the global mean temperature from reaching 2℃, a climate change conference was held in Paris in 2015, where more than 30 countries participated and considered the impact of climate in 2020 [6]. Renewable energy sources are great alternative energy sources that help solve the world’s energy crisis and address energy difficulties that conventional centralized power plants are unable to address [7]. Thus, the household sector should consider developing and shifting energy systems to other clean power sources, such as solar PV systems. Solar power is one of the greatest ways to deal with problems due to rising electricity consumption and environmental issues arising from the continued commercial maturation of solar PV systems [8]. Solar photovoltaic technology is becoming a promising choice for the generated electricity as a result the use of fossil fuels decreases on our globe. Solar energy is considered clean energy that reduces environmental pollution [9].
The commercial acceptability of solar PV technology as a source of renewable energy has already been attained, and its operation requires minimum manpower requirements [10]. Demand for solar PV systems has increased globally, and is they have considered the most cost-effective alternative sources of electricity in some countries. By 2050, solar PV systems are anticipated to surpass all other energy sources in terms of cost in areas with plentiful solar radiation [11]. In comparison to stand-alone systems, which rely on batteries, grid-connected PV systems worldwide account for about 99% of the installed capacity of solar energy [12].
Owing to the low maintenance requirements and ease of installation of grid-connected PV systems, many nations are encouraging consumers to install PV systems in an effort to support conventional energy sources, boost the share of renewable energy, and ultimately reduce carbon dioxide (CO2) emissions [13]. The cost of solar PV system installation is expected to drop dramatically globally in the near future. In contrast to the average cost of 1110 USD/kW in 2018, the average cost of PV system installation is expected to be 589 USD/kW by 2030 and 320 USD/kW by 2050 [14]. Climate factors (incidental irradiance and module working temperature) directly impact grid-connected solar PV production. Inverter factors, such as availability, grid stability, bird droppings, dirt, dust, grid stability, load shading, and continuous use, affect how much energy is produced [15]. With 3300 hours of sunlight annually, Iraq is an area with abundant solar energy. Thousands of the country’s total energy production are produced in Iraq’s desert regions, which make up more than 60% of the overall geographical area [16]. Areas that border Saudi Arabia’s Empty Quarter have a high solar density. Iraq’s entire terrain has enough sunlight density to support the operation of PV stations [17]. Iraq’s reliance on nonrenewable resources would decrease by using solar energy to produce electricity [18].
In 2015, Attia et al. [19] created a thorough simulation model that included the features of PV modules and the environmental conditions in Cairo, Egypt. The model compared the electrical energy output of concentrator-equipped and double-axis-tracker-equipped PV systems with that of stationary PV systems. Economic research revealed that fixed PV systems had the lowest cost per kilowatt-hour produced. Results from Cairo indicated that a cost of approximately 6–9 US cents/kwh is feasible.
In 2017, Sharma et al. [20] erected a 11.2 kWp grid-connected solar PV system on the roof of a constituent institute of Siksha 'O' Anusandhan University in Bhubaneswar, India (latitude: 20.24° N and longitude: 80.85° E). The findings revealed that 14.96 MWh of total energy was produced, 13.42% and 89.83% of the energy were generated by PV modules and inverters, respectively, and the performance ratio was 0.78.
In 2018, Faiz et al. [13] designed a 1 MW grid-connected PV system in Karbala, which has adequate solar radiation for the construction of PV systems on a large scale, and assessed its performance. Energy produced by these systems is about 1757.8 MWh in the first year and 40,445 MWh over the course of their lifetimes. The performance ratio ranged from 86.4% to 73%, and an average capacity factor was 19.83%. Throughout its lifetime, the system prevents the production of about 27,794 tons of CO2 emissions. According to financial research, the levelized cost of energy is approximately 0.0289 dollars per kWh, which is economically viable.
Sadeq et al. [21] completed the performance evaluation of the 15 kWp PV solar system installed in Baghdad, Iraq in 2019. The final and reference yields, as well as the performance ratio, might vary from 3.5% to 4.8%, 4.3% to 7%, and 66% to 83%. The average annual energy yield was 1585.16 kWh/kWp, the average annual performance ratio was 75.55%, and the average annual capacity factor was 18.4% [21].
Sreenath et al. [22] used Solar GIS software to study the technical performance of a proposed solar PV facility in the vicinity of Kuantan Airport, Malaysia, taking into account the occurrence of glare. The estimated range of the monthly average final yield is 90.70 MWh/MWp-month in December to a maximum of 125.70 MWh/MWp-month in March. With a 76.88% performance ratio and a 15.22% capacity utilization factor, it should perform as planned. These findings indicated that the airport-based solar system in Malaysia will operate safely without glare impact.
Makkiabadi et al. [23] will study the amount of electricity produced in Iran utilizing solar energy in 2021. A technical and economic analysis of the development of a 10 MW power plant in Sirjan will be included. The findings indicated that a solar power plant can be constructed in the Sirjan region for US$16.14 million, and the original investment would pay for itself within four years. The results from the Homer software indicated that July has the highest maximum power generation.
Many studies have been conducted on solar PV system installation projects in different countries around the world. The literature on various climatic regions in Iraq is limited because few researchers have addressed the problem of implementing and evaluating the performance of these systems. According to a literature assessment, solar PV system installations for home, government, and private sector applications need to be evaluated for their techno-economic feasibility in various parts of Iraq.
Shortage in the supply of electrical energy in Iraq is due to the deterioration of the national grid system after successive wars and acts of sabotage carried out by terrorists. Therefore, the aim of this paper is to study the possibility of installing solar energy systems to enhance the energy produced from the national grid to fill the shortfall. This study focused on assessing the 1 MWp grid-integrated solar PV power plant’s operational efficiency in the Baghdad Governorate, Al-Tagi City, Iraq. It focused on predicting and assessing the performance of the proposed solar power plant’s energy outputs. MATLAB simulation and real data were used in assessing the power plant’s performance, and performance metrics, such as solar irradiation, maximum output power, electrical energy generated, yield factor, capacity factor, and performance ratio were used.
To study the performance of the suggested 1 MW grid-connected PV system that is installed under Baghdad conditions, one must consider normalized parameters for assessing the system. The methodology for analysis is illustrated as follows:
The solar energy system was installed on a selected site (Baghdad/Al-Taji). The parameters were as follows: type and nature of the site’s land, and whether the land is flat, solid, and free of water swamps, beams, trees, and shades.
Real data related to parameters for a specific location was obtained from a meteorological station. These parameters include global solar irradiance (W/m2) for Baghdad, ambient temperature, and wind speed.
Technical specifications of solar modules included nominal operating cell temperature NOCT (℃), power temperature coefficient (PTC), electrical characteristics (short circuit current, open circuit voltage, maximum current, maximum voltage, fill factor, and efficiency under standard test conditions).
The practical data was used for the weather factors of the city of Baghdad, which were obtained from the Meteorological Center, as well as the characteristics and parameters of all the solar system components under standard conditions. All mathematical equations presented in this article have been simulated using MATLAB. The study aims to show the extent of the effect of practical data according to the natural conditions of the city of Baghdad on the performance of the solar system, represented by the total energy generated by the PV system, the capacity factor (CF), the performance ratio (PR), and the overall system efficiency.
5.1 Solar PV modules
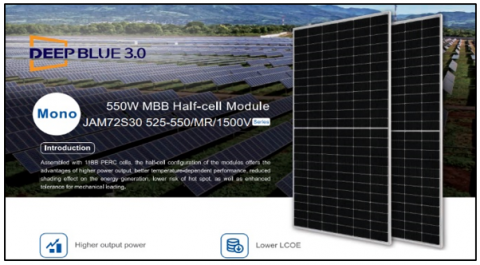
In this study, the monocrystalline silicon solar cells of a PV module (JAsolar, model JAM 72S30-540/MR, Number 1800) was used. According to their specifications, modules were assembled with 11BBPERC cells, and their half-cell configuration provides benefits, such as high power output, improved mechanical load tolerance, improved temperature-dependent performance, reduced shading impact on energy production, and decreased risk of hot spots. The solar module’s design is shown in Figure 1. The technical specifications of the solar module under standard test conditions (STC; solar radiation of 1,000 W/m2, module temperature of 25℃, and air mass of 1.5G), and normal operating cell temperature (NOCT; irradiance of 800 W/m2, cell temperature of 20℃, wind speed of 1 m/s AM1.5G) are provided in Table 1 and Table 2, respectively.
Figure 1. Solar module
Table 1. The technical specifications of solar module under STC operating conditions [16]
|
TYPE |
JAM72S30-525/MR |
JAM72S30-530/MR |
JAM72S30-535/MR |
JAM72S30-540/MR |
JAM72S30-545/MR |
JAM72S30-550/MR |
|
|
Rated Max Power (Pmax) (W) |
525 |
530 |
535 |
540 |
545 |
550 |
|
|
Open Circuit Voltage (Voc) (V) |
49.15 |
49.30 |
49.45 |
49.60 |
49.75 |
49.90 |
|
|
Max Power Voltage (Vmp) (V) |
41.15 |
41.31 |
41.47 |
41.64 |
41.80 |
41.98 |
|
|
Short Circuit Current (Ish) (A) |
13.65 |
13.72 |
13.79 |
13.86 |
13.93 |
14.00 |
|
|
Max Power Current (Imp) (A) |
12.76 |
12.83 |
12.90 |
12.97 |
13.04 |
13.11 |
|
|
Module efficiency (%) |
20.3 |
20.5 |
20.7 |
20.9 |
21.1 |
21.3 |
|
|
Power Tolerance |
|
|
0-+5W |
|
|
|
|
|
Temperature Coefficient of Ish (αIsh) |
|
|
+0.045%/℃ |
|
|
|
|
|
Temperature Coefficient of Voc (βVoc) |
|
|
-0.27%/℃ |
|
|
|
|
|
Temperature Coefficient of Pmax (γPmp) |
|
|
-0.350%/℃ |
|
|
|
|
|
STC |
Irradiance 1000 W/m2, cell temperature 25℃ AM1.5G |
|
|
||||
|
Remark: Electrical data in this table do not refer to a single module and they are not part of the offer. They only serve for comparison among different module types |
|||||||
Table 2. The technical specifications of solar module under NOCT operating conditions [16]
|
TYPE |
JAM72S30-525/MR |
JAM72S30-530/MR |
JAM72S30-535/MR |
JAM72S30-540/MR |
JAM72S30-545/MR |
JAM72S30 -550/MR |
|
Rated Max Power (Pmax) (W) |
397 |
401 |
405 |
408 |
412 |
416 |
|
Open Circuit Voltage (Voc) (V) |
46.05 |
46.18 |
46.31 |
46.43 |
46.55 |
46.68 |
|
Max Power Voltage (Vmp) (V) |
38.36 |
38.57 |
38.78 |
38.99 |
39.20 |
39.43 |
|
Short Circuit Current (Ish) (A) |
10.97 |
11.01 |
11.05 |
11.09 |
11.13 |
11.17 |
|
Max Power Current (Imp) (A) |
10.35 |
10.39 |
10.43 |
10.47 |
10.51 |
10.55 |
|
NOCT |
Irradiance 800 W/m2, cell temperature 20℃, wind speed 1 m/s AM1.5G |
|||||
5.2 Solar inverter
An ABB (PVS-100/120-TL) three-phase string inverter was used in this study. It offers cost-effective decentralized solar systems for ground-mounted and large commercial applications. Figure 2 shows this type of solar inverter.
Figure 2. ABB String solar inverter [17]
To evaluate the effectiveness of PV systems, a variety of parameters were simulated using the MATLAB program.
6.1 Array yield
Array yield (kWh/kWp) is equivalent to the amount of time required for a PV plant to create array DC energy EA at nominal solar generator power Po [24].
$Y_A=E_A / P_o$ (1)
where, Array energy output per day EA=Idc∗Vdc∗t (kWh), Idc=DC current (A), Vdc=DC voltage (V), and Po=nominal solar generator power at STC.
6.2 Reference yield
The reference yield is calculated by dividing the total in-plane irradiation (Ht) to a PV system’s reference irradiance (Go).
It reflects the energy attainable under ideal conditions. The number of peak sun hours or the solar radiation expressed in kWh/m2 is represented by YR if Go equals 1 kW/m2. The solar radiation resource for the PV system is defined by the YR, depends on the PV array’s orientation, location, and variations from month to month and year to year, is expressed in h/d [24].
$Y_R=H_t / G_o$ (2)
where, Ht is total horizontal irradiance on array plane (kWh/m2) and Go is global irradiance at STC (kW/m2).
6.3 Performance ratio
The PR is the most crucial variable because it shows how losses affect a PV system’s ability to produce energy on an overall basis. The PR values show how closely a PV system exhibits ideal performance when operated under actual operating conditions. As shown in the following equation [25], PR is defined as the ratio between the final yield (Yf) and reference yield (YR).
$P R=\frac{Y_F}{Y_R}$ (3)
6.4 Calculate the total energy by the PV system
Depending on the time period in which a final output must be computed, the AC energy, EAC, may be determined daily, monthly, or yearly. The total amount of energy produced by the PV system each day (EAC,d) and each month (EAC,m) is calculated as follows [26]:
$E_{A C, d}=\sum_{n=1}^{24}\left(E_{A C, t}\right), E_{A C, m}=\sum_{n=1}^N\left(E_{A C, d}\right)$ (4)
where, N is the number of days in one month and EAC,t is the instantaneous measured value.
6.5 Performance capacity factor
The performance capacity factor (CF), which is reported as the ratio of the PV system’s actual annual energy output to the amount of energy it would produce if it ran at maximum power (Ppv-rated) for 24 hours every day for a year [27].
$C F=\frac{\text { EAC, annual }}{(\text { Ppv rated } * 8760)}$ (5)
6.6 Overall system efficiency
The ratio of the system’s monthly energy production to the total energy drawn from the PV field throughout the month is known as the monthly overall system efficiency or ɳsys,m [28]:
$\mathrm{\eta}_{\mathrm{sys}, \mathrm{m}}=\frac{E_{A C, m}}{\left(H_t * A p v \text { array }\right)}$ (6)
where, EAC,m is total energy output to grid by the system (kWh), Ht is total in plane solar insolation (kWh/m2), and Apv is total array area of the PV modules.
The overall efficiency of the PV system is defined as the product of the efficiency of the inverter and the efficiency of the PV array. Solar radiation is required for the production of solar energy, and the efficiency and losses of the inverter are necessary for energy conversion. As a result, the grid energy is expressed as in Eq. (7) [29].
$E_{G E}=E_{A E} \times \eta_{i n v} \times \eta_{Loss}$ (7)
where, (EAE) denotes the energy of the array, (ηinv) the efficiency of the inverter, and (ηloos) the efficiency of the loss.
6.7 PV system design
In this study, the MATLAB program was used in simulating mathematical equations for calculating the proposed solar PV energy system’s output power and assessing system’s performance and efficiency, and the number and type of each component were determined.
The values of monthly tilted solar irradiation (kWh/m2), tilt factor, daily GHI solar irradiance, AC electrical energy (kWh), monthly yield, and maximum possible AC power output (kW) depended on the time of incident (GHI) and the values of maximum GHI value (W/m2) incident on the surfaces of PV panels.
Table 3 shows the results of the solar radiation and electrical parameters of the solar PV system as a function of month for twelve months. The maximum value of monthly tilted solar irradiation is 225.23 kWh/m2 in August, and the minimum value is 112.5 kWh/m2 in November. The average tilt factor is about 1.05. These factors result in an annual solar irradiation at the PV plane of 2,089.04 kWh/m2, an annual AC electrical energy of 1,509 MWh, an annual capacity factor of 0.1724, and an annual yield of 1552.6423.
Ambient temperature is one of the important influences that affect the productivity of a solar PV system. Increasing the ambient temperature leads to higher solar cell temperatures, which decrease the amount of energy produced by the system because of a decrease in its efficiency. Figure 3 shows the relationship between ambient temperature and time. The middle (15th day) of each month was selected for the graphic representation of the system accounts. The curves showed that they behaved similarly but differed in values for each month. The lowest ambient temperature was recorded in February, whereas the highest was recorded in August.
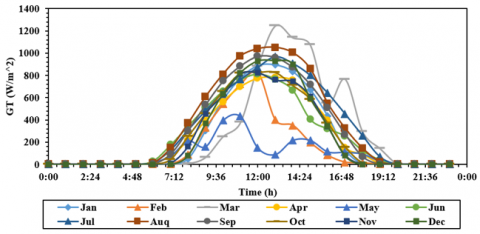
The relationship between the daily solar irradiation falling on the system and time is depicted in Figure 4. Solar radiation from sunrise to sunset and for 12 months was measured and graphed on the 15th day of each month. A clear correlation was found between the amount of solar radiation falling on the system and the amount of electric energy produced each year. The lowest value of solar radiation was observed in February at (13:00), and the largest was observed in August 13:00. Figure 5 represents the relationship between the value of solar radiation falling on a solar system tilted at an angle with time during the day period throughout the year. We observed that the highest value of radiation obtained was 1,250 W/m² at noon in March, followed by that in August, when the radiation value at noon was 1,050 W/m². Meanwhile, the lowest level of solar radiation was observed in May, where the value fluctuated, and the value was 425 W/m² at 10:00 am.
Table 3. Solar radiation and electrical parameters of solar PV system
|
Parameters |
|
Inverters |
||||||||||
|
Per. Ratio |
PTC |
NOCT |
Slope |
Latitude |
|
Inverter |
Model |
Number |
||||
|
0.8 |
0.35% |
40 |
30 |
33 |
|
ABB/FIMER |
PVS 100TL |
10 |
||||
|
PV Modules |
|
PV Array |
||||||||||
|
Model |
PV Module
|
Number |
|
Modules per strings |
Strings per inverter |
Total no. of strings |
||||||
|
IAM72S30-540/MI |
JA Solar |
1800 |
|
18 |
10 |
100 |
||||||
|
Installed PV Capacity |
|
|
|
|
Installed Inverter Capacity |
|
|
|||||
|
0.97 |
|
|
|
|
1 |
|
|
|||||
|
Items |
Jan |
Feb |
Mar |
Apr |
May |
Jun |
Jul |
Aug |
Sep |
Oct |
Nov |
Dec |
|
Monthly Tilted Solar Irradiation |
133.7 |
175.2 |
204 |
164.9 |
148.5 |
180.8 |
220.4 |
225.2 |
203.3 |
181.6 |
112.5 |
138.5 |
|
Tilt Factor |
1.41 |
1.34 |
1.15 |
0.99 |
0.92 |
0.88 |
0.89 |
0.97 |
1.09 |
0.25 |
1.32 |
1.49 |
|
Daily GHI Solar Irradiation (kWh/m2) |
3.04 |
4.64 |
5.72 |
5.5 |
5.17 |
6.79 |
7.94 |
7.45 |
6.17 |
4.67 |
2.83 |
2.98 |
|
AC Electrical Energy (kWh) |
101.9 |
131.8 |
149.9 |
119.4 |
105.6 |
126.5 |
152.8 |
155.9 |
143.5 |
131.8 |
83.4 |
106 |
|
Maximum GHI value (W/m2) |
670 |
910 |
1081 |
961 |
930 |
1107 |
1231 |
1180 |
1066 |
813 |
735 |
680 |
|
Time of maximum GHI |
13 |
12 |
12 |
13 |
11 |
13 |
12 |
13 |
12 |
12 |
12 |
12 |
|
Maximum Possible AC Power Output (kW) |
0.71 |
0.88 |
0.91 |
0.69 |
0.61 |
0.67 |
0.74 |
0.78 |
0.83 |
0.73 |
0.72 |
0.79 |
|
Time of Maximum AC Power output |
1/30 13:00 |
2/22 12:00 |
3/15 12:00 |
4/22 13:00 |
5/7 12:00 |
6/21 13:00 |
7/16 12:00 |
8/1 12:00 |
9/29 12:00 |
10/8 12:00 |
11/13 12:00 |
12/10 12:00 |
|
Capacity Factor (kWhac/kWpx8760) |
0.13 |
0.19 |
0.2 |
0.16 |
0.14 |
0.17 |
0.2 |
0.2 |
0.19 |
0.17 |
0.11 |
0.14 |
|
Monthly Yield (kWh/kWp) |
104.9 |
135.63 |
154.2 |
122.9 |
108.7 |
130.2 |
157.2 |
160.4 |
147.7 |
135.6 |
85.8 |
109.1 |
|
Annual Solar Irradiation at PV plane (kWh/m2) |
|
Annual AC Electrical Energy (MWh) |
|
Annual Capacity Factor |
Annual Yield |
|||||||
|
2089.04 |
|
1509 |
|
0.1724 |
1552.6423 |
|||||||
Increase in ambient temperature increases the temperature of the solar panels of a PV system, thereby reducing their efficiency and output power. Iraq’s environment is characterized by high temperatures, especially in summer (Figure 3).
Figure 6 shows the relationship between the temperature of the solar panels during their working period in the day and throughout the year. The lowest temperature of the solar panel was observed at the beginning of the day and increased until it reached its highest value at noon. Fluctuations were observed in some months, such as February, March, and May, because of weather factors, including clouds, dust, and rain. Where the solar cell temperature reaches 41.28℃ at 12:00 PM in February, then it decreases to 30.17℃ at 1:00 PM. In the month of March, it fluctuated from 49.82℃ at 12:00 PM to 34.45℃ at 3:00 PM, while its value was 41.85℃ at 11:00 AM in May and it decreased at 1:00 PM to 25.85℃. The highest solar panel temperature reached 70 °C at noon in August, and the lowest was 35℃ in December.
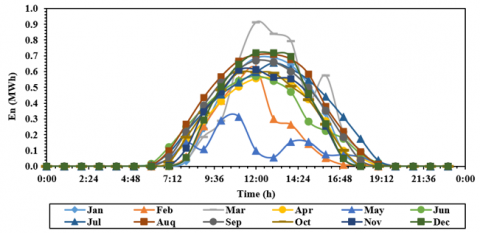
Figure 7 shows the maximum output power produced by the PV system daily throughout the year. The maximum value of power (about 0.91 MW) was produced in March at solar noon, whereas the minimum value was about 0.09 MW at solar noon in May. The energy was about 0.91 and 0.09 MWh for these months, respectively, as shown in Figure 8.
Figure 3. The relationship between ambient temperature and time
Figure 4. The relationship between daily GHI solar irradiation with time
Figure 5. The relationship between monthly tilted solar irradiation and time
Figure 6. Solar cell temperature as a function of time
Figure 7. The maximum output power produced by the PV system during the day throughout the year
Figure 8. Electrical Energy produced by the PV system during the day throughout the year
(1) According to the findings, solar irradiation is at its peak level in August, and its lowest level was detected in November.
(2) The data show that some days of a month have high levels of solar radiation, particularly in March. By contrast, the level of radiation is low in some summer days, particularly in August, because of weather.
(3) Effects of temperature lead to loss in the efficiency of the solar cell, and thus increase in the level of solar radiation does not necessarily result in an increase in power generated by a solar panel. We observe that the amounts of power and energy produced in March are higher than those produced in summer.
(4) To maximize the effectiveness of solar panels, a cooling system must be used, which can increase power output and solar panel lifespan despite the high temperatures in Iraq, especially in summer.
Finally, the researchers would like to acknowledge Mustansiriyah University (www.uomustansiriyah.edu.iq) Baghdad-Iraq, University of Babylon (www.uobabylon.edu.iq) and Center for Research on Environment and Renewable Energy, University of Karbala for their support in the present work.
[1] Mekonnen, T., Bhandari, R., Ramayya, V. (2021). Modeling, analysis and optimization of grid-integrated and islanded solar PV systems for the Ethiopian residential sector: Considering an emerging utility tariff plan for 2021 and beyond. Energies, 14(11): 3360. https://doi.org/10.3390/en14113360
[2] Mavoungou, D.G.M., Raji, A.K., Showers, S.O., Luta, D. (2020). Energy efficiency techniques for residential, commercial and industrial application in sub-Saharan Africa. In 2020 IEEE PES/IAS PowerAfrica, pp. 1-5. https://doi.org/10.1109/PowerAfrica49420.2020.9219936
[3] Mondal, M.A.H., Bryan, E., Ringler, C., Mekonnen, D., Rosegrant, M. (2018). Ethiopian energy status and demand scenarios: prospects to improve energy efficiency and mitigate GHG emissions. Energy, 149: 161-172. https://doi.org/10.1016/j.energy.2018.02.067
[4] Thotakura, S., Kondamudi, S.C., Xavier, J.F., Quanjin, M., Reddy, G.R., Gangwar, P., Davuluri, S.L. (2020). Operational performance of megawatt-scale grid integrated rooftop solar PV system in tropical wet and dry climates of India. Case Studies in Thermal Engineering, 18: 100602. https://doi.org/10.1016/j.csite.2020.100602
[5] Blazquez, J., Fuentes-Bracamontes, R., Bollino, C.A., Nezamuddin, N. (2018). The renewable energy policy Paradox. Renewable and Sustainable Energy Reviews, 82: 1-5. https://doi.org/10.1016/j.rser.2017.09.002
[6] Wang, N., Phelan, P.E., Harris, C., Langevin, J., Nelson, B., Sawyer, K. (2018). Past visions, current trends, and future context: A review of building energy, carbon, and sustainability. Renewable and Sustainable Energy Reviews, 82: 976-993. https://doi.org/10.1016/j.rser.2017.04.114
[7] Mahela, O.P., Shaik, A.G. (2017). Comprehensive overview of grid interfaced solar photovoltaic systems. Renewable and Sustainable Energy Reviews, 68: 316-332. https://doi.org/10.1016/j.rser.2016.09.096
[8] Mondal, M.A.H., Bryan, E., Ringler, C., Rosegrant, M. (2017). Ethiopian power sector development: Renewable based universal electricity access and export strategies. Renewable and Sustainable Energy Reviews, 75: 11-20. https://doi.org/10.1016/j.rser.2016.10.041
[9] Abd Alaziz, H.L., Shneishil, A.H. (2022). The effect of concentrator radius on the performance of a solar photovoltaic concentrating system with a parabolic dish. In Journal of Physics: Conference Series, 2322(1): 012071. https://doi.org/10.1088/1742-6596/2322/1/012071
[10] Rehman, S., Ahmed, M.A., Mohamed, M.H., Al-Sulaiman, F.A. (2017). Feasibility study of the grid connected 10 MW installed capacity PV power plants in Saudi Arabia. Renewable and Sustainable Energy Reviews, 80: 319-329. https://doi.org/10.1016/j.rser.2017.05.218
[11] Gopi, A., Sudhakar, K., Keng, N.W., Krishnan, A.R., Priya, S.S. (2021). Performance modeling of the weather impact on a utility-scale PV power plant in a tropical region. International Journal of Photoenergy, Article ID 5551014. https://doi.org/10.1155/2021/5551014
[12] Sreedevi, J., Ashwin, N., Raju, M.N. (2016). A study on grid connected PV system. In 2016 National Power Systems Conference (NPSC), pp. 1-6. https://doi.org/10.1109/NPSC.2016.7858870
[13] Faiz, F.U.H., Shakoor, R., Raheem, A., Umer, F., Rasheed, N., Farhan, M. (2021). Modeling and analysis of 3 MW solar photovoltaic plant using PVSyst at Islamia University of Bahawalpur, Pakistan. International Journal of Photoenergy, 2021. https://doi.org/10.1155/2021/6673448
[14] Vartiainen, E., Masson, G., Breyer, C., Moser, D., Román Medina, E. (2020). Impact of weighted average cost of capital, capital expenditure, and other parameters on future utility‐scale PV levelised cost of electricity. Progress in Photovoltaics: Research and Applications, 28(6): 439-453. https://doi.org/10.1002/pip.3189
[15] Paudyal, B.R., Shakya, S.R., Paudyal, D.P., Das Mulmi, D. (2017). Soiling-induced transmittance losses in solar PV modules installed in Kathmandu Valley. Renewables: Wind, Water, and Solar, 4(1): 1-8. https://doi.org/10.1186/s40807-017-0042-z
[16] Abd Alaziz, H.L., Shneishil, A.H. (2021). Effects of reflectance and shading on parabolic dish photovoltaic solar concentrator performance. In Journal of Physics: Conference Series, 1963(1): 012160. https://doi.org/10.1088/1742-6596/1963/1/012160
[17] Kazem, H.A., Chaichan, M.T., Alwaeli, A.H., Mani, K. (2017). Effect of shadows on the performance of solar photovoltaic. In Mediterranean Green Buildings & Renewable Energy, 379-385. https://doi.org/10.1007/978-3-319-30746-6_27
[18] Chaichan, M.T., Abaas, K.I., Kazem, H.A. (2016). Design and assessment of solar concentrator distillating system using phase change materials (PCM) suitable for desertic weathers. Desalination and Water Treatment, 57(32): 14897-14907. https://doi.org/10.1080/19443994.2015.1069221
[19] Attia, A.M., Al Hanbali, A., Saleh, H.H., Alsawafy, O.G., Ghaithan, A.M., Mohammed, A. (2021). A multi-objective optimization model for sizing decisions of a grid-connected photovoltaic system. Energy, 229: 120730. https://doi.org/10.1016/j.energy.2021.120730
[20] Sharma, R., Goel, S. (2017). Performance analysis of a 11.2 kWp roof top grid-connected PV system in Eastern India. Energy Reports, 3: 76-84. https://doi.org/10.1016/j.egyr.2017.05.001
[21] Sadeq, M., Abdellatif, S.O., Anis, W.R., Ghali, H.A. (2020). Development of pre-sizing techno-economic MATLAB code for grid-connected PV system, using four cities in Egypt. In New Concepts in Solar and Thermal Radiation Conversion III, 11496: 66-75. https://doi.org/10.1117/12.2572876
[22] Sreenath, S., Sudhakar, K., Yusop, A.F., Solomin, E., Kirpichnikova, I.M. (2020). Solar PV energy system in Malaysian airport: Glare analysis, general design and performance assessment. Energy Reports, 6: 698-712. https://doi.org/10.1016/j.egyr.2020.03.015
[23] Makkiabadi, M., Hoseinzadeh, S., Taghavirashidizadeh, A., Soleimaninezhad, M., Kamyabi, M., Hajabdollahi, H., Piras, G. (2021). Performance evaluation of solar power plants: A review and a case study. Processes, 9(12): 2253. https://doi.org/10.3390/pr9122253
[24] Kumar, B.S., Sudhakar, K. (2015). Performance evaluation of 10 MW grid connected solar photovoltaic power plant in India. Energy Reports, 1: 184-192. https://doi.org/10.1016/j.egyr.2015.10.001
[25] Jed, M.E.H., Logerais, P.O., Malye, C., Riou, O., Delaleux, F., El Bah, M. (2021). Analysis of the performance of the photovoltaic power plant of Sourdun (France). International Journal of Sustainable Engineering, 14(6): 1756-1768. https://doi.org/10.1080/19397038.2021.1971321
[26] Veerendra Kumar, D.J., Deville, L., Ritter III, K.A., Raush, J.R., Ferdowsi, F., Gottumukkala, R., Chambers, T.L. (2022). Performance evaluation of 1.1 MW grid-connected solar photovoltaic power plant in Louisiana. Energies, 15(9): 3420. https://doi.org/10.3390/en15093420
[27] Getie, E.M., Jember, Y.B. (2022). Potential assessment and performance evaluation of a floating solar photovoltaic on the great Ethiopian renaissance dam. International Journal of Photoenergy, Article ID: 6964984. https://doi.org/10.1155/2022/6964984
[28] Malvoni, M., Kumar, N.M., Chopra, S.S., Hatziargyriou, N. (2020). Performance and degradation assessment of large-scale grid-connected solar photovoltaic power plant in tropical semi-arid environment of India. Solar Energy, 203: 101-113. https://doi.org/10.1016/j.solener.2020.04.011
[29] Navothna, B., Thotakura, S. (2022). Analysis on large-scale solar PV plant energy performance–loss–degradation in coastal climates of India. Frontiers in Energy Research, 10: 857948. https://doi.org/10.3389/fenrg.2022.857948