Jeffery Anak Pirah* | Rodeano Roslee
© 2021 IIETA. This article is published by IIETA and is licensed under the CC BY 4.0 license (http://creativecommons.org/licenses/by/4.0/).
OPEN ACCESS
In the recent years, the impacts of floods have gained importance because of the increasing number of people who are affected by its adverse effects, especially in Beaufort area, Sabah, Malaysia. Flood destroyed critical infrastructures that are needed as shelter and also emergency relief for victim. This paper presents the findings of flood modelling undertaken to establish baseline and post mining flooding conditions during upstream storm and combination of upstream and downstream storm, respectively. A hydrologic model was established and calibrated based on 2014 flood. A structural approach by changing the physical dimension through dredging or sand mining between 2m to 3m is used for hydrology modelling is added into the existing floodgates and bunds. The outcome from sustainable sand is prevailing when it is able to reduce flood level for normal flow, upstream case, and both upstream and downstream case. Other findings are changes in velocity, shear and the significantly reduced power generated by the river during flooding.
sand dredging, HEC-RAS, hydrological modelling, Beaufort
There are about 189 river basins in Malaysia which is considered as vulnerable to flood and may affect nine per cent (9%) of the overall area country size and almost 4.82 million people or around 22% of the countrymen. It is hard to segregate Malaysians from flood issues since most of Malaysians are historically riverine people where early settlements established at major rivers throughout the country [1]. Out of 189 river basins, 78 of these river basins are situated in Sabah [2]. About 85 rivers are identified as prone to frequent flooding rivers and annual flood are estimated to cause RM915 million in losses nationwide (Strategic Plan for Integrated River Basin Management (IRBM) in Malaysia, Volume 1, 2005) [3] and affect around 21% of the nation population [4]. Flooding is third in the list of prominent water-related issues in Malaysia after river water quality issue and catchment and landuse management issue (River Management Volume 2, 2009) [5] where exposure to flood leads to hazards such as socioeconomics losses as well as outcomes due to bodily contact with water such as injuries and infectious diseases [1].
The main causes of increasing flooding risk are very much due to heavy monsoonal and convectional rainfall – aggravated by the flat topography near coastline, heavy siltation and human activities as well as the change of landuse [1, 6-9]. Risk of flood due to climate change involves many uncertainties and risk and the occurrence is very to project, if not complex [10]. Flood and flood preparedness is not confined to the perception of the flood risk and risk reduction among the residents of that particular area who are at risk but also influenced by social and economic determinants which is referred as social vulnerability. The concept of vulnerability comes with sub-sets under societal, cultural, economics features [11], technological features and natural features [10], which may affect residents and third parties from these features. In most cases, for human, the impact of such disaster deeply affects those who are living in poverty, older people and young children [10].
Flood risk management is required in order to ensure effective and sustainable management of risks posed by floods, to collaborate risk sharing and risk management at all level of government and stake holders, to develop risk-informed policies and funding priority, and to propagate the use of natural processes to mitigate the consequences of flooding [12]. Nevertheless, flood risk management is complex which requires the ability to balance the level of risk against cost of risk reduction, or the resources lost or damaged by accepting increasing in the risk. Malaysia have been following the path of most developed countries by adopting structural approach where engineering-based solutions are deployed rather than non-structural approach which uses broader spectrum of social science, governance and preventive actions since the First Malaysia Plan (1971-1975) [1, 4, 13].
For the flood risk governance, changes should take place and the strategy should be an area-specific approach as recommended in Strategic Plan for Integrated River Basin Management (IRBM) in Malaysia, Volume 1 (2017). Subsequently, systematic analyses shall be done accordingly by conducting SWOT (strength, weakness, opportunities and threats) and CBA (cost benefit analysis). The four steps recommended by Raadgever and Hegger [14] are; analyse the current situation, define the desired situation, define and prioritise the actions, and start change.
During the stage of reviewing the possible diversification of flood risk management strategies, four main drivers shall be identified which will encompass the appropriate approach when tackling the issues when it comes to politics, legislations and socio-economics. These approaches are guided by four main drivers and a combination of all these drivers which are; actor-related drivers, discourse-related drivers, rules-related drivers, resource-related drivers and a combination of all drivers simultaneously [13]. These approaches cover the holistic approach of local flood management program which involves five strategies namely; prevention, protection, preparedness, emergency and recovery [4].
For the purpose of this study, it is assumed that the only driver which is considered as crucial determinant would be the financial resources since the proposed mitigation method through sustainable dredging involved high cost [1] and we have the actors or the proponents, policies and program, legislation, and procedural instruments in place where references are widely mentioned and available by Drainage & Irrigation Department of Sabah and at Federal level, Department of Irrigation and Drainage under the Ministry of Water, Land and Water Resources. Apart from both governments’ dossiers, these have been mentioned in Strategic Plan for Integrated River Basin Management (IRBM) in Malaysia and River Management [15].
The flooding of Padas Floodplain is similar to most that hit other districts in Sabah which is basically a natural event where water breached the banks and overflow throughout the floodplain due to high and long period of waterflow which occurs during the monsoon season. According to Eldawaty and Tongkul [16], the 2009 flood has caused infrastructure loss valued around RM1 million and the highest recorded flood level is around 9.82m on February 1997 and it is anticipated that around 50% of the population in Beaufort are affected by flood since around 60% of the population is dwelling at the areas under 10m from sea level.
Padas Floodplain has been affected by flood badly and has been recorded to start with 3 events during 1984; 2 events on 1994, 1996 and 2000; and 1 event on 1986, 1988, 1993, 1995, 1997 and 1999. The proposed flood mitigation project for Padas river basin under 8th Malaysia Plan was the Bunut urban drain at Tenom to be upgraded. Flood continues to plague residents of Beaufort although there is a Flood Mitigation Master Plan Studies for River Basin in 2011 by DID Malaysia which proposed the “Padas River Flood Mitigation Plan: Padas River Basin” project in 11th Malaysia Plan. The estimated cost was about RM120 million for both Beaufort and Tenom town flood mitigation projects. In 2014, extreme flood causes distress to residents where about 1,400 people were evacuated to five relief centres in February 2014 [17], about 4,500 people are relocated to 22 relief centres around Kota Kinabalu and around 4,000 students unable to attend classes in three districts [18] due to flood in February 2014.
Based on site reconnaissance and desktop studies, it is clear that changes throughout the years at Padas River Mouth is due to the development and increasing sand bars due to siltation from changes in landuse. This is main culprit for causing flooding around the Beaufort Floodplain and requires remedial in order reduce the possibility of flooding by ensuring the flow rate of the river reverted back to its original condition. This is the similar outcome from finding by Department of Irrigation and Drainage Sabah [15] where it was found that the floodplain is plagued by alluvial sediments consisting of sand, clay and particles with organic material [19-21]. The DID also made it clear among the main issues for this floodplain are flooding, river bank erosion and shallow river mouth [22]. One of the structural or engineering methods which are mentioned by Ayog et al. [23-25] that may seem to be feasible and economical would be the channel improvement where it involves the increase of water flow capacity by changing or increasing the dimension of the channel. The Sabah State Water Resources Master Plan [23-25] as proposed the use of structural mitigation as a way to mitigate issues related to flood by means of flood mitigation dams, levees and dikes; bypass flood channels, channel improvements, flood diversion channels, retarding basin, on-site detention ponds and flood-proofing. While the other approach would be the non-structural means which involve evacuation planning, land use decisions, and creation of open spaces [1, 12] which majority had been in place and implemented.
Although structural mitigation measures had been made, most actions are relatively for medium-term with the likes of hydraulic structures such as the installation of floodgates and bunds [19]; the issue of flooding have yet to be resolved. There is still a need for consistent measure in form of mitigation through maintenance in order to tackle sedimentation/siltation which caused the breach of flood water from the river bank and bunds. This involves a combination of structural approaches from hydraulic structures and increasing depth of riverbed through sustainable dredging at Padas River.
Dredging is probably one of the cost effective methods by deepening the major section of the river however, it is deemed to be expensive and burdening the resources or the eco-system [1] and requires written approval for the removal of material from a river or river reserves from the Director of DID under Section 41(1)(a) of Water Resources Enactment 1998 and complies with Environmental Impact Assessment (EIA) Guidelines for River Sand and Stone Mining document where EIA and DID approvals as well as comments from other Government Departments (key stakeholders). The economics of such approach is based on granting license to do sand mining (through sustainable dredging method) in lieu of mining royalty and the change of river profile as long as it does not affect flora and fauna residing within the designated mining areas with assistance of government officials, local universities, government-based statutory bodies and independent experts [1].
One of the important key points about Padas Floodplain is their prominence as gazetted forest whereas it was initially a Class II Forest Reserve (Commercial Forest Reserved) back in 1990 and is a Class I (Protection Forest Reserved) in 2010 for area close to the river. The rest of the areas around the floodplain maintained as Class IV (Amenity Forest Reserve) and Class V (Mangrove Forest Reserve). Aside from protection of various forest classes, Beaufort Floodplain is also considered as important for aquaculture, shrimp grounds and fishing zone.
This forms challenges in modelling a hydrological model which is based on sustainable dredging works to ensure conformity without sacrificing the nature and livelihood of the people surrounding this floodplain.
The study was carried out around the westcoast of Sabah, covering a total area of 2,000km2 involving the whole Padas River Basin, Sungai Padas, Padas Floodplain and Padas River Mouth. Padas River is one of the main rivers in series of river basins in Sabah where Beaufort town is situated at the lower reach of the Padas River with few other rivers which formed tributaries and all discharges confluence the at Padas River Basin. Padas River starts from the Crocker Range Park and down until the South China Sea involving catchment areas such as Pegalan Upstream, Sook, Padas Upstream, Padas Mid-catchment, Pegalan Downstream and Padas Down-stream [19] Padas River can be class as mature river [15]. Padas River Basin is the second largest in the state of Sabah after Kinabatangan River Basin with a total area of 8,726 Km² [16, 22-25]. The Padas River Basin area involves other districts and areas such as Long Pasia, Maligan, Kuala Tomani, Tenom, Tambunan, Keningau, Sook, Nabawan, Beaufort and Nabawan. Padas Floodplain is quite vast and based on Agricultural Land Use Map by Town and Regional Planning Department of Sabah, it consist of spots of grassland, forest, perennial and tree crops, as well as horticulture areas at both banks throughout the river. Most of the areas with perennial and tree crops have moderate potential for agriculture except for the upstream which has be identified and now are plantation sites which are not part of the coastal zone and protected zone.
The Ref. [22] recommended that flood response steps should be taken before the flood where the river and drainage should be free from hindrance of its natural/designed flow. This coincides with the main problem which causes flood at the Padas Floodplain; the issue with sedimentation and/or siltation which lead to shallowing of the river and the formation of sandbar at the river mouth.
The approach of this particular model is selected based on recommendation made by Raadgever & Hegger [14] for diversification of flood risk management strategies – Necessity and importance; and [13, 23-25] for flood risk management. The method of modelling is similar to the proposed Spatial Decision Support System (SDSS) technology for flood disaster management which involves geological data modelling and manipulation where the result shall be from multi-criteria evaluation techniques shall be evaluated and visualized [26].
3.1 Materials
A hydrology model was developed using a few software; Q-GIS, SAGA, MIDUSS, HEC-RAS and AutoCAD Civil 3D using data extracted from Digital Elevation Map (DEM). The hydrology model shall be used to establish design flood water discharge within the Padas River Floodplain setting of the said mining area. The 2D hydrodynamic model was developed using HEC-RAS (4.0), a hydrodynamic modelling software which include together the SWMM 1D model and 2D model.The results of the flood modelling were used to describe the effect of the project on key hydraulic characteristics. The hydraulic characteristics considered include flood extents and depth, stream velocity, shear stress and stream power [27]. The potential impacts of the predicted changes in hydraulic characteristic shall be assessed.
3.2 Hydrological modelling
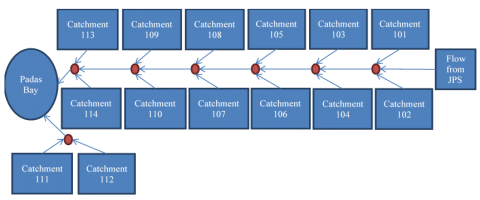
For modelling purposes, the method should be in accordance to recommended flood inundation maps by DID Komuniti [22]. Figure 1 is the simplified hydrology model based on water spatial movements extracted from shedding and water catchment areas throughout the Padas River Floodplain from JPS gauging station at Beaufort, Sabah until the Padas river mouth. Rainfall runoff model was used to estimate the design discharges for the following flood events based on high possibility using 2 year ARI (Average Recurrence Interval), medium possibility by using 50 year ARI and low possibility by using 100 year ARI. The design peak discharges derived from hydrologic modelling for application to the hydrodynamic model are provided in scenarios where storms at upstream, downstream and combination of both. The flow volume or Q values for all ARI is based on data recorded (between 1981 to 2016) at Sungai Padas Station, Beaufort and prepared by JPS Sabah. The Q value used is based on recommendation by Ayog et al. [23] where the 100-years precipitation is twice the 2-years rainfall precipitation. Therefore, the flow of 27th December 1996 (1,496 m3/sec) and thus fixed to 1,600 m3/secfor 50 years ARI. The Q value for 100 years ARI for projected/estimated value at 2,000 m3/sec for modelling purposes as recommended by Ayog et al. [23]. The Q value for 2 Years ARI is fixed to 1,000 m3/sec based on the Qmax value for 2014 flood which is 976m3/s which shall be use for calibration purposes based on data from JPS (Table 1).
Flood frequency analysis was undertaken using both the annual maximum data and partial duration data collected from the Padas River at Beaufort JPS gauging station for upstream flow. For the floodplain, the Tables 2 and 3 followings were considered. Depression storage or low points in undulating terrain which is able to store precipitation is set based on terrain or landform type.
Figure 1. HEC-RAS hydrology modelling
Table 1. Q Values for all ARIs
|
ARI (Years) |
Padas River |
Padas Bay |
|
2 (2014 flood) |
1,000 m3/s |
4,765 m3/s |
|
50 (1996 Qmax) |
1,600 m3/s |
7,323 m3/s |
|
100 |
2,000 m3/s |
8,086 m3/s |
Table 2. Floodplain pedology modelling parameters
|
Catchment |
Area (Ha) |
Infiltration into soil (mm/hr) |
Depression Storage (mm) |
|
101 |
3,144 |
84/7.6 |
20 |
|
102 |
2,257 |
51/1.3 |
20 |
|
103 |
1,244 |
18/0.5 |
20 |
|
104 |
2,257 |
18/0.5 |
20 |
|
105 |
1,488 |
84/7.6 |
20 |
|
106 |
2,060 |
84/7.6 |
30 |
|
107 |
2,373 |
84/7.6 |
25 |
|
108 |
1,976 |
84/7.6 |
35 |
|
109 |
1,021 |
84/7.6 |
25 |
|
110-1 |
1,856 |
84/7.6 |
25 |
|
110-2 |
713 |
84/7.6 |
25 |
|
111 |
295 |
84/7.6 |
35 |
|
112 |
833 |
84/7.6 |
35 |
|
113 |
285 |
84/7.6 |
30 |
|
114 |
654 |
84/7.6 |
30 |
|
Total |
22,456 Ha |
||
Table 3. Floodplain physical modelling parameters
|
Catchment |
General Parameters |
||||
|
|
Area (Ha) |
Pervious Area, % |
Flow Length, W (m) |
Overland Flow, L (m) |
Overland Slope, (%) |
|
101 |
3,144 |
80 |
3,200 |
9,825 |
7.50% |
|
102 |
2,257 |
85 |
4,000 |
5,643 |
0.85% |
|
103 |
1,244 |
90 |
2,700 |
4,607 |
0.44% |
|
104 |
2,257 |
95 |
2,180 |
10,353 |
0.28% |
|
105 |
1,488 |
90 |
1,125 |
13,277 |
0.98% |
|
106 |
2,060 |
95 |
3,500 |
5,886 |
0.51% |
|
107 |
2,373 |
99 |
3,775 |
6,286 |
0.66% |
|
108 |
1,976 |
85 |
2,200 |
8,982 |
0.59% |
|
109 |
1,021 |
85 |
850 |
12,012 |
1.06% |
|
110-1 |
1,856 |
99 |
2,770 |
6,700 |
0.87% |
|
110-2 |
713 |
95 |
1,000 |
7,130 |
1.40% |
|
111 |
295 |
100 |
800 |
3,688 |
1.88% |
|
112 |
833 |
100 |
1,900 |
4,384 |
0.84% |
|
113 |
285 |
100 |
1,130 |
2,522 |
1.24% |
|
114 |
654 |
100 |
1,450 |
4,510 |
1.59% |
|
Total |
22,456 |
||||
The infiltration rate dimension is in mm/hr where;
As for the peak discharge for the floodplain, boundary for areas are delineated accordingly and classified based on their catchment assignment code. The total peak discharge for the Padas River through the Beaufort floodplain shall be as follows when there are storms at both the upstream and downstream as tabulated in Table 4. The Probable Maximum Flood (PMF) models consist of two stages (pre-mining and post mining) and three conditions (normal/ordinary flow, when there is storm event only at the upstream, and when storms occur both at upstream and downstream). Therefore, there will be a total of 14 cases to be considered in this modelling or simulation. The followings are tabulated stages and conditions as shown in Table 5. The critical duration and peak discharge for this simulation is as tabulated in Table 6 (inclusive of downstream storm event up to 3 hours) where Q base is the upstream flow from upstream storm event. In this study, the depth of the river shall be deepened between 2m to 3m by dredging with some river banks to be treated with proper and stable gradient. Based on affected area and flood depth reported and provided by JPS for 2014 flood which was due to upstream flow, the 2 Years ARI is calibrated. The depth that was reported by JPS is up to 4.00m at Kg. Cina and Beaufort town which is similar to what have been generated from this modelling, which is up to 4.07m depth for upstream storm case as shown in Figures 2 and 3.
Table 4. Floodplain hydrology modelling results
|
Upstream Flow |
1,000 m3/s |
1,600 m3/s |
2,000 m3/s |
|||||
|
Catchment |
ARI and River components |
|||||||
|
|
2 Year ARI - Main |
2 Year ARI Reach |
50 Year ARI - Main |
50 Year ARI Reach |
100 Year ARI - Main |
100 Year ARI Reach |
||
|
From upstream |
1,000 |
|
1,600 |
|
2,000 |
|
||
|
101 |
1,839 |
|
2,645 |
|
3,084 |
|
||
|
102 |
2,075 |
|
2,989 |
|
3,492 |
|
||
|
103 |
2,490 |
|
3,596 |
|
4,208 |
|
||
|
104 |
2,347 |
|
3,386 |
|
3,961 |
|
||
|
105 |
3,058 |
|
4,484 |
|
5,175 |
|
||
|
106 |
2,713 |
|
3,918 |
|
4,589 |
|
||
|
107 |
3,601 |
|
5,280 |
|
6,110 |
|
||
|
108 |
3,324 |
|
4,879 |
|
5,633 |
|
||
|
109 |
3,868 |
|
5,731 |
|
6,562 |
|
||
|
110-1 |
4,154 |
|
6,153 |
|
7,053 |
|
||
|
110-2 |
4,360 |
|
6,500 |
|
7,400 |
|
||
|
Divert |
2,180 |
2,180 |
3,250 |
3,250 |
3,700 |
3,700 |
||
|
111 |
|
2,289 |
|
3,435 |
|
3,880 |
||
|
112 |
|
2,340 |
|
3,485 |
|
3,969 |
||
|
113 |
2,257 |
|
3,379 |
|
3,833 |
|
||
|
114 |
2,425 |
|
3,653 |
|
4,117 |
|
||
|
Total |
4,765 m3/s |
|
7,138 m3/s |
|
8,086 m3/s |
|
||
Table 5. Modelling stages
|
Stages |
Conditions |
||
|
|
Ordinary Flow |
Storm Upstream |
Storm Upstream & Downstream |
|
Pre-Mining |
|
2Y, 50Y & 100Y ARI |
2Y, 50Y & 100Y ARI |
|
Post Mining |
|
2Y, 50Y & 100Y ARI |
2Y, 50Y & 100Y ARI |
Table 6. Critical peak discharge
|
Conditions |
Details for Q |
|
|
Peak Discharge (m3/s) |
Storm Duration Downstream (min) |
|
|
2 Year ARI Qbase = 1,000 m3/s |
- 4,114 4,765 3,337 |
15 30 60 180 |
|
50 Year ARI Qbase = 1,600 m3/s |
- 7,323 5,925 3,268 |
15 30 60 180 |
|
100 Year ARI Qbase = 2,000 m3/s |
- 7,627 8,086 5,335 |
15 30 60 180 |
Figure 2. Digital elevation map meshing
Figure 3. DEM application in HEC-RAS modelling
From the ordinary flow analysis, the difference between the flood depth of pre-mining and post mining mean is reduced by 0.13m with flood level at certain places reduced by 1.04m. There is no change to the maximum velocity, maximum shear and maximum power of the river; except there are reductions of mean value. River velocity mean reduced by 0.05m/s, shear mean reduced by -0.65N/m² and power mean reduced by 0.29 watt (Table 7 to 9).
Sand mining and changes to channel dimension may reduce the flood depth down to 0.38m (2 and 50 Years ARI) and 0.31m for 100 years ARI. The difference between mean for pre-mining and post mining flood level showcase some reduction by 0.14m, 0.24m and 0.25m respectively. The maximum velocity for the river flow will change by 1.49m/s and velocity mean values reduced but lest significant. The max shear values are not significant for 2 and 50 Years ARI, however tremendously reduced for 100 Years ARI case by 81.26N/m². Maximum power produced by the river for 100 Years ARI have significant outcome where it is reduced by 437.94 watt.
Under extreme case where storm occurs at the catchment area and at the floodplain yield a horrendous outcome where the flood depth may double up with flood up to 8.65m, 11.26m and 11.20m respectively before sand mining. In similar way, mining activities also reduced the flood level by two folds when comparing to depth reduction in upstream case. The key difference that sand mining provide here is the significant reduction of maximum shear and the maximum power generated by the flood for 2 Years ARI case.
The water flow volume has increased by almost four folds when traverse through floodplain. The introduction of sustainable dredging in this modelling have led to some reduction on the average flood depth mean for all cases from storm on the upstream only and all cases for storm at both upstream and downstream at the depth of the river. The reduction of 0.24m for both 50 and 100 years ARI and 0.14m for 2 Years ARI for upstream storm case; while the reduction for both upstream and downstream storm case almost doubled the case for only upstream storm case with values between 0.53 to 0.73m for all 2, 50 and 100 Years ARI. These are the possible outcomes for dredging for depth between 2 and 3 meters. Although the depth of average flood depth may not be significant, it still reduces depth significantly when it comes to maximum flood depth by 0.31 to 0.38m for upstream storm case and 0.70 to 0.80m for both upstream and downstream storm case.
Table 7. Result comparison for ordinary flow case
|
Parameters |
Case: Ordinary Flow |
|
|
Pre-mining |
Post Mining |
|
|
Flood Depth Max (m) |
0.00 |
-0.54 |
|
Flood Depth Max Difference |
|
-1.04 |
|
Flood Depth Min |
0.00 |
0.00 |
|
Flood Depth Mean |
2.46 |
2.34 |
|
Flood Depth Mean Difference |
|
-0.13 |
|
Flood Depth Standard Deviation |
1.90 |
1.74 |
|
Velocity Max (m/s) |
2.16 |
2.16 |
|
Velocity Max Difference |
|
0.00 |
|
Velocity Min |
0.00 |
0.00 |
|
Velocity Mean |
0.11 |
0.06 |
|
Velocity Mean Difference |
|
-0.05 |
|
Velocity Standard Deviation |
0.13 |
0.11 |
|
Shear Max (N/m²) |
78.07 |
78.07 |
|
Shear Max Difference |
|
0.00 |
|
Shear Min |
0.02 |
0.01 |
|
Shear Mean |
1.14 |
0.49 |
|
Shear Mean Difference |
|
-0.65 |
|
Shear Standard Deviation |
4.31 |
4.80 |
|
Power Max (N/m.s or watt) |
188.15 |
188.15 |
|
Power Max Difference |
|
0.00 |
|
Power Min |
0.00 |
0.00 |
|
Power Mean |
1.12 |
0.83 |
|
Power Mean Difference |
|
-0.29 |
|
Power Standard Deviation |
9.70 |
11.52 |
There is not much changes in the flood water velocity and shear but nevertheless, significantly reduces maximum stream power produced by the torrent during flooding; 100 Years ARI for upstream storm case and 2 Years ARI for upstream and downstream storm case. Dredging works may not cause many changes as tabulated in Table 7, which can be summarized as may not affect living habitats due to stream parameters except for 0.13m drop of average water level which may slightly affect river banks as a result of reduction in water table. The reduction of stream power is essential by changing the bedload transport rate and potential energy to perform geomorphic works [28, 29]
Table 8. Result comparison for upstream case
|
Parameters |
Case: Upstream Storm |
|||||
|
Pre-mining |
Post Mining |
|||||
|
|
2Y ARI |
50Y ARI |
100Y ARI |
2Y ARI |
50Y ARI |
100Y ARI |
|
Flood Depth Max (m) |
4.07 |
4.78 |
5.64 |
3.69 |
4.41 |
5.33 |
|
Flood Depth Max Diff |
|
|
|
-0.38 |
-0.38 |
-0.31 |
|
Flood Depth Min |
0.00 |
0.00 |
0.00 |
0.00 |
0.00 |
0.00 |
|
Flood Depth Mean |
4.20 |
4.58 |
5.17 |
4.06 |
4.34 |
4.92 |
|
Flood Depth Mean Diff |
|
|
|
-0.14 |
-0.24 |
-0.25 |
|
Flood Depth Standard Dev |
2.68 |
2.84 |
2.97 |
2.65 |
2.82 |
2.97 |
|
Velocity Max (m/s) |
3.51 |
3.84 |
3.93 |
3.51 |
3.84 |
2.44 |
|
Velocity Max Diff |
|
|
|
0.00 |
0.00 |
-1.49 |
|
Velocity Min |
0.00 |
0.00 |
0.00 |
0.00 |
0.00 |
0.00 |
|
Velocity Mean |
0.19 |
0.22 |
0.24 |
0.15 |
0.19 |
0.21 |
|
Velocity Mean Diff |
|
|
|
-0.05 |
-0.04 |
-0.03 |
|
Velocity Standard Dev |
0.21 |
0.23 |
0.25 |
0.17 |
0.21 |
0.22 |
|
Shear Max (N/m²) |
163.03 |
186.36 |
162.68 |
163.03 |
186.36 |
81.42 |
|
Shear Max Diff |
|
|
|
0.00 |
0.00 |
-81.26 |
|
Shear Min |
0.11 |
0.17 |
0.22 |
0.10 |
0.16 |
0.20 |
|
Shear Mean |
2.56 |
3.08 |
3.27 |
1.49 |
2.19 |
2.43 |
|
Shear Mean Diff |
|
|
|
-1.07 |
-0.89 |
-0.84 |
|
Shear Standard Dev |
9.05 |
10.65 |
10.26 |
7.72 |
8.92 |
7.22 |
|
Power Max (N/m.s or watt) |
641.97 |
802.34 |
639.70 |
641.97 |
802.34 |
201.76 |
|
Power Max Diff |
|
|
|
0.00 |
0.00 |
-437.94 |
|
Power Min |
0.01 |
0.03 |
0.04 |
0.01 |
0.02 |
0.03 |
|
Power Mean |
3.96 |
5.17 |
4.89 |
2.54 |
3.66 |
3.03 |
|
Power Mean Diff |
|
|
|
-1.42 |
-1.50 |
-1.86 |
|
Power Standard Dev |
32.49 |
42.12 |
33.60 |
29.90 |
37.03 |
17.23 |
Table 9. Result comparison for upstream and downstream case
|
Parameters |
Case: Upstream & Downstream Storm |
|||||
|
Pre-mining |
Post Mining |
|||||
|
|
2Y ARI |
50Y ARI |
100Y ARI |
2Y ARI |
50Y ARI |
100Y ARI |
|
Flood Depth Max (m) |
8.65 |
11.26 |
11.20 |
7.95 |
10.46 |
10.43 |
|
Flood Depth Max Diff |
|
|
|
-0.70 |
-0.80 |
-0.77 |
|
Flood Depth Min |
0.00 |
0.00 |
0.00 |
0.00 |
0.00 |
0.00 |
|
Flood Depth Mean |
6.82 |
8.60 |
8.59 |
6.29 |
7.87 |
7.89 |
|
Flood Depth Mean Diff |
|
|
|
-0.53 |
-0.73 |
-0.70 |
|
Flood Depth Standard Dev |
3.76 |
4.29 |
4.20 |
3.56 |
4.04 |
4.00 |
|
Velocity Max (m/s) |
5.39 |
6.68 |
6.51 |
4.46 |
6.67 |
6.50 |
|
Velocity Max Diff |
|
|
|
-0.93 |
0.00 |
-0.01 |
|
Velocity Min |
0.00 |
0.00 |
0.00 |
0.00 |
0.00 |
0.00 |
|
Velocity Mean |
0.47 |
0.63 |
0.61 |
0.44 |
0.61 |
0.59 |
|
Velocity Mean Diff |
|
|
|
-0.03 |
-0.02 |
-0.02 |
|
Velocity Standard Dev |
0.37 |
0.47 |
0.46 |
0.34 |
0.46 |
0.45 |
|
Shear Max (N/m²) |
261.06 |
360.23 |
346.64 |
232.67 |
359.97 |
345.68 |
|
Shear Max Diff |
|
|
|
-28.38 |
-0.25 |
-0.96 |
|
Shear Min |
0.70 |
1.60 |
1.41 |
0.65 |
1.54 |
1.35 |
|
Shear Mean |
9.16 |
14.53 |
13.46 |
8.10 |
13.59 |
12.52 |
|
Shear Mean Diff |
|
|
|
-1.06 |
-0.94 |
-0.94 |
|
Shear Standard Dev |
16.86 |
22.67 |
21.40 |
13.50 |
19.10 |
17.26 |
|
Power Max (N/m.s or watt) |
1407.08 |
2406.54 |
2256.70 |
1037.21 |
2403.08 |
2246.75 |
|
Power Max Diff |
|
|
|
-369.87 |
-3.46 |
-9.95 |
|
Power Min |
0.23 |
0.82 |
0.67 |
0.21 |
0.77 |
0.63 |
|
Power Mean |
15.75 |
29.96 |
26.54 |
12.68 |
26.33 |
22.75 |
|
Power Mean Diff |
|
|
|
-3.07 |
-3.64 |
-3.79 |
|
Power Standard Dev |
79.30 |
130.15 |
119.77 |
52.30 |
100.58 |
86.04 |
This modelling shows that the possibility of utilizing sand mining or sustainable dredging as a method which can be used as part of flood mitigation plan as this will substantially flood level but during the normal flow which will not have dramatic changes which affect existing flora and fauna. This arrangement is also deemed as economic where sustainable dredging or sand mining not only able to generate income; and in lieu of that, this practice will reduce the flood magnitude to certain extend.
The existing method of using non-structural approach maybe applicable for areas susceptible to development and human activities, the combination of structural approaches is the best for region which is affected by flooding due to sedimentation. It applies proper engineering utilization of hydraulic structure but at the same time requires periodical maintenance such as sustainable dredging to ensure optimization of engineering or structural approaches in preventing flood at floodplain like the Padas River Floodplain.
Sincere gratitude to Universiti Malaysia Sabah (UMS) for providing easy access to laboratories and research equipment. Highest appreciations also to the research grants award (SDK0012-2017 and SDK0130-2020) to finance all the costs of this research.
[1] Ngai, W.C. (1997). Increasing flood risk in Malaysia: Causes and solutions. Disaster Prevention and Management: An International Journal, 6(2): 72-86. http://dx.doi.org/10.1108/09653569710164035
[2] Sani, G.D., Barzani, M.G., Ekhwan, M.T. Musa, G.A. (2014). Floods in Malaysia: Historical reviews, causes, effects and mitigation approach. International Journal of Interdisciplinary Research and Innovations, 2(4): 59-65.
[3] Strategic Plan for Integrated River Basin Management (IRBM) in Malaysia, Volume 1. (2015). Academy of Sciences Malaysia. https://issuu.com/asmpub/docs/irbm_volume_1.
[4] Wardah, T., Sahol, H.A.B., Marfiah, A.W., Siti, R.M.N., Wei, K.H. (2015). Proceedings of the International Symposium on Flood Research and Management 2015. Singapore: Springer Science+Business Media Singapore. http://dx.doi.org/10.1007/978-981-10-0500-8
[5] River Management, Volume 2. (2009). Department of Irrigation and Drainage Malaysia.
[6] Roslee, R., Norhisham, M.N. (2018). Flood susceptibility analysis using multi-criteria evaluation model: A case study in Kota Kinabalu, Sabah. ASM Sc. J., 11(3): 123-133.
[7] Roslee, R., Tongkul, F., Mariappan, S., Simon, N. (2018). Flood Hazard Analysis (FHAn) using multi-criteria evaluation (MCE) in penampang area, Sabah, Malaysia. ASM Sc. J., 11(3): 104-122.
[8] Sharir, K., Roslee, R., Mariappan, S. (2019). Flood Susceptibility Analysis (FSA) using analytical hierarchy process (AHP) model at the kg. kolopis area, Penampang, Sabah, Malaysia. Journal of Physics: Conference Series, 1358: 012065. http://dx.doi.org/10.1088/1742-6596/1358/1/012065
[9] Mariappan, S., Roslee, R., Sharir, K. (2019). Flood Susceptibility Analysis (FSAn) using multi-criteria evaluation (MCE) technique for landuse planning: A case from penampang, Sabah, Malaysia. Journal of Physics: Conference Series, 1358: 012067. http://dx.doi.org/10.1088/1742-6596/1358/1/012067
[10] Hulbert, M.A. (2018). Adaptive Governance of Disaster: Drought and Flood in Rural Areas. Switzerland, Springer International Publishing AG. http://dx.doi.org/10.1007/978-3-319-57801-9
[11] Dzialek, J., Biernacki, W., Konieczny, R., Fieden, L., Franczak, P., Grzeszna, K., Listwan-Franczak, K. (2019). Understanding Flood Preparedness: Flood Memories, Social vulnerability and Risk Communication in Southern Poland. Switzerland: Springer Nature Switzerland AG. http://dx.doi.org/10.1007/978-3-030-04594-4
[12] Traver, R. (2014). Flood risk management: call for a national strategy. Virginia: American Society of Civil Engineers. http://dx.doi.org/10.1061/9780784478585
[13] Raadgever, T., Hegger, D. (2018). Flood Risk Management Strategies and Governance. Switzerland: Springer Nature, 25-32.
[14] Raadgever, T., Hegger, D. (2018). Flood Risk Governance. Switzerland: Springer Nature, 101-108. http://dx.doi.org/10.1007/978-3-319-67699-9
[15] Department of Irrigation and Drainage Sabah. (1994). Water Resources Master Plan. Retrieved from https://did.sabah.gov.my/files/documents/Sabah%20Water%20Resources%20Master%20Plan.pdf.
[16] Eldawaty, M., Tongkul, F. (2011). Morphological influence on floods occurrence in beaufort town, Sabah. Proceedings of National Geoscience Conference 2011. Johor Bahru. 11-12 June. Organized by Geological Society of Malaysia. https://gsm.org.my/products/702001-101660-PDF.pdf.
[17] Sario, R. (2014). Floodwaters in beaufort slowly receding. The Star. Retrieved from https://www.thestar.com.my/news/nation/2014/02/18/floodwaters-continue-to-recede-in-beaufort/.
[18] Santos, J. (2014). Some 4,000 students unable to continue classes in 3 districts. Daily Express. P.1.
[19] Roslee, R., Bidin, K., Musta, B., Tahir, S. (2017). Intergration of GIS in estimation of soil erosion rate at kota kinabalu area, Sabah, Malaysia. Adv. Sci. Lett., 23(2): 1352-1356. http://dx.doi.org/10.1166/asl.2017.8400
[20] Roslee, R., Sharir, K. (2019). Integration of GIS-based RUSLE model for land planning and environmental management in ranau area, Sabah, Malaysia. ASM Sc. J., 12(3): 60-69.
[21] Roslee, R., Sharir, K. (2019). Soil Erosion analysis using RUSLE model at the minitod area, Penampang, Sabah, Malaysia. Journal of Physics: Conference Series, 1358: 012066.
[22] DID Komuniti: Sub-Lembangan 1: Sg. Padas Hilir. (n.d.). Retrieved from https://slidetodoc.com/jpskomuniti-daerah-beaufort-sabah-sublembangan-1-sg-padas/.
[23] Ayog, J.L, Bolong, N., Zakaria, I. (2005). Human adaptation for survival against flood in sabah floodplain areas: The past and the present. Paper presented at the 8th International Riversymposium, Brisbane, Australia.
[24] Ayog, J.L., Tongkul, F., Mirasa, A.K., Roslee, R., Dullah, S. (2017). Flood risk assessment on selected critical infrastructure in kota marudu town, Sabah, Malaysia. MATEC Web of Conferences, 103: 04019(1)-04019(9). http://dx.doi.org/10.1051/matecconf/201710304019
[25] Nicole, L.S.L, Bolong, N., Roslee, R., Tongkul, F., Mirasa, A.K., Ayog, J.L. (2018). Flood Vulnerability index for critical infrastructure towards flood risk management. ASM Sci. J., 11(3): 134-146.
[26] Zaitun, M.T., Nor Siah, J., Zurina, M. (2016). A review of flood disaster and disaster management in Malaysia. International Journal of Accounting & Business Management, 2(4): 98-106. http://dx.doi.org/10.24924/ijabm/2016.11/v4.iss2/98.106
[27] Zakaria, S.F., Zin, R.M., Mohamad, I., Balubaid, S., Mydin, S.H., MDR, E.R. (2017). The development of flood map in Malaysia. AIP Conference Proceedings, 1903: 110006. https://doi.org/10.1063/1.5011632
[28] Sahol, H.A.B., Wardah, T., Marfiah, A.W., Siti, R.M.N., Rohana, H., (Eds.) ISRAM (2014): Proceedings of the International Symposium on Flood Research and Management. Singapore: Springer, 1-16. https://doi.org/10.1007/978-981-287-365-1
[29] Ferguson, R.I. (2005). Estimating critical stream power for bedload transport calculations in gravel-bed rivers. Geomorphology, 70(1-2): 33-41. https://doi.org/10.1016/j.geomorph.2005.03.009