Ni Made Puspawati* | Sri Wahjuni | Ni Kadek Inda Kusmaning Ayu | Ahmad Fudholi
© 2021 IIETA. This article is published by IIETA and is licensed under the CC BY 4.0 license (http://creativecommons.org/licenses/by/4.0/).
OPEN ACCESS
Chicken skin is a source of animal protein hydrolysate, which has a potential as an antioxidant. This study aimed to determine the effect of different concentrations of the enzyme papain on the degree of hydrolysis, antioxidant capacity, percentage of reducing power (%RP) and amino acid composition of chicken skin protein hydrolysate. Hydrolysis was carried out using papain with various concentrations (3%, 4% and 5%, w/w protein substrate) at pH 7 and 50℃ for 6 h. The degree of hydrolysis was determined by spectrophotometry. Antioxidant capacity and %RP was determined by ferric reducing antioxidant power method and expressed in milligram of ascorbic acid equivalent per gram of sample, and amino acid composition were determined using high-performance liquid chromatography. The results showed that variations in papain concentration had a significant effect (P<0.05) on the degree of hydrolysis, antioxidant capacity and %RP of chicken skin hydrolysate. The papain concentration of 4% resulted in the optimum protein hydrolysate with a degree of hydrolysis of 61.68%±0.64%, an antioxidant capacity of 8.72±0.30 mg AAE/g sample and a %RP of 54.12%±1.78%. The protein hydrolysates of the treated chicken skin showed a high content of amino acids, namely, glycine, glutamic acid, proline, arginine, alanine, and aspartic acid.
antioxidant, amino acid, FRAP, protein hydrolysate, chicken skin
Oxidation reactions by free radicals are one of the main causes of pathogenesis and diseases in humans, such as cell damage, which plays a role in the ageing process, Alzheimer's disease, inflammation and cancer. The normal state of cellular health is maintained through a balance between endogenous antioxidants and oxidants. However, this balance can be disrupted by factors, such as age, environmental conditions and genetic susceptibility [1]. Human need uptake of natural dietary antioxidants such as vitamin C, E, polyphenol, a carotenoid which have been well-known, and also dietary natural antioxidant peptides derived from food protein hydrolysis [2]. Recent studies have shown that peptides with antioxidant properties can be released from food sources such as milk, whey protein, soy protein, egg, meat/fish [3-5], and meat/fish processing waste such as bone, skin, blood, eye, head, and liver by process hydrolysis [6-9]. Therefore natural antioxidant peptides derived from protein hydrolysis are now being studied as novel sources of potential dietary ingredients to promote human health.
Peptides with functional properties can be produced by enzymatic hydrolysis using protease enzymes, and this method is more effective compared with chemical methods, such as the use acids and bases. Papain is a protease enzyme that is commonly used for protein hydrolysis, such as the production of protein hydrolysate from the bones and heads of catfish [10], tuna fish eyes [7], chicken claws [8], white snapper offal [11] and chicken liver protein hydrolysate [9]. Current explorations on bioactive peptides are carried out on the by-products of fish processing, such as skin, eyes and fish bones, and poultry processing, such as claws, liver, bones, skin and other parts that are rich in protein [4, 5, 8].
Chicken skin is one of the waste from processing chicken meat that has not been further process into added-value products. Locally, chicken skin is consumed as fry crackers which are considered a high-fat food though effort has been done to utilize chicken skin as an alternative source of halal gelatin [12]. Several convenient chicken skin-based food products are currently being developed to meet the increasing demand, reduced cost, and protect the environment against waste and pollution. However, research on the development of chicken-based food with functional and health-promoting values is still unexplored [13]. Chicken skin with high protein content is a good source for protein hydrolysates. It has been reported that protein hydrolysates obtained from enzymatic hydrolysis of chicken skin using Alcalase and Gastrointestinal enzymes exhibited antioxidant and anti-hypertensive activity [14, 15]. The properties of peptides in the protein hydrolysates depend on the nature of the substrate, the enzyme used for hydrolysis, and the process of hydrolysis.
The antioxidant activity of protein hydrolysates is influenced by the degree of hydrolysis and amino acid composition. The degree of hydrolysis is an indicator of the success of the hydrolysis process and is influenced by the characteristics of the substrate, the type and concentration of enzymes, hydrolysis time, temperature and pH [16-18]. Epi et al. [9] reported that the optimum enzyme concentration of chicken liver protein hydrolysate is 6% with a degree of hydrolysis of 68.28% and an antioxidant activity of 876.913 ppm. According to He et al. [19], the hydrophobic properties and electron transfer ability of aspartate and glutamate are able to provide antioxidant properties.
The measurement of antioxidant capacity by spectrophotometric methods has been developed, but none is ideal. According to Niken [20], the measurement of antioxidant capacity using cupric reducing antioxidant capacity, and ferric reducing antioxidant power (FRAP) showed statistically different results. FRAP has advantages over other methods because FRAP reagents are easy to prepare, and the process is quite simple and can determine the ability of antioxidant compounds to reduce Fe3+ ions to Fe2+ complexes [21]. Based on the above background, this study was conducted to determine the amino acid composition and the effect of enzyme (papain) concentration on the degree of hydrolysis, antioxidant capacity and the percentage of reducing power (%RP) of chicken skin protein hydrolysate produced through enzymatic hydrolysis using the FRAP method.
The chicken skins used were purchased randomly at the Ciomas Adisatwa Chicken Slaughterhouse, Tabanan Regency, Bali. The other materials used include n-hexane, aquades, NaOH, K2SO4, MgO, H2SO4, H3BO3, 0.2% methyl red, 0.2% methylene blue,, 95% alcohol, ninhydrin, leucine, papain (activity, 100000 U/g), aluminium foil, HCl, acetonitrile, 0.2 M phosphate buffer, K2HPO4, KH2PO4, 1% K3Fe(CN)6, 0.1% FeCl3, 10% trichloroacetic acid (TCA), ascorbic acid and demineralised aqua.
The equipment used include beakers, measuring cups, analytical scale (Kern Alj), cutters, freeze dryer (Labconco), blenders, Soxhlet apparatus, oven (Memmert), thermostat magnetic stirrer (DF-101S), vortex mixer (Labnet), dark glass bottles, volume pipettes, volumetric flasks, stirrers, dropper pipette, hot plate (MS 79-1), centrifuge (Kubota), centrifuge tube, pH metre (Activon Model 209 pH/mV metre), Kjeldahl flask, UV–Vis spectrophotometer (Shimadzhu UV-1800) and high-performance liquid chromatograph.
Chicken skins were cleaned with water, cut into small pieces and dried in a freeze dryer for 2 days. The dried chicken skins were then blended. The chicken skin powder was extracted by Soxhlet extraction using n-hexane solvent for 6 h to remove the fat. The chicken skin residue was then heated in an oven at 40 °C for 4 h to remove any residual solvent.
The protein contents of the fat-free chicken skin samples were determined using the Kjeldahl digestion method. A 0.2 g sample was placed into a kjeldahl flask and added with 1.9 g K2SO4, 40 mg MgO and 2.5 mL H2SO4. The solution was boiled until clear. The clear solution was transferred to a distillation device. The kjeldahl flask was washed with 2 mL of water, and the washing water was placed into a distillation device and added with 8 mL of 40% NaOH solution. An Erlenmeyer flask with 5 mL of H3BO3 solution and 2–4 drops of the indicator (a mixture of 2 parts 0.2% methyl red and 1 part 0.2% methylene blue in alcohol) was placed in the condenser. The contents of the Erlenmeyer flask were diluted to 50 mL and titrated with 0.02 N HCl until the colour changed to grey. The same process was carried out for blanks. Total nitrogen was determined using Eq. (1):
$N(\%)=\frac{(\text { sample }-\mathrm{HCl} \text { blanko }) \mathrm{ml} \times \mathrm{N} \mathrm{HCl} \times 14,007 \times 100 \%}{\text { weight of sample }(\mathrm{mg})}$ (1)
2.1 Hydrolysis of chicken skin protein with papain
The materials used in this study were gambier granules. Ten grams of fat-free chicken skin powder was mixed with distilled water to obtain 5% w/v of the total protein. The condition of the mixture of chicken skin powder with distilled water was adjusted to the active conditions of the papain: pH 7 (pH adjusted using 2 M NaOH) and a temperature of 50℃. The pre-hydrolysis process was carried out using a thermostat magnetic stirrer at a speed of 4.5 m/s for 20 min. Different of papain concentrations (3%, 4% and 5% w/w protein substrate) were added at the same quantity in each treatment. The hydrolysis process was carried out using a thermostat stirrer with a speed of 4.5 m/s at 50℃ and pH 7 for 6 h after incubation, and the reaction was stopped by heating at 90℃ for 15 min. The hydrolysed protein was centrifuged, and the supernatant was collected and stored in a dark glass bottle at −15℃. The protein hydrolysate was dried using a freeze dryer.
2.2 Determination of degree of hydrolysis
The standard solution of leucine (5 mg/mL) was prepared in various concentrations (1, 2, 3 and 4 mg/mL). Then, 0.6 mL of 0.35% ninhydrin was added to 3 mL of each standard leucine solution. Two millilitres of the protein hydrolysate sample to be tested and 2 mL of blank solution were separately added with 0.4 mL of ninhydrin and heated at 85℃ for 5 min. The absorbance of the standard solution and protein hydrolysate samples were read at a wavelength of 570 nm using the UV–Vis spectrophotometer. A calibration curve was made by plotting the absorbance value versus the standard amino acid concentration. The degree of hydrolysis can be calculated using Eq. (2):
$D H=\frac{h}{h \text { total }} \times 100 \%$ (2)
where, h is the total number of peptide bonds (obtained from reconstitution of protein samples (w/v). h is the number of amino groups released (determined by plugging the absorbance of the sample into the equation obtained on the standard curve).
2.3 Measurement of antioxidant capacity using the FRAP method
The measurement of antioxidant capacity using the FRAP method was based on the steps of Vijayalakshmi and Ruckmani [22] with modification. The following processes were used to manufacture the reagents: (i) phosphate buffer solution (0.2 M, pH 6.6): 2.7216 g KH2PO4 and 3.4834 g K2HPO4 were dissolved with demineralised aqua to 100 mL in a volumetric flask, then 64.52 mL of 0.2 M KH2PO4 solution and 35.48 mL of 0.2 M K2HPO4 solution were collected, and the pH of the solution was adjusted to 6.6 by measuring with a pH metre; (ii) 1% potassium ferricyanide (K3Fe[CN]6) solution: 1 g K3Fe(CN)6 was weighed and dissolved with demineralised aqua to 100 mL in a volumetric flask; (iii) 0.1% ferric chloride (FeCl3) solution: 0.1 g FeCl3 was weighed and dissolved with demineralised aqua to 100 mL in a volumetric flask; (iv) 10% TCA solution: 10 g TCA was weighed and dissolved with demineralised aqua to 100 mL in a volumetric flask.
A standard solution of ascorbic acid was prepared by dissolving 10 mg ascorbic acid with demineralised aqua to 10 mL in a volumetric flask to obtain a concentration of 1000 ppm. Then, 50, 500, 1250 and 2500 μL of the stock solution were collected using pipettes and dissolved with demineralised aqua to 5 mL in volumetric flasks to obtain the concentrations of 10, 100, 250 and 500 ppm. Two millilitres of each solution with various concentrations were collected using a pipette, then added with 2 mL of phosphate buffer (0.2 M, pH 6.6) and 2 mL of 1% K3Fe(CN)6 and mixed in a vortex mixer. Subsequently, the solutions were incubated for 20 min at 50°C, then added with 2 mL of 10% TCA solution and centrifuged at a rate of 9 m/s for 10 min. Two millilitres of the top solution were pipetted and added with 2 mL of demineralised aqua and 0.4 mL of 0.1% FeCl3. Finally, the absorbance was measured, and the linear regression equation was determined.
Sample solutions were prepared by dissolving 50 mg of each sample with demineralised aqua to 5 mL in a volumetric flask to obtain a stock concentration of 10000 ppm. Different volumes of the stock solution (250, 500, 1000 and 2000 μL) were pipetted and dissolved with demineralised aqua to 5 mL in a volumetric flask to obtain the concentrations of 250, 500, 1000 and 2000 ppm, respectively. Two millilitres of each sample were added with 2 mL of phosphate buffer 0.2 M (pH 6.6) and 2 mL of 1% K3Fe(CN)6 and then vortexed. Subsequently, the solutions were incubated for 20 min at 50°C, then added with 2 mL of 10% TCA solution and centrifuged at a rate of 9 m/s for 10 min. Two millilitres of the top solution were pipetted added with 2 mL of demineralised aqua and 0.4 mL of 0.1% FeCl3. Finally, the absorbance of the sample solutions was measured at 700 nm.
2.4 Determination of antioxidant capacity
Antioxidant capacity is expressed as the weight equivalent to ascorbic acid per gram of protein hydrolysate and determined by Eq. (3) [23]:
$\mathrm{AA}\left(\frac{m g A A}{g}\right)=\frac{V(m L) \times F p \times C \times 10^{-3}}{g \text { sample }}$ (3)
where, AA is the ascorbic acid equivalent, V is the volume of the sample (mL), mgAA is the mass of ascorbic acid (mg), C is the sample concentration (mg/L), Fp is the dilution factor, and g is weight of the sample used (g). C can be calculated from the standard linear regression equation for ascorbic acid as shown in Eq. (4):
$y=b x+a$ (4)
where, y is the absorbance of the sample, b is the regression coefficient or slope, a is the intercept, r is the correlation coefficient, x is the value of the sample's antioxidant concentration or content.
2.5 Determination of %RP
%RP was determined by comparing the sample and the standard using Eq. (5):
$\% R P=\left[1-\left(1-\frac{A_{s}}{A_{c}}\right)\right] \times 100$ (5)
where, %RP is the reduction power of Fe3+ to Fe2+, As is absorbance of the sample [highest], and Ac is the highest standard absorbance
2.6 Amino acid composition analysis
The amino acid composition of the peptide fraction was analysed by hydrolysing the sample using 6 N HCl. The results of the hydrolysis were derivatised using the AccQ•Fluor Reagent Kit. Five millilitres of the derivatised sample were injected into the HPLC system (Alliance) using two mobile phases (buffer A and acetonitrile), an AccQ-Tag Waters column and a fluorescence detector. The HPLC measurement conditions are: temperature, 37°C; column length, 250–395 nm; mobile phase flow rate, 1.05 mL/min.
The measurement data were analysed using SPSS. One-way ANOVA was used to determine the significance of the effect of each variation in papain concentration on the degree of hydrolysis, antioxidant capacity and %RP of the hydrolysates. P<0.05 was considered a significant effect. Post hoc test (least significant difference) was further carried out to see the magnitude of the difference or effect in each variation.
The defatted chicken skin samples were analyzed to determine the chemical composition such as protein, moisture (water), fat, and ash before enzymatic hydrolysis. The result of the proximate analysis are shown in Table 1.
Table 1. Proximate composition of fat-free dry chicken skin
|
Parameter (%w/w) |
Value (%) |
|
Water |
13.16 |
|
Protein |
68.27 |
|
Fat |
5.10 |
|
Ash |
7.11 |
Table 1 shows the moisture and ash content of defatted chicken skin samples was 13.16% and 7.11% respectively, higher than reported by Puspawati [24], 7.84% and 2.56%, and Onuh [15] which were 5.84 and 4.06% for thigh skin 6.64 and 2.43 for breast skin). The fat content was 5.10%, lower than of 6.45% [24], 25.84% and 25.71% for thigh skin, and 29.21 % for breast skin [15]. This result indicating that the fat content of chicken skin sample in this experiment has been reduced effectively.
The protein content of the defatted chicken skin sample was 68.27% which is considered high, though lower than the protein content of defatted chicken skin samples reported by Puspawati et al. [24] (75.48%) but comparable to the protein content of the defatted chicken skin sample reported by Onuh [15] which was 68.84% for chicken thigh and 65.05% for breast skin. The difference in the chemical composition of the defatted chicken skin sample is may due to the age difference, the fed of the chicken or cultivar, and the methods used for the preparation of the samples. The high protein content of the sample is a good source of protein for producing protein hydrolysates.
Indicators of the occurrence of hydrolysis and results are described by general parameters, such as the degree of hydrolysis. The degree of hydrolysis indicates the percentage of peptide bonds released in the form of dissolved proteins or amino acids. The degree of hydrolysis is influenced by the characteristics of the substrate, the type and concentration of enzymes, pH, temperature and time used in the hydrolysis process. The hydrolysis degree of chicken skin protein was determined using a spectrophotometric method. The samples were reacted with ninhydrin before the analysis. The qualitative test results of the samples with ninhydrin show a purple colour with a strong intensity, which indicates the presence of amino acids in the samples.
Ninhydrin causes the oxidative decarboxylation of α-amino acids to give CO2, NH3 and aldehydes. Reduced ninhydrin (hydrindantin) reacts with NH3 and ninhydrin to form complex blue-purple compounds [25]. The difference in amino acid levels in the protein hydrolysate sample at 3%, 4% and 5% papain concentrations (w/w protein substrate) was determined by spectrophotometery UV-Vis at a wavelength of 570 nm. The degrees of hydrolysis determined by the spectrophotometric method using the leucine standard are shown in Table 2.
Table 2. Degree of hydrolysis of chicken skin protein hydrolysis
|
Enzyme concentration (% w/w) |
Hydrolysis Degree (%) |
|
3 |
42.70 ± 2.83a |
|
4 |
6168 ± 0.64b |
|
5 |
73.43 ± 1.95c |
The degree of hydrolysis increased with the increase in papain concentration, because the high concentration of the enzyme on the substrate can increase the speed of the hydrolysis reaction hence more peptide bond cleaved result in the increased production of dissolved protein. Epi et al. [9] produced a similar degree of hydrolysis (68.82%) in chicken liver protein hydrolysate. Ratih [26] reported that the hydrolysis of the same substrate with the same enzyme and enzyme concentration results in different degrees of hydrolysis because of differences in the protein content and type of the substrate, the activity of the enzymes used and the presence of inhibitors that inhibit the reaction between the enzyme and the substrate.
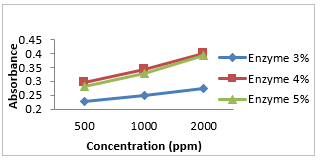
The antioxidant capacity of chicken skin protein hydrolysate at various papain concentrations (3%, 4% and 5% w/w protein substrate) was determined by the FRAP method using ascorbic acid standards, because various free radicals can be suppressed by ascorbic acid. The FRAP method can determine the ability of the sample to reduce Fe3+ to Fe2+. Increasing the sample concentration can increase the absorbance, as well as antioxidant capacity and reduction power, but the increase is not constant because of differences in the antioxidant content of the sample. The curves of the concentration variation with the absorbance of the protein hydrolysate samples at the enzyme concentrations of 3%, 4% and 5% (w/w protein substrate) are shown in Figure 1.
The concentration and absorbance curves of the protein hydrolysate samples show that the absorbance increases with increasing sample concentration and enzyme concentration. The highest absorbance value was obtained in the samples hydrolysed with 4% papain (w/w protein substrate). The antioxidant capacity of chicken skin protein hydrolysate at a sample concentration of 2000 ppm is presented in Table 3.
Based on Table 3, the antioxidant capacity of the sample is expressed as mg AA/ g of sample, which means that the amount of ascorbic acid that is equivalent to the mass of the sample in reducing Fe3+ to Fe2+. The %RP of Fe3+ to Fe2+ by the protein hydrolysate samples at various enzyme concentrations was obtained by comparing the absorbance at the highest concentration of the sample and that of ascorbic acid. %RP is shown in Table 4.
Figure 1. Graph of absorbance versus concentration
Table 3. Antioxidant capacity of chicken skin protein hydrolysate
|
Protein hydrolyzate |
Antioxidant capacity (mg AAE/g sample) |
|
Enzyme concentration 3% w/w |
5.82 ± 0.27a |
|
Enzyme concentration 4% w/w |
8.72 ± 0.30b |
|
Enzyme concentration 5% w/w |
8.52 ± 0.15b |
Note: Numbers accompanied by different letters indicate a significantly different value at 5% level.
Table 4. %RP of chicken skin protein hydrolysate samples
|
Protein hydrolyzate |
Percentage reduction power (%) |
|
Enzyme concentration 3% w/w |
36.96 ± 1.58a |
|
Enzyme concentration 4% w/w |
54.12 ± 1.78b |
|
Enzyme concentration 5% w/w |
52.88 ± 0.89b |
Note: Numbers accompanied by different letters indicate a significantly different value at 5% level.
The results of the antioxidant capacity and %RP of the protein hydrolysate samples at different papain concentrations (3%, 4% and 5% w/w protein substrate) showed the highest antioxidant capacity and %RP at 4% enzyme concentration. Different papain concentrations resulted in different antioxidant capacity and %RP, which were influenced not only by the degree of hydrolysis produced but also the amino acid composition. Antioxidant capacity and %RP decreased at 5% enzyme concentration (w/w protein substrate), but the decrease was not substantial. This may because of the dissolved peptides or amino acids formed from hydrolysis did not donate many electrons. The optimum concentration of papain in producing the highest capacity and %RP was 4%. Research on catfish protein hydrolysate by Baehaki [27] reported the same results, that is, antioxidant activity initially increases along with the increase in enzyme concentration and decreases after the optimum enzyme concentration is reached even when the degree of hydrolysis is increased. Barlett and Levine [28] stated that the degree of hydrolysis, amino acid composition and sequence, peptide size and solubility will affect antioxidant capacity and %RP. Besides, the FRAP method is sensitive to pH and incubation time; accurate results will only be generated on samples that have thermodynamic reaction conditions and a fairly fast reaction rate [28].
Amino acid composition has a major effect on the bioactivity of protein hydrolysates [19]. This study only analysed 15 amino acids, namely Gly, Glu, Pro, Arg, Ala, Asp, Leu, Lys, Ser, Val, Thr, Phe, Ile, Tyr, And His, using the HPLC method. The results are presented in Table 5. The amino acid composition of the protein and peptides has a great influence on functionality. Due to some limitations, in this stage of the research, three amino acids i.e methionine, cysteine, and tryptophan have not been analyzed. The amino acid composition of protein hydrolysates produced using 3, 4, and 5% of papain showed a similar profile which is rich in hydrophobic amino acids residue and poor in tyrosine and histidine residue as summarised in Table 3.
Table 5. Amino acid composition of chicken skin protein hydrolysate
|
Amino acid |
Level (%) |
|||
|
3% |
4% |
5% |
(-) |
|
|
Gly |
16.02 |
15.37 |
14.98 |
13.26 |
|
Glu |
9.85 |
10.33 |
10.29 |
9.49 |
|
Pro |
9.12 |
8.79 |
8.59 |
7.79 |
|
Arg |
6.74 |
6.88 |
6.67 |
6.25 |
|
Ala |
6.73 |
6.65 |
6.57 |
6.11 |
|
Asp |
5.13 |
5.65 |
5.59 |
5.46 |
|
Leu |
4.13 |
4.45 |
4.21 |
4.54 |
|
Lys |
4.18 |
4.31 |
4.25 |
4.27 |
|
Ser |
3.18 |
3.29 |
3.18 |
3.02 |
|
Val |
2.84 |
3.04 |
2.91 |
3.24 |
|
Thr |
2.74 |
2.93 |
2.82 |
2.74 |
|
Phe |
2.31 |
2.63 |
2.47 |
2.70 |
|
Ile |
2.07 |
2.29 |
2.16 |
2.37 |
|
Tyr |
1.30 |
1.53 |
1.45 |
1.58 |
|
His |
1.23 |
1.35 |
1.31 |
1.28 |
|
HAA |
44.52 |
44.75 |
43.34 |
41.59 |
|
EAA |
19.5 |
21 |
20.13 |
21.14 |
|
NCAA |
14.98 |
15.98 |
15.88 |
14.95 |
|
PCAA |
12.15 |
12.54 |
12.23 |
11.8 |
|
AAA |
3.61 |
4.16 |
3.92 |
4.28 |
Note: HAA (hydrophobic amino acids: Ala, Val, Ile, Leu, Tyr, Phe, Pro, Gly); EAA (essential amino acids: Phe, Val, Thr, Ile, Leu, Lys, His); NCAA (negatively charged amino acids: Glu, Asp); PCAA (positively charged amino acids: Arg, His, Lys); AAA (aromatic amino acids: Phe, Tyr).
The protein hydrolysates obtained using 4% of papain enzyme contained higher negatively charged amino acids Asp and Glu, positively charged His, Lys, and Arg, polar amino acid Ser, and aromatic amino acid Tyr and Phe compared to protein hydrolysates using 5% and 3% except for Gly, Pro, and Ala. The Gly, Pro and Ala which are proton donors were found higher in the protein hydrolysates produced using 3% papain than in the protein hydrolysates using 4% and 5% papain. A compound that belongs to an electron donor group have the capability as reducing power which can reduce the intermediated oxidative species in lipid oxidation process. The protein hydrolysates obtained using 4% of papain revealed the highest antioxidant capacity and reducing power which may be due to the highest content of Glu and Asp residue which can donate their excess of the electron to reduce Fe3+/ferricyanide complex to the ferrous form [5, 19, 29]. In addition to that, a relatively higher amount of aromatic amino acid, Phe, Tyr, and His which are an electron donor that can react with free radicals, thus terminating the free radical chain reaction also contributed to the higher antioxidant capacity and reducing power of the protein hydrolysates [30]. Carrasco-Castilla et al. [31] also reported that lower reducing power activity of Phaseolin and Bean protein hydrolysates after fractionation due to low amount of Tyr, Cys, His, Met, Lys, and Trp residue.
Tjay et al. [32] and Lagowski [33] states that Ser and Lys contain O and N atoms, which have lone pairs and can form complexes with Fe to reduce Fe3+ to Fe2+. The unremarkable difference in amino acid levels between the protein hydrolysate sample and the negative control indicated that the dry, fat-free chicken skin that was not hydrolysed contained high levels of amino acids and has a potential as an antioxidant.
Different papain concentrations (3%, 4% and 5% w/w protein substrate) had different effects (P<0.05) on the degree of hydrolysis, antioxidant capacity and %RP, but antioxidant capacity and %RP between 4% and 5% papain concentrations were not significantly different (P>0.05). The papain concentration of 4% produced optimum protein hydrolysate with a degree of hydrolysis of 61.68%±0.64%, an antioxidant capacity of 8.72±0.30 mg AA/g sample and a %RP of 54.12%±1.78%. The protein hydrolysates of the treated chicken skin showed a high content of amino acids, namely, glycine, glutamic acid, proline, arginine, alanine, and aspartic acid.
This work was funded by Udayana University through Udayana Flagship Research Grant, year 2021.
[1] Shinde, A., Ganu, J., Naik, P. (2012). Effect of free radicals and antioxidant on oxidative stress: A review. Journal of Dental and Allied Sciences, 1(2): 63-66. http://dx.doi.org/10.4103/2277-4696.159144
[2] Erdmann, K., Cheung, B.W.Y., Scroder, H. (2008). The possible roles of food-derived bioactive peptides in reducing the risk of cardiovascular disease. Journal of Nutritional Biochemistry, 19(10): 643-654. https://doi.org/10.1016/j.jnutbio.2007.11.010
[3] Bernardini, R., Harnedy, P., Bolton, D., Kerry, J., O'Neill, E., Mullen, A.M., Hayes, M. (2011). Antioxidant and antimicrobial peptidic hydrolysates from muscle protein sources and by-products. Food Chemistry, 124(4): 1296-1307. https://doi.org/10.1016/j.foodchem.2010.07.004
[4] Jamdar, S.N., Rajalaksmi, V., Sarma, A. (2012). Antioxidant and ACE inhibitory properties of poultry viscera protein and its peptide fraction. Journal of Food Biochemistry, 36(4): 494-501. https://doi.org/10.1111/j.1745-4514.2011.00562.x
[5] Naqash, S.Y., Nazeer, R.A. (2011). Evaluation of bioactive peptides isolated from Exocoetusvolitans backbone. International of Food Sciences and Technology, 46: 37-43. https://doi.org/10.1111/j.1365-2621.2010.02443.x
[6] Elavarasan, K., Naveen Kumar, V., Shamasundar, B.A. (2014). Antioxidant and functional properties of fish protein hydrolysates from freshwater carp as influenced by the nature of enzyme. Journal Food Process Press, 45(8): 90-144. https://doi.org/10.1111/jfpp.12081
[7] Mutamimah, D., Ibrahim, B., Trilaksani, W. (2018). Antioxidant activity of protein hydrolyzate produced from tuna eye (Thunnus sp.) by enzymatic hydrolysis. Jurnal Pengolahan Hasil Perikanan Indonesia, 21(3): 522-531. https://doi.org/10.17844/jphpi.v21i3.24736
[8] Susanto, E., Rosyidi, D., dan Radiati, L.E. (2018). Optimasi Aktivitas Antioksidan Peptida Aktif dari Ceker Ayam Melalui Hidrolisis Enzim Papain. Jurnal Ilmu dan Teknologi Hasil Ternak, 13(1): 14-26. https://doi.org/10.21776/ub.jitek.2018.013.01.2
[9] Epi, S.W., Dedi, N., Hilda, A. (2019). Pembuatan hidrolisat protein hati ayam pedaging (Broiler) dan uji aktivitas antioksidannya. Scientia J. Far. Kes., 9(1): 101-108. http://dx.doi.org/10.36434/scientia.v9i1.195
[10] Nurilmala, M., Nurhayati, T., Roskananda, R. (2018). Limbah industri filet ikan patin untuk hidrolisat protein. Jurnal Pengolahan Hasil Perikanan Indonesia, 21(2): 287-294. https://doi.org/10.17844/jphpi.v21i2.23083
[11] Nurhayati, T., Salamah, E., Cholifah, Nugraha, R. (2014). optimasi proses pembuatan hidrolisat jeroan ikan kakap putih. Jurnal Pengolahan Hasil Perikanan Indonesia, 7(1). https://doi.org/10.17844/jphpi.v17i1.8136
[12] Puspawati, N.M., Widihati, I.A.G., dan Widana, I.N. (2017). Komposisi asam amino dan pola pita protein gelatin halal dari kulit ayam boiler. Jurnal Kimia, 11(1): 36-42. https://doi.org/10.24843/JCHEM.2017.v11.i01.p06
[13] Bhat, Z.F., Kumar, P., Kumar, S. (2013). Effect of skin, enrobing and refrigerated storage on the quality characteristics of chicken meat balls. Journal of Food Science and Technology-Mysore, 50(5): 890-899. http://dx.doi.org/10.1007/s13197-011-0414-0
[14] Cliché, S., Amiot, J., Avezard, C., Gariepy, C. (2003). Extraction and characterisation of collagen with or without telopeptide from chicken skin. Poultry Sciences, 82(3): 503-509. https://doi.org/10.1093/ps/82.3.503
[15] Onuh, J.O. (2015). Antihypertensive and antioxidant properties of chicken skin protein hydrolysates: In vitro, in vivo, and metabolomics studies. Thesis. University of Manitoba. http://hdl.handle.net/1993/30628
[16] Jamil, N.H., Halim, N.R.A., Sarbon, N.M. (2016). Optimaztion of enzymatic hydrolysis condition and functional properties of eel (Monopterus sp.) protein using response surface methodology (RSM). International Food Research Journal, 23(1): 1-9.
[17] Kurniawan, K., Lestari, S., Sitihanggita, R.J. (2012). Hidrolisis protein tinta cumi- cumi (Loligo sp) dengan enzim papain. Jurnal Teknologi Hasil Perikanan Universitas Sriwijaya, 1(1). https://doi.org/10.36706/fishtech.v1i1.796
[18] Maghfiroh, N. (2016). Peptida antioksidatif dari hidroliat protein ikan kayu. Skripsi. Fakultas Perikanan dan Ilmu Kelautan Institut Pertanian Bogor. Bogor. http://repository.ipb.ac.id/handle/123456789/83221
[19] He, R., Girgih, A.T., Malomo, S.A., Ju, X.R., and Aluko, R.E. (2013). Antioxidant activities of enzymatic rapeseed protein hydrolysates and the membrane ultrafiltration fractions. Journal of Functional Foods, 5(1): 219-227. https://doi.org/10.1016/j.jff.2012.10.008
[20] Niken, W. (2010). Pengukuran Aktivitas Antioksidan dengan Metode CUPRAC, DPPHH, FRAP serta kolerasinya dengan Fenol dan Flavonoid pada Enam Tanaman. Skripsi. Fakultas MIPA IPB. Bogor. http://repository.ipb.ac.id/handle/123456789/26745
[21] Magfira. (2018). Analisis Penghambatan Ekstrak Etanol Batang Kembang Bulan (tithonia diversifolia) Terhadap Reaksi Oksidasi dari Radikal Bebas dengan Metode DPPH, ABTS dan FRAP. Skripsi. Program studi farmasi Fakultas farmasi Universitas hasanuddin. Makassar.
[22] Vijayalakshmi, M., Ruckmani, K. (2016). Ferric educing antioxidant power assay in plant extract. Journal of Pharmacology, 11(3): 570-572. https://doi.org/10.3329/bjp.v11i3.27663
[23] Gashahun, G.S., Solomon, L.B. (2019). Antioxidant activities of avocado (persea Americana Mill) and banana (Musa Paradisiac L.) varieties. Anatomy Physiology & Biochemistry International Journal, 6(1): 2476-1400.
[24] Puspawati, N.M., Dewi, P.P., Bogoriani, N.W., Ariati, N.K. (2020). Produksi hidrolisat protein antioksidan melalui hidrolisis enzimatik protein kulit ayam broiler dengan enzim papain. Jurnal Kimia. 14(2). https://doi.org/10.24843/JCHEM.2020.v14.i02.p16
[25] Perret, D., Nayuni, N.K. (2014). Efficacy of current and novel cleaning technologies (Proreveal) for assessing protein contamination on surgical instruments. Journal of Med., 23: 598-619. http://dx.doi.org/10.1016/B978-0-08-102565-9.00021-2
[26] Ratih, R. (2016). Hidrolisis secara enzimatis protein bungkil biji nyamplung (calophyllum inophyllum) menggunakan bromelain. Journal Biota, 1(3): 103-110. https://doi.org/10.24002/biota.v1i3.1226
[27] Baehaki, A., Lestari, S.D., Romadhoni, A.R. (2015). Hidrolisis protein ikan patin menggunakan enzim papain dan aktivitas antioksidan hidrolisatnya. Jurnal Pengolahan Hasil Perikanan Indonesia, 18(3): 230-239. https://doi.org/10.17844/jphpi.2015.18.3
[28] Barlett, B.S., Levine, R.L. (2014). Antioxidant Peptides, Redox Report: Communications in Free Radical. https://doi.org/10.1179/1351000213Y.0000078
[29] Samaranayaka, A.G.P., Li-Chan, E.C.Y. (2011). Food-derived peptidic antioxidants: A review of their production, assessment, and potential applications. Journal of Functional Foods, 3(4): 229-254. https://doi.org/10.1016/j.jff.2011.05.006
[30] Najafian, L, Babji, A.S. (2014). Production of bioactives peptides using enzymatic hydrolysis and identification antioxidative peptides from patin (pangasius sutchi) sarcoplasmic protein hyrolysate. Journal of Functional Foods, 9: 280-289. https://doi.org/10.1016/j.jff.2014.05.003
[31] Carrasco-Castilla, J., Hernandez-Alvarez, A.J., Jimenez-Martinez, C., Jacinto-Hernandez, C., Alaiz, M., Giron-Calle, J., Vioque, J., Davila-Ortiz, G. (2012). Antioxidant and metal chelating activities of peptide fractions from phaseolin and bean protein hydrolysates. Food Chem., 135(3): 1789-95. https://doi.org/10.1016/j.foodchem.2012.06.016
[32] Tjay, T.H., Rahardja. (2002). Obat-obat penting, Khasiat, Penggunaan dan Efek-efek Samping. Edisi ke-5.PT.. Gramedia. Jakarta.
[33] Lagowski, J.J. (1997). Macmillan Encyclopedia of Chemistry. Ed 1. Simon & Schuster and Prentice Hall International. New York.