Riyadh Jasim Mohammed Al-Saadi | Abdul Khider Aziz Mutasher* | Aysar Tuama Al-Awadi
© 2021 IIETA. This article is published by IIETA and is licensed under the CC BY 4.0 license (http://creativecommons.org/licenses/by/4.0/).
OPEN ACCESS
The common tool to evaluate the groundwater quality is so-called the Irrigation Water Quality Index (IWQI). In the present study, the IWQI model developed by Meireles is used to assess the quality of groundwater in Karbala - Najaf plateau, Iraq. The quality parameters that collected from groundwater tests of 78 wells in the study area are; EC, Na+1, Mg+2, Ca+2, Cl-1, and HCO3-1. The SPSS software program is employed to develop a non-linear regression model of the IWQI for the study area. The results show that the IWQI values for 90% of groundwater wells fall within the Severe Restriction (SR) category, which means that it’s only suitable for irrigation of high salt tolerance crops. While its remaining 10% of the wells are in the High Restriction (HR) category, and this means it is suitable for irrigation of moderate to high salt tolerance crops. The calibration and validation for the developed model presented that this model has a good estimation of the IWQI values. Due to flexible and unbiased, the current study recommends to use the proposed model to estimate the IWQI.
irrigation water quality index, groundwater, quality parameters, non-linear regression
Water quality plays an important role in the general health of human life and the quality of agricultural production. That is why there are a great interesting in finding ways and tools to improve water quality and make it suitable for drinking and irrigation. In general, most of the water resources are exposed to pollution resulting from the various bad use of civic, agricultural, and industrial activities. Groundwater is one of the important water sources that are most exposed to pollution as a result of these activities. Therefore, determination and investigation of the groundwater quality are continuously conducted in many regions in the world for different purposes [1]. The quality of groundwater can be affected by the geological actions and different types of activities induced by human, which result from industrial wastes, agricultural processes, municipal and residential activities [2]. The evaluation of groundwater quality requires conducting of continuous measurements and observation [3]. Assessment of the groundwater quality depends on its physical, chemical, and biological properties. The suitability of a groundwater for irrigation purposes is founded by the amount and kind of salts that the groundwater contains [4].
The most common tool for assessing groundwater and surface water quality is so-called Water Quality Index (WQI), which has been widely used in conducting many studies in this field. WQI is defined as a mathematical tool for expressing a variety of physical and chemical variables polluting water in the form of a single variable representing the assessment of water quality in a given area and time [5, 6]. For irrigation, the WQI is abbreviated as IWQI, which is calculated by different methods and models. One of the common models is called the Brazilian’s model developed by Meireles et al. [7]. This model is found to be suitable and efficient to evaluate the water quality for irrigation purposes by many researchers, e.g. [8-12]. The parameters that mainly required to determine the IWQI are concentration of salinity (Electrical Conductivity) (EC), Sodium Absorption Ratio (SAR), sodium (Na+1), chloride (Cl-1), and bicarbonate (HCO3-1).
Omran [13] derived a new weighted value of the parameters of Meireles model and used this model to assess the groundwater quality for irrigation purposes in the Darb El-Arbaein region, Southwestern Desert, Egypt. Omran’s results showed that most of the groundwater samples were unsuitable for irrigation. Al-Mohammed and Mutasher [14] conducted a study using a WQI techniques to evaluate the quality of groundwater for drinking purpose in Dibdiba aquifer, Kerbala city, Iraq. They found that the groundwater was unsuitable for drinking purposes for all studied wells. According to IWQI values; Siswoyo et al. [15] found that the quality of groundwater was between no restriction and moderate restriction for irrigation purposes in Jombang Regency, East Java, Indonesia. Gidey [16] developed an IWQI model based on parameters proposed by the University of California Committee of Consultants (UCCC) and the criteria established by Ayres and Westcott [17], with the same procedure that adopted by; Meireles et al. [7] and Omran et al. [18]. Gidey used his model to assess the groundwater quality in Elala catchment, Northern Ethiopia. The model results showed that the quality of groundwater included all the categories of classification with different percentages. Depending on Meireles model, Al-Kubaisi et al. [19] used a GIS technique to draw maps of the groundwater quality Index for irrigation in the Dibdibba aquifer at Karbala - Najaf plateau, central of Iraq. The spatial distribution of IWQI shown on these maps indicted that the groundwater quality in Dibdibba aquifer is generally within moderate category of quality. Nwankwoala & Amachree [20] used the weighted arithmetic index method adopted by Duckad et al. [21] for determination of WQI to evaluate the groundwater quality in contaminated areas in the Niger Delta. Their results for the Water Quality Index (WQI) ranged from 53.55 to 112.92, indicating that the quality of this water fell into the water quality categories; Poor; (WQI: 50-75), Very poor; (WQI: 75 -100), and Unsuitable; (WQI ˃100). Therefore, the quality of the groundwater was inappropriate for human consumption as a drinking water. This study recommended that treatment plants should be installed in the pumping system of groundwater before using for drinking and other purposes.
Al-Hadithi et al. [22] presented a study based on the complementarity of the Brazilian model developed by Meireles et al. [7] with ArcGIS technology in order to assess the appropriateness of groundwater quality for irrigation. The study was conducted to generate maps showing IWQI values for twelve groundwater wells at different locations in Baghdad, the capital of Iraq. The maps results showed that 25% of the groundwater wells can be classified within the low Restriction (LR) categories; IWQI: 70-85, this means that they are suitable for irrigation with low restrictions, and 46% of these wells are classified under the category of Moderate Restriction (MR) categories; IWQI: 55-70, which indicates that they are suitable to irrigate moderately salts tolerant plants, and can be used only in soils with a high permeability, requiring moderate leaching of salts. The map results also showed that 26% of the studied wells should be avoided and not used for irrigation under normal conditions because they fall within the Severe Restriction (SR) categories; IWQI: 0-40. The former type of water can be used to irrigate only highly salt tolerant plants and only if the soil permeability is high, and the excess of water is applied to avoid the accumulation of salt.
Al Maliki et al. [23] presented a study to assess the groundwater suitability for irrigation in an agricultural area. Their findings showed that the IWQI index together with GIS can prepared the final water quality maps using spatial distribution tools. These maps can help the decision makers in the assessment and management of groundwater quality. The results confirms that all groundwater samples over the study area are suitable for agriculture.
In the present study, the quality of groundwater was assessed for seventy-eight outlet wells in the Dibdaba Basin between Karbala and Najaf governorates in Iraq. The IWQI of Merieles’s model [7], was applied to assess the groundwater quality for irrigation purposes. A new non-linear regression model of IWQI was developed by using the SPSS software program depending on the results of the Merieles’s model. Moreover, this new model was verified by using other observed data. The novelty of this study is to find a new model that is easy to use and efficient in estimating the irrigation water quality index and predicting of the groundwater quality in the study area for future studies instead of other methods.
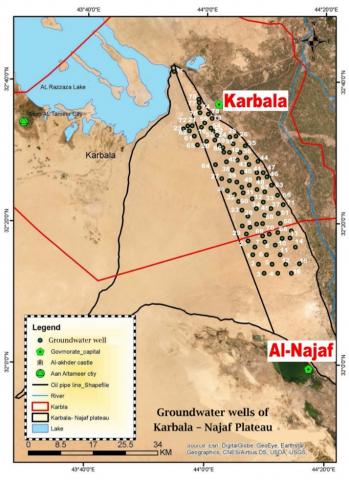
The study area is located within Dibdiba basin, which forms a part of the Karbala - Najaf plateau, south of Baghdad, the capital of Iraq. The area of Dibdiba Basin is about 2485 Km2 [24]. This area is extended between the latitudes 32° 18' and 32° 42', and between the longitude 43° 54' and 44° 15' as shown in Figure 1. The soil formation of Dibdiba generally consists of poorly graded sand with sand stone and gravel [25]. The study area has an arid to semi-arid climate with scarce rainfalls yearly [26]. In general, the trend of groundwater flow direction through Iraqi western desert including the study area is towards north to northeast [27, 28].
Figure 1. Geographical map for location of groundwater wells in the study area
3.1 Collected data
Data were collected for the physical and chemical parameters investigations of the water quality of seventy-eight wells as an annual average for the year 2018. Table 1 shows the geographical coordinates of these wells. Figure 1 shows the Google Earth map of wells location. All these wells are constructed in unconfined aquifer of the study area. The physical and chemical parameters are electrical conductivity (EC), sodium (Na+1), chloride (Cl-1), calcium (Ca+2), magnesium (Mg+2), and bicarbonate (HCO3-1). It should be noted that measurements were carried out in the Central Water Laboratory of the Karbala Agriculture Directorate, according to the standard specification adapted from American Public Health Association [29].
3.2 Determination of the irrigation water quality index (IWQI)
The IWQI was determined depending on the Meireles’s model [7], as follows:
(1) The collected parameters mentioned above were selected because they are the most effective variables in the water quality used for irrigation purposes.
(2) The quality measurement of the irrigation water, qi, for each parameter were computed by using Eq. (1) [7], based on the measured water quality data and the criteria of limits of tolerance shown in Table 2.
Table 1. Geographical coordinates of wells location in the study area
|
Well No. |
Latitude E |
Longitude N |
Well No. |
Latitude E |
Longitude N |
|
1 |
32° 19' 36.97" |
44° 6' 35.96" |
40 |
32° 28' 30.99" |
44° 4' 22" |
|
2 |
32° 19' 15" |
44° 6' 41.95" |
41 |
32° 27' 38.97" |
44° 3' 25" |
|
3 |
32° 18' 55.99" |
44° 7' 26.96" |
42 |
32° 29' 47.99" |
44° 4' 21.97" |
|
4 |
32° 18' 10.99" |
44° 7' 28.96" |
43 |
32° 30' 20.97" |
44° 5' 44.99" |
|
5 |
32° 18' 53.99" |
44° 7' 42.96" |
44 |
32° 31' 20.97" |
44° 6' 32.99" |
|
6 |
32° 19' 47.98" |
44° 7' 59.97" |
45 |
32° 28' 43.99" |
44° 6' 33.96" |
|
7 |
32° 19' 36.97" |
44° 8' 51.97" |
46 |
32° 28' 5.99" |
44° 7' 4.98" |
|
8 |
32° 19' 11" |
44° 9' 2.96" |
47 |
32° 28' 15.97" |
44° 7' 20.97" |
|
9 |
32° 19' 22.98" |
44° 9' 41.98" |
48 |
32° 29' 10.98" |
44° 5' 25.99" |
|
10 |
32° 20' 4.99" |
44° 9' 54.98" |
49 |
32° 27' 22.99" |
44° 9' 21.99" |
|
11 |
32° 18' 58.97" |
44° 10' 43.96" |
50 |
32° 21' 28.97" |
44° 12' 14.97" |
|
12 |
32° 18' 9.98" |
44° 10' 55.99" |
51 |
32° 21' 42" |
44° 11' 29.97" |
|
13 |
32° 19' 10.97" |
44° 11' 21.98" |
52 |
32° 25' 3.6" |
44° 2' 48.6" |
|
14 |
32° 19' 1" |
44° 12' 32.98" |
53 |
32° 33' 30.97" |
44° 0' 33.48" |
|
15 |
32° 18' 18.97" |
44° 12' 48.98" |
54 |
32° 34' 4.29" |
43° 59' 36.48" |
|
16 |
32° 18' 33.98" |
44° 13' 46.98" |
55 |
32° 34' 52.18" |
43° 58' 36.07" |
|
17 |
32° 40' 54.19" |
43° 54' 10.58" |
56 |
32° 30' 53.2" |
44° 3' 33.78" |
|
18 |
32° 34' 22.78" |
43° 58' 6.3" |
57 |
32° 31' 8.5" |
44° 3' 17.48" |
|
19 |
32° 34' 40.87" |
43° 57' 35.29" |
58 |
32° 29' 16.2" |
44° 3' 46.9" |
|
20 |
32° 34' 18.67" |
43° 57' 28.99" |
59 |
32° 33' 21.09" |
43° 58' 30.78" |
|
21 |
32° 34' 3.19" |
43° 57' 29.48" |
60 |
32° 34' 22.78" |
43° 58' 6.18" |
|
22 |
32° 24' 51.8" |
44° 4' 27.57" |
61 |
32° 33' 30.79" |
43° 58' 6.16" |
|
23 |
32° 34' 4.87" |
43° 56' 19.47" |
62 |
32° 33' 42.87" |
43° 57' 7.66" |
|
24 |
32° 33' 27.09" |
44° 0' 7.87" |
63 |
32° 27' 13.6" |
44° 9' 44.79" |
|
25 |
32° 33' 1.55" |
44° 0' 58.88" |
64 |
32° 27' 48.89" |
44° 1' 10.87" |
|
26 |
32° 33' 9.96" |
44° 0' 46.02" |
65 |
32° 32' 7.47" |
43° 59' 23.17" |
|
27 |
32° 27' 37.18" |
44° 1' 13.02" |
66 |
32° 27' 34.89" |
44° 9' 47.58" |
|
28 |
32° 26' 11.98" |
44° 2' 56" |
67 |
32° 26' 26.48" |
44° 10' 29.38" |
|
29 |
32° 21' 33.97" |
44° 5' 53.99" |
68 |
32° 20' 12.2" |
44° 12' 40.77" |
|
30 |
32° 25' 32" |
44° 6' 9.97" |
69 |
32° 19' 55.07" |
44° 10' 26.59" |
|
31 |
32° 25' 47.97" |
44° 6' 4.98" |
70 |
32° 20' 4.39" |
44° 11' 22.39" |
|
32 |
32° 25' 58.98" |
44° 6' 31.99" |
71 |
32° 23' 4.3" |
44° 12' 58.8" |
|
33 |
32° 26' 54.98" |
44° 8' 25.99" |
72 |
32° 34' 19.49" |
43° 56' 31.57" |
|
34 |
32° 31' 54.97" |
44° 3' 55.98" |
73 |
32° 35' 17.49" |
44° 1' 3.38" |
|
35 |
32° 32' 34" |
44° 4' 39.97" |
74 |
32° 38' 15.19" |
43° 58' 14.07" |
|
36 |
32° 32' 19.99" |
44° 3' 40.96" |
75 |
32° 38' 9.58" |
43° 58' 11.37" |
|
37 |
32° 30' 21.99" |
44° 3' 33.99" |
76 |
32° 37' 42.59" |
43° 58' 6.19" |
|
38 |
32° 29' 49.97" |
44° 3' 41.99" |
77 |
32° 37' 10.37" |
43° 58' 6.18" |
|
39 |
32° 29' 16" |
44° 3' 45.98" |
78 |
32° 35' 38.99" |
44° 0' 26.9" |
Table 2. Values of the parameter's limits used for quality measurement (qi) computation [7]
|
qi |
EC (dS /m) |
SARadj (meq/l)1/2 |
Na+1 (meq/l) |
Cl-1 (meq/l) |
HCO3-1 (meq/l) |
|
85-100 |
0.20 ≤ EC < 0.75 |
2 ≤ SARadj < 3 |
2 ≤ Na < 3 |
1 ≤ Cl < 4 |
1 ≤ HCO3<1.5 |
|
60-85 |
0.75 ≤ EC < 1.50 |
3 ≤ SARadj < 6 |
3 ≤ Na < 6 |
4 ≤ Cl < 7 |
1.5 ≤HCO3<4.5 |
|
35-60 |
1.50 ≤ EC < 3.00 |
6 ≤ SARadj <12 |
6 ≤ Na < 9 |
7 ≤ Cl <10 |
4.5 ≤HCO3<8.5 |
|
0-35 |
EC < 0.20 or EC ≥ 3.00 |
SARadj < 2 or SARadj ≥ 12 |
Na < 2 or Na ≥ 9 |
Cl < 1 or Cl ≥10 |
HCO3< 1 or HCO3 ≥ 8.5 |
Table 3. Weight values of the IWQI parameters [7]
|
Parameter |
SARadj |
EC |
Na+1 |
Cl-1 |
HCO3-1 |
Total |
|
Weight, wi |
0.189 |
0.211 |
0.204 |
0.194 |
0.202 |
1 |
$\mathrm{qi}=\mathrm{qi}_{\max }-\left[\frac{ \left.\left(\mathrm{Xij}-\mathrm{X}_{\mathrm{inf}}\right) * \mathrm{qi}_{\mathrm{amp}}\right)}{\mathrm{X}_{\mathrm{amp}}}\right]$ (1)
where,
qimax = the maximum value of the qi,
xij = the observed value of the quality parameter,
xinf = the lower limit of the quality parameter,
qiamp = the category amplitude of qi,
xamp = the category amplitude of the quality parameter.
The xamp of the last category of each parameter is determined by considering that the upper limit of this category is the highest measured value.
(3) The IWQI is computed as follows [7]:
$\mathrm{IWQI}=\sum_{i=1}^{\mathrm{n}}$ qi wi (2)
where,
(4) The sodium adsorption ratio (SAR) that depends on the ions concentration of calcium, magnesium, and sodium is calculated as follows:
$\operatorname{SAR}=\frac{\mathrm{Na}^{+1}}{\sqrt{\frac{\left\{\left(\mathrm{Mg}^{+2}\right)+\left(\mathrm{Ca}^{+2}\right)\right\}}{2}}}$ (3)
where, Na+1, Mg+2, and Ca+2 are in meq/l. Because of continuously dissolving the calcium by the water leaching inside the soil like the rainfall water and the irrigation water, its concentration changes in the soil water. Therefore, Eq. (3) had been modified to process this change by using the concentration of equilibrated calcium (Caeq+2) instead of the concentration of calcium. Thus, the SAR in Eq. (3) is changed to the adjusted SAR with a symbol of SARadj [4]. The details of the procedure to compute the concentration of equilibrated calcium were explained by Lesch and Suarez [30].
Table 4. Classification of irrigation water quality index (IWQI) [7]
|
Category of IWQI |
Restrictions of water use |
Recommendations |
||
|
Symbol |
Definition |
For Soil |
For Plant |
|
|
(85-100) |
NR |
No Restriction |
It is probably used for most of the soils, may little cause salinity and sodicity problems, is recommended to add leaching water during the irrigation process, and is not recommended to use for soils of extremely low permeability. |
No risk of toxicity for most plants |
|
(70-85) |
LR |
Low Restriction |
It is recommended to use for soils of light texture or moderate permeability, is recommended to add leaching water, and is recommended to avoid using it in soils of high clay may cause sodicity risks in soils of heavy texture. |
Avoid using it for sensitive plants to salts. |
|
(55-70) |
MR |
Moderate Restriction |
It is probably used in soils of moderate to high permeability. It is recommended to moderately leaching the soils from salts. |
It is recommended to use for plants of moderate tolerance to salts. |
|
(40-55) |
HR |
High Restriction |
It may be used in soils of high permeability without compact layers. It is recommended to use an irrigation schedule of high-frequency for the water with EC greater than 2000 dS /m and SAR greater than 7.0. |
It is recommended to irrigate plants of moderate to high tolerance to salts with carefully control the soil salinity except for water of low Na, Cl and HCO3 values. |
|
(0-40) |
SR |
Severe Restriction |
It should be avoided to use for irrigation under normal conditions. In special cases, it is probably used sometimes. Water with low salt levels and high SAR requires gypsum application. For the water of high saline concentration, soils should have high permeability, and leaching water should be added to avoid the accumulation of salts. |
It is only used for plants of high tolerance to salts, except for water of extremely low values of HCO3, Na, and Cl. |
3.3 Development of a non-linear regression model of IWQI
The software package–IMB Statistics Product and Service Solution (SPSS) version 25 was used to establish a non-linear model of IWQI. First, the irrigation water quality parameters; EC, SARadj, Na+1, Cl-1, and HCO3-1 for seventy-eight wells were divided into two parts; the first part consisted of data of sixty-nine wells was used to calibrate the proposed model, and the second part contained data of nine wells was used to verify the validity stage. Second, the regression relation between IWQI calculated by Eq. (2), and each one of the mentioned parameters was determined by using curve fitting estimation analysis, which gives eleven model description of relations for each regression between IWQI and each one of these parameters. For these eleven relations, the relation of best fit, the highest value of the coefficient of determination (R2) was selected. Thus, five relations were obtained, and each of them represents the relation of IWQI with one of the quality parameters. Third, these five relations were combined in one equation with unknown coefficients and then used nonlinear regression analysis to find a non-linear model of IWQI with the quality parameters. Fourth, the calibration for the proposed model was performed depending on the value of R2. Finally, the validity of the new non-linear model was verified through testing the coefficient of determination between the values of IWQI estimated by the proposed model and the IWQI values calculated by Eq. (2).
The statistical values (maximum, minimum, and mean) of each parameter of the collected data were determined as listed in Table 5. The FAO criteria for irrigation water quality are also presented in this table. According to these criteria, the mean values of EC, Na+1, and Cl-1 are within the degree of severe restriction. This means that the groundwater of the study area has a severe salinity due to the high value of EC, which affects the availability of water for the crops if it is used for irrigation purposes [4]. As well, this groundwater has toxicity hazards due to the high values of Na+1 and Cl-1, which affects sensitive crops [4].
On the other hand, the mean value of HCO3-1 is within the moderate restriction degree, which refers that using groundwater for irrigation purposes has a moderate influence on the susceptible crops [4]. On the contrary, the average value of SAR is within the degree of none restriction because this value is within the range of SAR values of (6-12) and EC value greater than 1.9 [4]. This means that using the groundwater of the study area for irrigation purposes has no influence on the water infiltration rate into the soil. The range values of the parameters EC, Na+1, Cl-1, HCO3-1, Ca+2, Mg+2, and SARadj are (2.41-11.97), (9.13-47.02), (10.16-37.46), (1.62-16.05), (3.49-30.54), (3.29-25.10), and (2.78-13.80), respectively. As well, Table 5 indicates that the standard deviation of all parameters is greater than 1. This means that the values of all parameters have a clear deviation than their mean value.
Table 5. Statistical values of the groundwater quality parameters for 78 unconfined wells within the study area with comparison them by the FAO; Irrigation water quality criteria [4]
|
Parameter |
Minimum Value |
Maximum Value |
Mean Value |
Standard deviation |
FAO Criteria for Irrigation Water, (Ayers and Westcott, 1994) [4]. |
||||
|
Problem of Potential Irrigation |
Restriction Degree on Use |
||||||||
|
None |
Slight to Moderate |
Severe |
|||||||
|
Ec (dS /m) |
2.41 |
11.97 |
4.59 |
1.28 |
Salinity (affects water availability of the crops) |
˂ 0.7 |
0.7 – 3.0 |
˃ 3.0 |
|
|
Na+1 (meq/l) |
9.13 |
47.02 |
20.85 |
6.68 |
Toxicity (affects the sensitive crops) |
˂ 3 |
3 – 9 |
˃ 9 |
|
|
Cl-1 (meq/l) |
10.16 |
37.46 |
17.85 |
4.7 |
Toxicity (affects the sensitive crops) |
˂ 4 |
4 – 10 |
˃ 10 |
|
|
HCO3-1 (meq/l) |
1.62 |
16.05 |
6.61 |
2.11 |
Miscellaneous Effects (affects the susceptible crops) |
˂ 1.5 |
1.5 – 8.5 |
˃ 8.5 |
|
|
Ca+2 (meq/l) |
3.49 |
30.54 |
13.73 |
4.38 |
- |
- |
- |
- |
|
|
Mg+2 (meq/l) |
3.29 |
25.10 |
11.31 |
3.36 |
- |
- |
- |
- |
|
|
SARadj (meq/l)1/2 |
2.78 |
13.80 |
6.75 |
1.87 |
Infiltration (affects water infiltration rate into the soil) |
SAR= (0-3) and EC= |
˃ 0.7 |
0.7 – 0.2 |
˂ 0.2 |
|
SAR= (3-6) and EC= |
˃ 1.2 |
1.2 – 0.3 |
˂ 0.3 |
||||||
|
SAR= (6-12) and EC= |
˃ 1.9 |
1.9 – 0.5 |
˂ 0.5 |
||||||
|
SAR= (12-20) and EC= |
˃ 2.9 |
2.9 – 1.3 |
˂ 1.3 |
||||||
|
SAR= (20-40) and EC= |
˃ 5.0 |
5.0 – 2.9 |
˂ 2.9 |
||||||
Figure 2. The relation of best fit between IWQI calculated by Meireles model and each of the quality parameters SAR, HCO3-1, Na+1, EC, and Cl-1 for data of wells nos, (1-69)
Table 6. The calculated values of IWQI by both Meireles model [7] and the developed model (Eq. (4)) with the irrigation groundwater quality classifications in the study area and the statistical parameters of IWQI
|
Well no. |
IWQI by Meireles model |
IWQI by developed model |
Category |
Well no. |
IWQI by Meireles model |
IWQI by developed model |
Category |
|
|
1 |
33.58 |
33.64 |
SR |
40 |
29.17 |
28.88 |
SR |
|
|
2 |
32.61 |
32.54 |
SR |
41 |
29.28 |
29.04 |
SR |
|
|
3 |
32.58 |
33.47 |
SR |
42 |
27.98 |
28.49 |
SR |
|
|
4 |
33.71 |
33.79 |
SR |
43 |
31.90 |
32.09 |
SR |
|
|
5 |
36.23 |
36.59 |
SR |
44 |
27.70 |
27.42 |
SR |
|
|
6 |
32.43 |
33.86 |
SR |
45 |
30.09 |
29.9 |
SR |
|
|
7 |
45.80 |
45.14 |
HR |
46 |
37.99 |
37.53 |
SR |
|
|
8 |
36.31 |
36.68 |
SR |
47 |
45.26 |
43.6 |
HR |
|
|
9 |
35.59 |
35.34 |
SR |
48 |
27.70 |
27.42 |
SR |
|
|
10 |
18.50 |
21.48 |
SR |
49 |
32.79 |
32.55 |
SR |
|
|
11 |
32.77 |
32.5 |
SR |
50 |
28.76 |
28.37 |
SR |
|
|
12 |
30.08 |
29.63 |
SR |
51 |
45.27 |
45.27 |
HR |
|
|
13 |
31.71 |
30.71 |
SR |
52 |
37.97 |
38.17 |
SR |
|
|
14 |
35.31 |
35.56 |
SR |
53 |
31.18 |
31.21 |
SR |
|
|
15 |
39.90 |
39.52 |
SR |
54 |
31.01 |
30.9 |
SR |
|
|
16 |
43.91 |
43.05 |
HR |
55 |
31.92 |
32.09 |
SR |
|
|
17 |
7.93 |
6.52 |
SR |
56 |
31.97 |
32.24 |
SR |
|
|
18 |
39.14 |
39.3 |
SR |
57 |
32.44 |
33.86 |
SR |
|
|
19 |
38.42 |
38.63 |
SR |
58 |
30.04 |
29.97 |
SR |
|
|
20 |
16.02 |
15.99 |
SR |
59 |
26.79 |
27.04 |
SR |
|
|
21 |
33.14 |
33.68 |
SR |
60 |
30.23 |
29.66 |
SR |
|
|
22 |
33.18 |
32.62 |
SR |
61 |
34.04 |
33.84 |
SR |
|
|
23 |
36.14 |
35.94 |
SR |
62 |
41.01 |
40.54 |
HR |
|
|
24 |
29.57 |
29.55 |
SR |
63 |
29.80 |
30.07 |
SR |
|
|
25 |
27.80 |
27.4 |
SR |
64 |
34.42 |
34.35 |
SR |
|
|
26 |
32.46 |
32.46 |
SR |
65 |
28.81 |
28.7 |
SR |
|
|
27 |
39.07 |
39.25 |
SR |
66 |
30.63 |
30.43 |
SR |
|
|
28 |
38.35 |
38.26 |
SR |
67 |
28.02 |
28.59 |
SR |
|
|
29 |
38.71 |
39.23 |
SR |
68 |
31.82 |
31.6 |
SR |
|
|
30 |
36.48 |
36.68 |
SR |
69 |
31.52 |
31.88 |
SR |
|
|
31 |
33.84 |
33.73 |
SR |
70 |
32.14 |
30.97 |
SR |
|
|
32 |
44.67 |
45.19 |
HR |
71 |
31.26 |
32.01 |
SR |
|
|
33 |
38.54 |
38.45 |
SR |
72 |
33.02 |
33.08 |
SR |
|
|
34 |
13.32 |
13.57 |
SR |
73 |
35.91 |
36.08 |
SR |
|
|
35 |
28.52 |
28.93 |
SR |
74 |
38.51 |
38.3 |
SR |
|
|
36 |
30.73 |
30.52 |
SR |
75 |
31.83 |
31.91 |
SR |
|
|
37 |
27.62 |
25.87 |
SR |
76 |
43.52 |
42.74 |
HR |
|
|
38 |
30.64 |
31.21 |
SR |
77 |
43.60 |
42.74 |
HR |
|
|
39 |
34.31 |
35.55 |
SR |
78 |
35.89 |
35.15 |
SR |
|
|
Statistical parameters of IWQI |
||||||||
|
Parameter |
IWQI by Meireles model |
IWQI by developed model |
||||||
|
Mean |
32.98 |
32.96 |
||||||
|
Minimum |
7.93 |
6.52 |
||||||
|
Maximum |
45.80 |
45.27 |
||||||
|
Standard Deviation |
6.51 |
6.48 |
||||||
The results of IWQI calculated by Eq. (2) for groundwater of 78 wells are listed in Table 6. The values of IWQI for groundwater of 90% of wells are within severe restriction category (SR) and 10% of wells are within the category of high restriction (HR). Therefore, it is recommended to use the groundwater of the wells in the present study for soils and plants according to the recommendations mentioned in Table 4. Highly tolerant (plants and crops) of salt can be irrigated using well water that falls within the category (SR). While the water of wells within the category HR can be used for irrigation of plants and crops with moderate to high tolerance to salts, with continuous special measures that can reduce the salinity problem [7].
Depending on the curve fitting analysis, the relation of the best fit (the highest value of the coefficient of determination, R2) between the IWQI and each of the quality parameters for the first group of 69 wells were linear between IWQI and each of SARadj, HCO3-1, and Na+1, as shown in Figures 2a, 2b, and 2c, respectively, and exponential between IWQI and each of EC and Cl-1 as shown in Figures 2d and 2e, respectively. The non-linear regression model of the IWQI for the first group of wells nos. (1-69) shown in Table 6 is developed depending on combining the mentioned relations between the IWQI and each of the quality parameters by using the SPSS software program as follows:
$\begin{aligned} \mathrm{IWQI}=55.803-& 0.646 \mathrm{SAR}_{\mathrm{adj}}-1.337 \mathrm{HCO}_{3}^{-1} \\ &-0.469 \mathrm{Na}^{+1} \\ &+1797.62 \mathrm{e}^{\left[0.238\left(\mathrm{Cl}^{-1}\right)-3.829(\mathrm{EC})\right]} \end{aligned}$ (4)
where:
SARadj is in (meq/l)1/2, HCO3-1, Na+1, and Cl-1 are in meq/l, and EC is in dS/m.
Figure 3. Correlation between the estimated IWQI values by the developed model; Eq. (4) and the calculated IWQI values by Meireles model for wells nos. (1-69) listed in Table 6
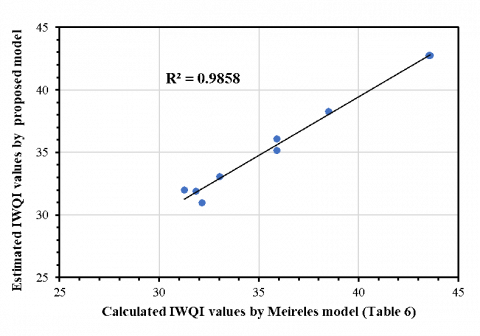
Figure 4. Correlation between the estimated IWQI values by developed model; Eq. (4) and the calculated IWQI values by Meireles model for wells nos. (70-78) listed in Table 6
Table 6 shows the calculated values of IWQI by both Meireles model and the developed model (Eq. (4)) with the irrigation groundwater quality classifications in the study area and the statistical parameters of IWQI. Table 6 indicates that the mean value of the IWQI for groundwater of all wells is 32.98 for Meireles model and 32.96 for the developed model, which is within the category of severe restriction (SR) as well as the range of the IWQI values are between 7.93 (SR) and 45.80 (HR) for Meireles model and between 6.52 (SR) and 45.27 (HR) for the developed model. In addition, Table 6 shows that the standard deviation of the IWQI is greater than 1 for both models. Moreover, Table 6 points out that groundwater of 90% of wells have the IWQI values within severe restriction category (SR) and groundwater of 10% of wells are within the category of high restriction (HR).
The calibration of the developed model was done by finding the correlation (the coefficient of determination, R2) between the values of IWQI estimated from the developed model in Eq. (4) and the values of IWQI calculated by Meireles model for the first 69 wells listed in Table 6. Figure 3 shows this correlation with R2 of 0.99 that refers to a strong correlation. The root means square error (RMSE) and the mean bias error (MBE) for this correlation are 0.67 and -0.035, respectively. The low values of these errors with the high value of R2 indicate that Eq. (4) attains a good calibration for the IWQI values. The verification was made for Eq. (4) by comparison the IWQI values estimated from this equation with the IWQI values for the rest wells listed in Table 6 (wells nos. 70 to 78). Figure 4 presents the correlation of this verification with R2 of 0.986 which refers to a strong correlation. The root means square error (RMSE) and the mean bias error (MBE) for this correlation are 0.66 and -0.3, respectively. The low values of these errors with the high value of R2 confirms that proposed model in Eq. (4) has a good estimation of IWQI values for the study area.
In the present study, a new non-linear regression model of the IWQI for the groundwater in Karbala - Najaf plateau, Iraq is developed by using SPSS program depending on the IWQI values calculated from Meireles model. The results show that the values of IWQI for groundwater of 90% of wells are within severe restriction category (SR) and 10% of wells are within the category of high restriction (HR). For each of the calibration and validation for the developed model, the results revealed a good correlation between the estimated IWQI values by this proposed model and that calculated from Meireles model. Accordingly, it can be recommended to use the developed model to estimate the IWQI for groundwater of the study area for future studies.
[1] Arslan, H. (2017). Determination of temporal and spatial variability of groundwater irrigation quality using geostatistical techniques on the coastal aquifer of Çarşamba Plain, Turkey, from 1990 to 2012. Environmental Earth Sciences, 76(1): 38. https://doi.org/10.1007/s12665-016-6375-x
[2] Alexander, A.C., Ndambuki, J., Salim, R., Manda, A. (2017). Assessment of spatial variation of groundwater quality in a mining basin. Sustainability, 9(5): 823. https://doi.org/10.3390/su9050823
[3] Nas, B., Berktay, A. (2010). Groundwater quality mapping in urban groundwater using GIS. Environmental Monitoring and Assessment, 160(1): 215-227. https://doi.org/10.1007/s10661-008-0689-4
[4] Ayers, R.S., Westcot, D.W. (1985). Water quality for agriculture. FAO Irrigation and Drainage Paper 29 Rev. 1. Food and Agricultural Organization. Rome, 1: 74.
[5] Boah, D.K., Twum, S.B., Pelig-Ba, K.B. (2015). Mathematical computation of water quality index of Vea dam in upper east region of Ghana. Environ Sci, 3(1): 11-16.
[6] Rabeiy, R.E. (2018). Assessment and modeling of groundwater quality using WQI and GIS in Upper Egypt area. Environmental Science and Pollution Research, 25(31): 30808-30817. https://doi.org/10.1007/s11356-017-8617-1
[7] Meireles, A.C.M., Andrade, E.M.D., Chaves, L.C.G., Frischkorn, H., Crisostomo, L.A. (2010). A new proposal of the classification of irrigation water. Revista Ciencia Agronomica, 41(3): 349-357. https://doi.org/10.1590/S1806-66902010000300005
[8] Hanna, N.S., Jarjes, F.Z., Toma, J.J. (2018). Assessing Shekh Turab water resources for irrigation purposes by using water quality index. Zanco Journal of Pure and Applied Sciences, 30(5): 17-28.
[9] Khalaf, R.M., Hassan, W.H. (2013). Evaluation of irrigation water quality index IWQI for Al-Dammam confined aquifer in the west and southwest of Karbala city, Iraq. International Journal of Civil Engineering IJCE, 2(3): 21-34.
[10] Mohammed, O., Hassan, M.F. (2015). Evaluation of drainage water quality for irrigation by integration between irrigation water quality index and GIS. International Journal of Technical Research and Applications, 3(4): 24-32.
[11] Al-Mussawi, W.H. (2014). Assessment of groundwater quality in Umm Er Radhuma aquifer (Iraqi Western Desert) by integration between irrigation water quality index and GIS. J Babylon Univ Eng Sci, 1(22): 201-217.
[12] Mutasher, A.A. (2013). Assessment of Water Quality of Al-Husseinieh River/Karbala Governorate/Iraq for Irrigation Purpose by Using Water Quality Index+. Journal of Techniquse, 26(5).
[13] Omran, E.S.E. (2012). A proposed model to assess and map irrigation water well suitability using geospatial analysis. Water, 4(3): 545-567. https://doi.org/10.3390/w4030545
[14] Al-Mohammed, F.M., Mutasher, A.A. (2013). Application of water quality index for evaluation of groundwater quality for drinking purpose in Dibdiba Aquifer, Kerbala City, Iraq. Journal of Babylon University Engineering Science, 21: 1-14.
[15] Siswoyo, H., Agung, I.G., Swantara, I.M.D., Sumiyati. (2016). Determination of groundwater quality for agricultural crops in Jombang Regency. International Journal of Agronomy and Agricultural Research (IJAAR), 9(5): 62-67.
[16] Gidey, A. (2018). Geospatial distribution modeling and determining suitability of groundwater quality for irrigation purpose using geospatial methods and water quality index (WQI) in Northern Ethiopia. Applied Water Science, 8(3): 1-16. https://doi.org/10.1007/s13201-018-0722-x
[17] Ayers, R.S., Westcot, D.W. (1985). Water quality for agriculture. Rome: Food and Agriculture Organization of the United Nations, 29: 174.
[18] Omran, E.S.E., Ghallab, A., Selmy, S., Gad, A.A. (2014). Evaluation and mapping water wells suitability for irrigation using GIS in Darb El-Arbaein, South Western Desert, Egypt. International Journal of Water Resources and Arid Environments, 3(1): 63-76.
[19] Al-Kubaisi, Q.Y., Al-Abadi, A.M., Al-Ghanimy, M.A. (2018). Mapping groundwater quality Index for irrigation in the Dibdibba aquifer at Karbala-Najaf plateau, central of Iraq. Iraqi Journal of Science, 59(3): 1636-1652. https://doi.org/10.24996/ijs.2018.59.3C.10
[20] Nwankwoala, H.O., Amachree, T. (2020). The water quality index (WQI) and hydrochemical characterization of groundwater resources in hydrocarbon polluted sites in the Niger delta. Journal of Mining and Geology, 56(1): 69-84.
[21] Dhakad, N.K., Deepak, S., Choudhary, P. (2008). Water quality index of ground water (GWQI) of Jhabua Town, MP (India). Journal of Environmental Research and Development, 2(3): 443-446.
[22] Al-Hadithi, M., Hasan, K., Algburi, A., Al-Paruany, K. (2019). Groundwater quality assessment using irrigation water quality index and GIS in Baghdad, Iraq. Jordan Journal of Earth and Environmental Sciences, 10(1): 15-20.
[23] Al Maliki, A.A., Abbass, Z.D., Hussain, H.M., Al-Ansari, N. (2020). Assessment of the groundwater suitability for irrigation near Al Kufa City and preparing the final water quality maps using spatial distribution tools. Environmental Earth Sciences, 79(13): 1-12. https://doi.org/10.1007/s12665-020-09060-w
[24] Al-Madhlom, Q., Al-Ansari, N., Hussain, H.M., Lindblom, J., Abdullah, T., Abid Hamza, B., Knutsson, S. (2017). Seepage velocity of Dibdibba formation in Karbala, Iraq. Engineering, 9(3): 279-290. https://doi.org/10.4236/eng.2017.93015
[25] Sissakian, V.K., Al-Ansari, N., Adamo, N., Abdullah, M., Laue, J. (2020). Stratigraphy of the Mesopotamian plain: a critical review. Journal of Earth Sciences and Geotechnical Engineering, 10(4): 27-56.
[26] Hassan, M.A., Jawad, L.A. (2014). AL-Dibdiba formation basin hydrological aspects extraction using GIS techniques and quantitative morphometric analysis. Iraqi Journal of Science, 55(1): 283-294.
[27] Al-Saadi, R.J.M. (2013). Contour Maps and Evaluation of Groundwater Quality in Karbala Region. Journal of Kerbala University, 11(1): 204-222.
[28] Al-Jiburi, H.K., Al-Basrawi, N.H. (2015). Hydrogeological map of Iraq, scale 1: 1000 000, 2013. Iraqi Bulletin of Geology and Mining, 11(1): 17-26.
[29] American Public Health Association, American Water Works Association, Water Pollution Control Federation, & Water Environment Federation. (1912). Standard methods for the examination of water and wastewater (Vol. 2). American Public Health Association.
[30] Lesch, S.M., Suarez, D.L. (2009). A short note on calculating the adjusted SAR index. American Society of Agricultural and Biological Engineering, 52(2): 493-496.