Peisen Wang* | Hongyan Ding | Puyang Zhang
© 2020 IIETA. This article is published by IIETA and is licensed under the CC BY 4.0 license (http://creativecommons.org/licenses/by/4.0/).
OPEN ACCESS
The foundation piles in karst areas have different mechanical properties from those in other areas. Targeting a critical highway bridge in a karst area, this paper designs two kinds of foundation pile models: friction pile, and KCSP, based on theories on dynamic tests. Then, shaking table tests were carried out to ascertain the features of pile strain distribution of KCSP under earthquakes. During the tests, a large laminar suspended shear box was adopted to mimic the boundary effect of soil. In addition, numerical simulations were conducted to disclose the effects of karst cave on pile strain. The test results indicate that: the peak strain of KCSP increased with the peak acceleration; For both KCSP and friction pile, the peak strain decreased first and then increased along the depth; The presence of karst cave can adversely affect the seismic response of foundation pile; The taller the karst cave, the larger the peak strain of the pile; the peak strain of KCSP was larger at the two ends, and smaller in the middle. The numerical analysis shows that: the peak strain of foundation pile in karst cave increased significantly with cave height; The peak strain of the pile passing through multiple caves was similar to that of the pile passing through only one cave, under the same cave height; But the multi-cave scenario differed from the single-cave scenario in peak strain distribution. The research results provide new insights into the seismic design of pile foundation of bridges in karst areas.
dry sandy soil foundation, pile-soil interaction, karst cave, shaking table test
Foundation failure is the primary form of seismic hazard in bridges. In the current seismic design of bridges, the superstructure calculation generally assumes that the foundation is rigid, and the soil under the pier is hardened, failing to consider the pile-soil interaction. If pile-soil interaction is considered, the seismic effect on the bridge might surpass that contemplated in the current design. Therefore, the impact of pile-soil interaction on the seismic response of bridge cannot be ignored.
In karst areas, the foundation piles of bridges are often embedded into the roof of karst cave, a special geological structure, or penetrate through one or more karst caves. Thus, the foundation piles in karst areas have different mechanical properties from those in other areas. Many scholars have explored the karst-crossing socketed pile (KCSP) under dead load through theoretic analysis, numerical simulation, and experiments [1-6]. But few researchers have discussed the dynamic response or mechanical properties of KCSP under seismic actions.
Shaking table test is a common method to directly measure the seismic response and destructive mechanism of structures. Through the test, the seismic response and destruction process of the target structure can be reproduced rationally. As a result, shaking table test has been widely adopted to examine and evaluate the seismic properties of structures. In the E-Defense shaking table testing facility, Suzuki et al. [7] carried out a shaking table test with a cylindrical laminar shear soil box, and identified the factors affecting the pile stress distribution in the seismic process. Through shaking table tests with a centrifuge, Hussien et al. [8] observed the dynamic responses of single piles, pile groups, and the superstructure in sandy soil, and the laws of their bending moment distributions. Lv et al. [9, 10] carried out a series of shaking table tests on the superstructure-foundation interaction system, and investigated the influence of foundation soil properties on soil-structure interaction.
With a self-designed soil box model, Wei et al. [11] conducted shaking table tests on free-field model, single-pile pier model, single-pile pier 2×2 model, dual-pile pier 2×2 model, and dual-pile pier 3×2 model, respectively, summarized the seismic response rules and structure damage features of different pile foundation and pier structures, and compared the seismic properties of bridges with the single-pile piers and those with the dual-pile piers. Considering the pile-soil interaction, Jiang et al. [12] tested the large, complex pile-soil structure of Tianjin Station Transport Hub Project on a shaking table model, and drew the vibration response rules of the system and the seismic properties of the structure. Sun and Xie [13] designed a 1:70 model for a 1,400m-long cable-stayed bridge, performed a multi-point shaking table test on the model, and simulated the foundation effect with a laminar shear soil box, revealing how the horizontal seismic response of the bridge is affected by different structure systems.
Numerical analysis is also a popular way to evaluate the seismic behaviors of structures. For example, Dezfulian and Seed [14] simulated the propagation of ground motion in the bedrock, and found that pile-soil interaction affects the propagation features of ground motion in soil. Chang et al. [15] explored the three-dimensional (3D) dynamic features of lateral transient vibration of large-diameter piles, and summed up the stiffness and damping features of these piles. Based on simplified Winkler model, Prendergast and Gavin [16] determined the initial stiffness coefficient, and then simulated the elastic response of pile-soil system. Torabi and Rayhani [17] proposed and validated a hybrid numerical method to characterize the equivalent linear impedance on the top of the pile under nonlinear pile-soil interaction. Through finite-element simulation, Mucciacciaro and Sica [18] analyzed the effects of soil nonlinearity on the dynamic response of single pile. Rooz and Hamidi [19] simulated pile-soil interaction accurately by the Arbitrary Lagrangian Eulerian (ALE) adaptive mesh method, and verified with field measurements that the simulation method is remarkably better than the traditional numerical methods. Li et al. [20] carried out a 3D nonlinear dynamic numerical simulation of pile group foundation.
It is understood by many scholars [21-24] that: The experiments and numerical analysis on the dynamic seismic response of a structure could be affected by many factors, namely, site condition, surrounding soil properties, constitutive model, ground motion parameters, and structural form of pile foundation. In karst areas, the bearing capacity of foundation piles is not only controlled by the properties of the karst cave (e.g. height, span, and roof thickness), but also influenced by the thickness of overlying soil, the load borne by the foundation, and foundation parameters. However, the pile-soil interaction of structures in karst areas has rarely been investigated through shaking table tests. To make up for the gap, it is of great significance to conduct experiments and numerical analysis on the dynamic seismic response and mechanical properties of pile foundation in karst areas.
Targeting a critical highway bridge in a karst area, this paper designs two kinds of foundation pile models: friction pile, and KCSP, based on theories on dynamic tests. Then, shaking table tests were carried out to ascertain the features of pile strain distribution of KCSP under earthquakes. During the tests, a large suspended laminar shear box was adopted to mimic the boundary effect of soil. In addition, numerical simulations were conducted to disclose the effects of karst cave on pile strain. The test and simulation results reveal the dynamic response rules of foundation piles in karst areas, under horizontal ground motions. The research results help to optimize the seismic response of the pile foundation in karst areas.
2.1 Similarity ratio
According to the Buckingham π theorem, a key theorem in dimensional analysis, length, acceleration, and elastic modulus were selected as the basic dimensions. Under dynamic conditions, the pile-body deformation depends on the pile stiffness and the inertia force. To ensure the similarity between the model and the prototype, the key lies in the scale uniformity between the inertia force and the resilience of the pile [25].
Considering the limitations in the size and bearing capacity of the shaking table, as well as the dimensions of the soil box, the scale of length was determined as S1=1/100. Under such a small scale of length, the foundation pile model has an ultrasmall cross-sectional area, making it difficult to design the counterweight. Besides, the model materials and sandy soil must have the same scale. Thus, the density of the sandy soil should not be reduced by the same scale as length. Hence, the scale of density was determined as Sp=1. Since the foundation pile was modelled with polypropylene, the scale of elastic modulus was set to SE=1/20.
Based on the above scales, the similarity relations of other physical quantities were derived one by one (Table 1).
Table 1. Similarity relations for shaking table tests
|
Physical quantity |
Similarity relation |
Similarity ratio (model/prototype) |
|
Length, l |
Sl |
1/100 |
|
Density, ρ |
Sρ |
1 |
|
Elastic modulus, E |
SE |
1/20 |
|
Acceleration, a |
Sa= SE/(Sl Sρ) |
5 |
|
Bending stiffness, EI |
SEI= SE·Sl4 |
1/(2×109) |
|
F (Inertia force) |
SF= Sρ·Sl3·Sa |
5/106 |
|
F’ (resilience) |
SF’=SE·Sl2 |
5/106 |
|
Time, t |
St=(Sl/Sa)0.5 |
1/5000.5 |
|
Vibration frequency, f |
Sf=1/St |
5000.5=22.36 |
2.2.1 Pile models
In bridge engineering, karst caves usually have multiple layers and irregular shapes. Due to the limits of test condition, the actual multi-layer karst cave was simplified as a single-layer regular cuboid for shaking table tests. Based on the friction pile and socketed pile in a pile foundation of the target bridge, multiple parameters (e.g. cave height, backfill thickness, and pile depth beneath the cave) were adopted to design three pile models. The model parameters are listed in Table 2, and the designed models are shown in Figure 1.
Table 2. The model parameters
|
Pile number |
Roof thickness d1 |
Cave height d2 |
Cave width d3 |
Pile depth beneath cave d4 |
|
FP-1 |
0 |
0 |
0 |
0 |
|
KCSP-2 |
3Dp |
6Dp |
10Dp |
2Dp |
|
KCSP-4 |
3Dp |
10Dp |
10Dp |
2Dp |
(a) FP-1; (b) KCSP-2; (c) KCSP-4.
Figure 1. The three test models
The two KCSPs mainly bear the inertia force from the surrounding rock of the karst cave. Therefore, the rock mass of the cave was modeled with materials like gypsum, fine sand, and clay, plus a small amount of calcium carbonate, in the light of the above similarity relations. Among them, the clay enhances the plasticity, the fine sand increases the volumetric weight, and the calcium carbonate cuts down the elastic modulus and strength of the model. The mix ratios of the karst materials are presented in Table 3.
Table 3. The mix ratios of karst materials (kg)
|
Gypsum |
Clay |
Sand |
Calcium carbonate |
Water |
|
4.8125 |
1.4375 |
71.875 |
7.5 |
8.125 |
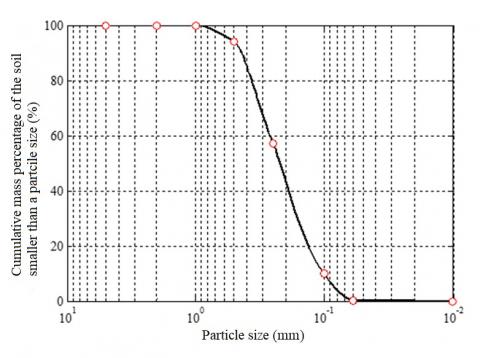
For the purpose of the shaking table tests, the soil mass of our tests was made up of Fujian sand. The physical properties and pea curve of the sand are illustrated in Table 4 and Figure 2, respectively.
Figure 2. The grading curve of sand
Table 4. The physical properties of sand
|
Maximum dry density rd max /(g/cm3) |
Minimum dry density rd min /(g/cm3) |
Moisture content w / % |
Effective grain size d10 / mm |
Characteristic grain size d30 / mm |
Control grain size d60 / mm |
Nonuniform coefficient Cu |
|
1.958 |
1.673 |
3.93 |
0.121 |
0.161 |
0.268 |
2.215 |
2.3 Test instruments
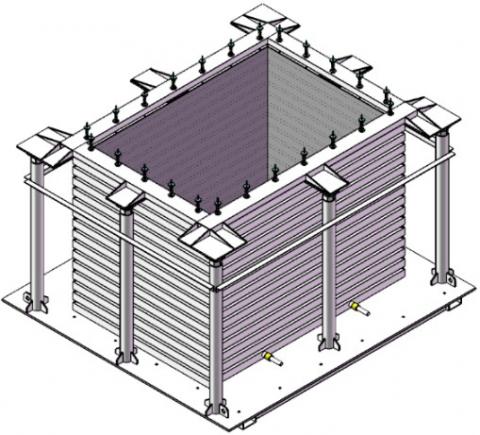
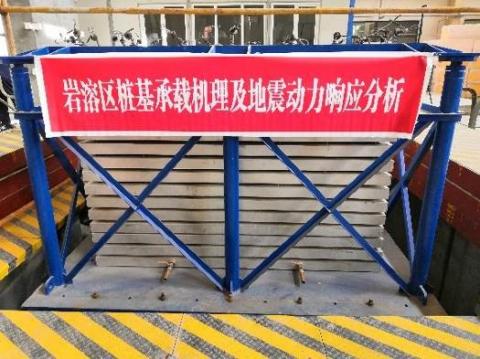
Because the shaking table tests consider pile-soil interaction, the impact of the soil box on the dynamic features of the soil in each model should be minimized. That is, the natural vibration frequency of the soil box must be far away from that of the soil.
(a) 3D drawing
(b) Photo
Figure 3. The suspended laminar shear box
The conventional laminar shear box is usually used in shaking table tests with horizontal unidirectional seismic waves. During the tests, the shear box movements in two directions interfere with each other, failing to effectively simulate the boundary effect of soil.
Drawing on the existing designs of shear boxes and the results of previous shaking table tests [26-28], the authors designed a suspended laminar shear box to investigate the dynamic response of foundation piles under horizontal bidirectional ground motions (Figure 3).
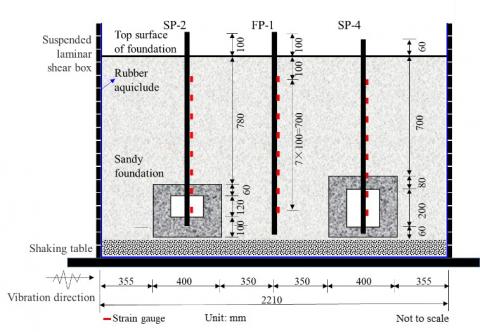
To measure the seismic response of pile strain, strain gages were deployed on each test pile as shown in Figure 4.
Figure 4. The arrangement of test piles and strain gages
2.4 Test conditions
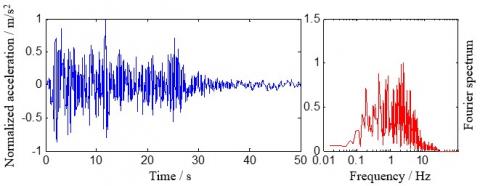
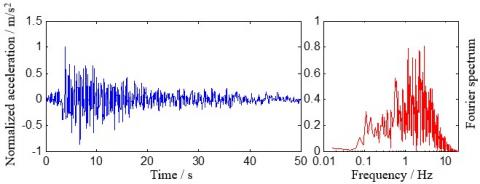
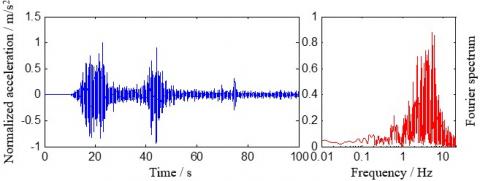
According to the Code for Seismic Design of Buildings (GB 50011-2010) [29], three actual seismic waves, namely, El Centro, Taft, and Wenchuan, were selected for the shaking table tests. The normalized time histories and Fourier spectra of the three waves are presented in Figure 5.
Each seismic wave was inputted in the X-direction, and the peak acceleration was increased progressively from 0.035g, 0.1g, 0.175g, 0.22g to 0.4g, according to the magnitude of earthquake. The peak accelerations of El Centro, Taft, and Wenchuan are 0.4g, 0.4g, and 0.175g, respectively. Prior to each adjustment, white noise was imported to clear the spectrogram. As shown in Table 5, a total of 13 working conditions were designed for the shaking table tests. A new working condition was loaded after the end of the current condition.
(a) El Centro wave
(b) Taft wave
(c) Wenchuan wave
Figure 5. The normalized time histories and Fourier spectra of the selected waves
Table 5. The working conditions
|
Test number |
Working condition |
Peak acceleration |
Description |
|
1 |
TF1 |
0.035g |
Prototype acceleration Magnitude 7 frequent earthquake |
|
2 |
El 1 |
0.035g |
|
|
3 |
WC1 |
0.035g |
|
|
4 |
TF2 |
0.1g |
Prototype acceleration Magnitude 7 frequent earthquake |
|
5 |
El 2 |
0.1g |
|
|
6 |
WC2 |
0.1g |
|
|
7 |
TF3 |
0.175g |
Model acceleration Magnitude 7 frequent earthquake |
|
8 |
El 3 |
0.175g |
|
|
9 |
WC3 |
0.175g |
|
|
10 |
TF4 |
0.22g |
Prototype acceleration Magnitude 7 frequent earthquake |
|
11 |
El 4 |
0.22g |
|
|
12 |
TF5 |
0.4g |
Prototype acceleration Magnitude 8 frequent earthquake |
|
13 |
El5 |
0.4g |
3.1 Dynamics of pile strain at different peak accelerations
Table 6. The peak strains of KCSP-4 at different depths under El Centro waves (με)
|
Depth of strain gage (mm) |
Peak acceleration |
||||
|
0.035g |
0.1g |
0.175g |
0.22g |
0.4g |
|
|
100 |
— |
— |
— |
— |
— |
|
200 |
25.0 |
61.0 |
60.5 |
82.9 |
107.7 |
|
300 |
21.9 |
26.6 |
43.8 |
39.1 |
91.9 |
|
400 |
21.3 |
18.8 |
25.7 |
45.5 |
64.9 |
|
500 |
11.1 |
15.8 |
16.7 |
17.3 |
49.8 |
|
600 |
20.3 |
18.7 |
17.1 |
19.7 |
55.5 |
|
700 |
42.3 |
67.3 |
44.7 |
37.6 |
95.5 |
|
800 |
76.4 |
78.5 |
95.2 |
117.0 |
127.6 |
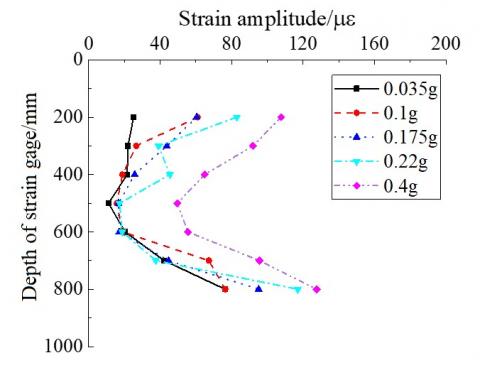
Figure 6. The peak strain distributions of the pile along the depth under El Centro wave with different acceleration peaks
For the lack of space, KCSP-4 was selected as an example to illustrate the dynamics of pile strain under El Centro waves the five different peak accelerations: 0.035g, 0.1g, 0.175g, 0.22g, and 0.4g. The test results help to identify the vulnerable places of the pile in the dry sandy soil foundation, and reveal how pile strain responds to the same seismic wave with different peak accelerations.
Table 6 displays the peak strains of KCSP-4 at different depths. Figure 6 shows the peak strain distributions of the pile along the depth under El Centro wave with different acceleration peaks. During the tests, the strain gage at the depth of 100mm was damaged, failing to capture the pile strain at that depth.
It can be observed that: the peak strain of KCSP-4 increased with the peak acceleration. As the peak acceleration grew from 0.22g to 0.4g, the peak strain of the pile soared. With the growing depth, the peak strain of KCSP-4 first decreased, and then increased. In other words, the minimum strain appeared at the middle of the pile.
When the peak acceleration was below 0.4g, the peak strain at the middle of the pile remained constant at about 20 με. When the peak acceleration was 0.4g, the peak strain at the middle of the pile stood at around 50 με. Therefore, the strain at the middle of the pile is not greatly affected by the increase of peak acceleration, as long as the peak acceleration is small.
Judging by the peak strain distributions of the pile, the two strain gages in the karst cave measured relatively large peak strains and fast strain changes, indicating that the part of the pile in the cave has a poor bearing capacity.
The reason for the middle of the pile to have the smallest strain is as follows: the bottom of the pile has a large strain, because it is fixed in the cave and subject to a relatively large seismic impact; the upper part of the pile also has a large strain, due to the large inertia force from the violent movements of the soil in the upper part of the shear box.
3.2 Dynamics of pile strain under different seismic waves
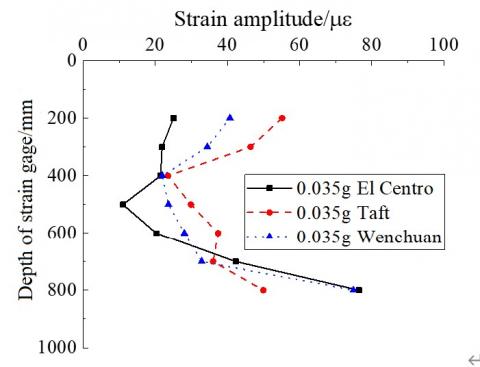
El Centro and Taft waves, both with 0.035g or 0.22g, were imported to test the dynamics of pile strain under different seismic waves. Similarly, KCSP-4 was still taken as the example to explain the test results. Table 7 records the peak strains of the pile at different depths under the said waves. Figure 7 shows peak strain distributions of the pile along the depth under different seismic waves.
Table 7. The peak strains of KCSP-4 at different depths under different seismic waves (με)
|
Depth of strain gage (mm) |
Peak acceleration 0.035g |
Peak acceleration 0.22g |
|||
|
El Centro |
Taft |
Wenchuan |
El Centro |
Taft |
|
|
100 |
— |
— |
— |
— |
109.5 |
|
200 |
25.0 |
55.1 |
40.7 |
82.9 |
61.1 |
|
300 |
21.9 |
46.4 |
34.4 |
39.1 |
40.7 |
|
400 |
21.5 |
23.5 |
21.9 |
45.5 |
62.0 |
|
500 |
11.0 |
29.9 |
23.6 |
17.2 |
20.2 |
|
600 |
20.3 |
37.4 |
28.1 |
18.7 |
25.3 |
|
700 |
42.3 |
36.0 |
32.9 |
37.6 |
50.1 |
|
800 |
76.4 |
49.9 |
74.9 |
117.1 |
95.1 |
(b) 0.22g
Figure 7. The peak strain distributions of the pile along the depth under different seismic waves
It can be observed that: the peak strain of KCSP-4 first decreased and then increased with the growing depth, that is, the peak strain minimized at the middle. According to the peak strain distributions of the pile, the two strain gages in the karst cave witnessed relatively large peak strains and fast strain changes, suggesting the part of the pile in the cave is poor in load bearing. In this part, the strain was highly sensitive to El Centro and Wenchuan waves, but less sensitive to Taft wave.
When the peak acceleration was 0.035g, the peak strains of the pile was is 76.44 με, 74.88 με, and 49.92 με, respectively, under El Centro, Wenchuan, and Taft waves. The strain response to the Taft wave is relatively small. Under the same condition, Taft wave excited the highest peak strain in the upper part of the pile, followed in turn by Wenchuan wave and El Centro wave; El Centro wave excited the highest peak strain in the lower part of the pile, followed in turn by Wenchuan wave and Taft wave.
When the peak acceleration of 0.22g, the strain peaks in different parts of the pile differed very slightly. It can be seen that, under a small peak acceleration, the difference between seismic waves has some effect on the strain response of the pile; under a large peak acceleration, the difference between seismic waves has extremely limited effect on the strain response.
3.3 Dynamics of pile strain under different cave heights
The above analysis shows that the strain response of KCSPs in dry sandy soil foundation is very sensitive to El Centro wave. Hence, the working conditions of this wave with the peak acceleration of 0.22g was adopted to test the dynamics of pile strain under different cave heights.
Table 8. The peak strain responses of the three piles under El Centro wave with peak acceleration of 0.22g (με)
|
Depth of strain gage (mm) |
Pile model |
||
|
FP-1 |
SP-2 |
SP-4 |
|
|
100 |
94.0 |
— |
— |
|
200 |
37.1 |
56.2 |
82.9 |
|
300 |
28.7 |
30.1 |
39.1 |
|
400 |
36.1 |
25.4 |
45.5 |
|
500 |
9.8 |
11.1 |
17.3 |
|
600 |
13.2 |
14.2 |
19.7 |
|
700 |
21.2 |
29.7 |
37.6 |
|
800 |
65 |
76.4 |
117 |
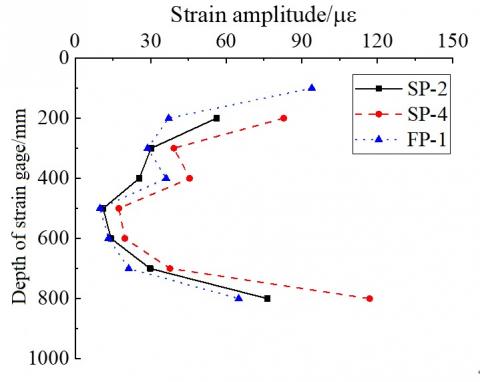
Figure 8. The peak strain distributions of the three piles under El Centro wave with peak acceleration of 0.22g
Specifically, KCSP-2 and KCSP-4 were tested under the cave heights of 120mm and 200mm, while FP-1 was tested without any factor related to the karst cave. Table 8 records the peak strains of each pile along the depth. Figure 8 shows the peak strain distributions of the three piles along the depth.
It can be observed that: with the growing depth, the peak strains on KCSP-2, KCSP-4, and FP-1 all decreased first, and then increased, minimizing at the middle. Under El Centro wave with peak acceleration of 0.22g, the peak strains of KCSP-2, KCSP-4, and FP-1 were 76.4 με, 117 με, and 94 με, respectively. Except the strain values at 400mm deep, KCSP-4 always had the highest peak strain at any depth, followed in turn by KCSP-2 and FP-1. Hence, the presence of karst cave adversely affects the seismic response of foundation piles. The taller the karst cave, the greater the strain response, and the larger the peak strain on the pile.
The three piles differed sharply in the peak strains at the bottom and the top. In particular, KCSP-4, which is in the cave, had far greater peak strain at the bottom than that of the other two piles. The peak strain difference between the piles was much smaller at the middle, indicating that the strain in the part of foundation pile in the karst cave is highly sensitive to seismic wave.
FP-1 had smaller peak strain than KCSP-2 and KCSP-4, for the pile has no fixed end in the lower part or counterweight in the upper part. The entire pile is not constrained by anything but the sandy soil. Therefore, the peak strain at any point of FP-1 is smaller than that of KCSP-2 and KCSP-4, whose bottoms are fixed in the karst cave.
4.1 Numerical models and boundary conditions
Numerical simulation was performed to approximate the seismic response of the actual bridge. During the simulation, the pile diameter and length were set to 2m and 100m, respectively. According to the geological survey report on the bridge site, the size of the sandy soil foundation was selected as 20m×20m×120m. The parameters of the numerical models are presented in Table 9.
Table 9. The parameters of numerical models
|
Pile-soil interface |
Constitutive model |
Damping ratio |
||||
|
Normal direction |
Tangential direction |
Pile |
Sandy soil foundation |
Karst cave |
Pile |
Sandy soil foundation |
|
Hard contact |
Nonlinear frictional contact |
Linear elastic model |
Mohr–Coulomb model |
Drucker-Prager model |
5% |
15% |
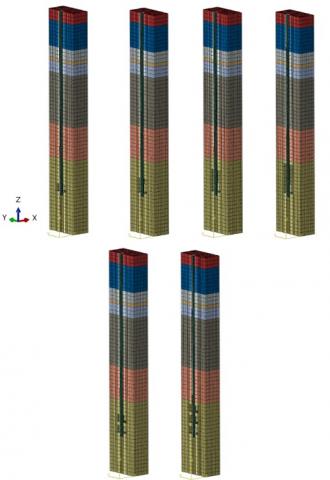
To disclose the effect of cave height on pile strain, four finite-element models were established, with cave heights of 4m, 8m, 12m, and 16m, respectively. In addition, another two finite-element models were created, with two and three caves, respectively, aiming to reveal how the number of caves affects pile strain. In all six models, the piles were embedded 2m into the cave. Figure 9 displays the finite-element models, and Table 10 gives the parameters of the sandy soil foundation and karst caves.
The soil boundary was simulated as a 3D viscous-spring boundary, which is popular in the simulation of the elastic recovery of infinite foundation. The advantages of this boundary include: the ability to solve drift errors at low frequencies in viscous boundary, and the compatibility with general finite-element program [30, 31].
(a) Model 1 (height: 4m); (b) Model 2 (height: 8m); (c) Model 3 (height: 12m); (d) Model 4 (height: 16m); (e) Model 5 (two caves); (f) Model 6 (three caves).
Figure 9. The schematic map of finite-element models
Table 10. The parameters of sandy soil foundation and karst caves
|
Layer |
Density ρ (kg/m3) |
Elastic modulus E (MPa) |
Frictional angle |
Cohesion (kPa) |
Thickness (m) |
|
Layer 1 |
1,950 |
7.39 |
10.4 |
30 |
6 |
|
Layer 2 |
1,850 |
5.60 |
8.4 |
29 |
14 |
|
Layer 3 |
1,920 |
5.68 |
9.6 |
36 |
6 |
|
Layer 4 |
2,000 |
4.64 |
12.3 |
15 |
2 |
|
Layer 5 |
1,870 |
4.61 |
14.0 |
43 |
6 |
|
Layer 6 |
1,920 |
7.27 |
29.5 |
43 |
28 |
|
Layer 7 |
1,930 |
7.79 |
28.8 |
32 |
18 |
|
Bedrock |
2,680 |
14,000 |
44.5 |
600 |
40 |
|
Pile |
2,400 |
30,000 |
— |
— |
— |
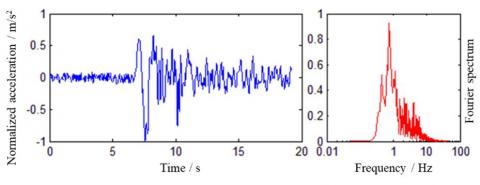
Figure 10. The normalized time-history and Fourier spectrum of Tianjin wave
Considering the situation of the bridge site, Tianjin wave was selected as the input ground motion, whose peak acceleration was 0.22g (moderate earthquake). The normalized time-history and Fourier spectrum of the wave are shown in Figure 10.
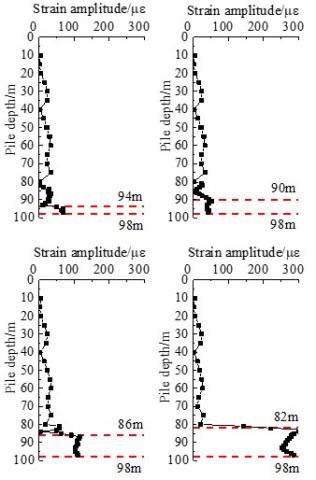
To capture the variation of pile strain with the cave heights, the pile strain was measured every 5m in the soil foundation and every 1m in the karst cave. Based on the results of models 1-4, the peak strain distributions of the pile at different cave heights under Tianjin wave were plotted and recorded in Figure 11.
(a) Model 1; (b) Model 2; (c) Model 3; (d) Model 4
Figure 11. The peak strain distributions at different cave heights
It can be observed that: In the cohesive soil layer shallower than 80m, the concrete pile was not significantly constrained by the soft soil. The pile strain was relatively small, due to the interaction between the pile and the soft soil. In the bedrock deeper than 80m, the karst cave obviously amplified the pile strain.
In the karst cave, the peak strain of the pile was larger at the two ends and smaller in the middle. The primary reason is the strong constraining effect of the cave on the top and bottom of the pile. The taller the cave, the greater the peak strain of the pile in the cave. This is because the growing free length of the pile in the cave magnifies the pile deformation.
4.3 Dynamics of pile strain under different number of caves
To study the influence of multiple caves on pile foundation, models 1, 5, and 6 were simulated to obtain the peak strain distributions of the pile in the presence of different number of caves. The relevant results are displayed in Figure 12.
It can be observed that: In the cohesive soil layer shallower than 80m, the pile strain in the multi-cave models were similar to that in single-cave models. The pile strain was rather small in this layer. Besides, the pile strain increased with the number of caves, for the existence of caves reduces the constraining effect of the bedrock on the pile.
(a) Model 1; (b) Model 5; (c) Model 6
Figure 12. The peak strain distributions with different number of caves
Like that in the single-cave models, the peak strain of the pile in the multi-cave models was larger at the two ends and smaller in the middle. Comparing models 4 and 6, the peak strain of the pile in the single-cave model was similar to that in the three-cave model, under the same cave height. The difference is that the peak strain distribution between karst caves in model 6 exhibited as multiple broken lines, because the bedrock between caves constrains the pile.
Targeting a critical highway bridge, this paper investigates the pile-soil interaction in sandy soil foundation with the presence of karst caves through shaking table tests and numerical analysis. Based on the test and simulation results, the authors discussed the dynamic response results of foundation piles in karst areas under horizontal seismic excitation. The main conclusions are as follows:
(1) The peak strain of KCSP increased with the peak acceleration, i.e. the higher the peak acceleration, the greater the peak strain. As the peak acceleration grew to 0.4g, the peak strain of the pile soared.
(2) Along the depth direction, the peak strains of both KCSP and friction pile decreased first, and then increased. The part of the pile in the karst cave has a poor bearing capacity. The presence of karst cave adversely affects the seismic response of foundation piles. The taller the karst cave, the greater the strain response, and the larger the peak strain on the pile.
(3) For KCSP, the strain is larger at the two ends than in the middle. The bottom of the pile has a large strain, because it is fixed in the cave and subject to a relatively large seismic impact; the upper part of the pile also has a large strain, due to the large inertia force from soil mass close to the surface. As for the friction pile, the entire pile is not constrained by anything but the sandy soil. Therefore, the peak strain at any point of the friction pile is smaller than the KCSPs.
(4) Numerical analysis shows that the presence of karst caves in the bedrock amplifies the strain of the pile in the cave(s). With the increase of cave height, the peak strain in the part of the pile in the cave increased significantly. The peak strain of the pile in the single-cave model was similar to that in the three-cave model, under the same cave height.
The research results provide theoretical and engineering evidences to seismic design of the pile foundation of bridges in karst areas. The future research will explore the dynamic seismic response of pile group foundation in karst areas.
This work was supported by Science and Technology Plan Project, Housing and Urban-Rural Construction Department, Shandong Province (Grant No.: 2017-K2-004), Coordination and Innovation Center of Disaster Prevention and Mitigation of Civil Structures of Institutions of Higher Education, Shandong Province (No. XTP201912), and Technological Innovation Projects of Shandong Luqiao Group Co., Ltd.
[1] Zhao, M.H., Luo, W.H., Lei, Y., Yin, P.B. (2014). In-site load-carrying characteristics test of rock-socketed piles of Mishui River Bridge. Journal of Hunan University: Physical Sciences, 41(3): 1-6.
[2] Jin, S.B., Huang, S.G., Chang, Z.K. (2005). Test for bearing behavior of pile in karst area. Carsologica Sinica 24(2): 147-151. https://doi.org/10.3969/j.issn.1001-4810.2005.02.011
[3] Chen, S., Xu, X., Dai, Z., Xu, H. (2016). Numerical study on the stress of pile foundation influenced by the beaded karst. In 6th International Conference on Information Engineering for Mechanics and Materials. Atlantis Press. 475-479. https://doi.org/10.2991/icimm-16.2016.86
[4] Hu, B.X., Yang, M.H., Yuan, T.S., Zhao, M.H. (2009). Study on bearing capacity of piles in karst based on settlement control. Journal of Highway and Transportation Research and Development, 26(8): 11-15. https://doi.org/10.3969/j.issn.1002-0268.2009.08.003
[5] Baladi, G.Y., Rohani, B. (1979). An elastic-plastic constitutive model for saturated sand subjected to monotonic and/or cyclic loadings. Proc. 3rd ICNMG, Aachen, 389-404.
[6] Poorooshasb, H.B., Pietruszczak, S. (1985). On yielding and flow of sand; a generalized two-surface model. Computers and Geotechnics, 1(1): 33-58. http://worldcat.org/issn/0266352X
[7] Suzuki, H., Tokimatsu, K., Tabata, K. (2014). Factors affecting stress distribution of a 3×3 pile group in dry sand based on three-dimensional large shaking table tests. Soils and Foundations, 54(4): 699-712. https://doi.org/10.1016/j.sandf.2014.06.009
[8] Hussien, M.N., Tobita, T., Iai, S., Karray, M. (2016). Soil-pile-structure kinematic and inertial interaction observed in geotechnical centrifuge experiments. Soil Dynamics and Earthquake Engineering, 89: 75-84. https://doi.org/10.1016/j.soildyn.2016.08.002
[9] Lv, X.L., Chen, Y.Q., Li, P.Z., Hu, Z.L. (2001). Shaking table testing for layered soil-foundation -structure interaction system. Earthquake Engineering and Engineering Vibration, 21(3): 104-112. https://doi.org/10.3969/j.issn.1000-1301.2001.03.019
[10] Lv, X.L., Li, P.Z., Chen, Y.M., Ren, H.M., Song, H.P. (2007). Shaking table testing of hard layered soil-pile-structure interaction system. Frontiers of Architecture and Civil Engineering in China, 1(3): 346-352.
[11] Wei, X., Fan, L.C., Wang, J.J. (2002). Shake table test on soil- pile- structure interaction. China Civil Engineering Journal, 35(4): 91-97. https://doi.org/10.3321/j.issn:1000-131X.2002.04.017
[12] Jiang, Y.L., Xu, B.W., Jiao, Y. (2010). Analysis of shaking table test of large-scale soil-pile-complex structure interaction. China Civil Engineering Journal, 43(10): 98-105.
[13] Sun, L., Xie, W. (2019). Evaluation of pile-soil-structure interaction effects on the seismic responses of a super long-span cable-stayed bridge in the transverse direction: A shaking table investigation. Soil Dynamics and Earthquake Engineering, 125: 105755. https://doi.org/10.1016/j.soildyn.2019.105755
[14] Dezfulian, H., Seed, H.B. (1969). Seismic response of soil deposits underlain by sloping rock boundaries. Journal of the Soil Mechanics and Foundation Division, 96(6): 1893-1916.
[15] Chang, X.M., Gao, F., Lu, Z.T., Long, L.L., Zhang, J., Geng, X. (2016). A study on lateral transient vibration of large diameter piles considering pile-soil interaction. Soil Dynamics and Earthquake Engineering, 90: 211-220. https://doi.org/10.1016/j.soildyn.2016.08.029
[16] Prendergast, L.J., Gavin, K. (2016). A comparison of initial stiffness formulations for small-strain soil–pile dynamic Winkler modelling. Soil Dynamics and Earthquake Engineering, 81: 27-41. https://doi.org/10.1016/j.soildyn.2015.11.006
[17] Torabi, H., Rayhani, M.T. (2017). Equivalent-linear pile head impedance functions using a hybrid method. Soil Dynamics and Earthquake Engineering, 101: 137-152. https://doi.org/10.1016/j.soildyn.2017.07.014
[18] Mucciacciaro, M., Sica, S. (2018). Nonlinear soil and pile behaviour on kinematic bending response of flexible piles. Soil Dynamics and Earthquake Engineering, 107: 195-213. https://doi.org/10.1016/j.soildyn.2017.12.025
[19] Rooz, A.F.H., Hamidi, A. (2019). A numerical model for continuous impact pile driving using ALE adaptive mesh method. Soil Dynamics and Earthquake Engineering, 118: 134-143. https://doi.org/10.1016/j.soildyn.2018.12.014
[20] Li, W., Stuedlein, A.W., Chen, Y., Liu, H., Cheng, Z. (2019). Response of pile groups with X and circular cross-sections subject to lateral spreading: 3D numerical simulations. Soil Dynamics and Earthquake Engineering, 126: 105774. https://doi.org/10.1016/j.soildyn.2019.105774
[21] Ma, N., Wu, H., Ma, H., Wu, X., Wang, G. (2019). Examining dynamic soil pressures and the effectiveness of different pile structures inside reinforced slopes using shaking table tests. Soil Dynamics and Earthquake Engineering, 116: 293-303. https://doi.org/10.1016/j.soildyn.2018.10.005
[22] Hamayoon, K., Morikawa, Y., Oka, R., Zhang, F. (2016). 3D dynamic finite element analyses and 1 g shaking table tests on seismic performance of existing group-pile foundation in partially improved grounds under dry condition. Soil Dynamics and Earthquake Engineering, 90: 196-210. https://doi.org/10.1016/j.soildyn.2016.08.032
[23] Motamed, R., Towhata, I., Honda, T., Tabata, K., Abe, A. (2013). Pile group response to liquefaction-induced lateral spreading: E-Defense large shake table test. Soil Dynamics and Earthquake Engineering, 51: 35-46. https://doi.org/10.1016/j.soildyn.2013.04.007
[24] Zhuang, H., Fu, J., Yu, X., Chen, S., Cai, X. (2019). Earthquake responses of a base-isolated structure on a multi-layered soft soil foundation by using shaking table tests. Engineering Structures, 179: 79-91. https://doi.org/10.1016/j.engstruct.2018.10.060
[25] Zhou, Y., Lv, X.L. (2016). Test Method and Technology on Architectural Structures with Vibrostand Model. Beijing: Science Publishing House, 2016.
[26] Chen, G.X., Wang, Z.H., Zuo, X., Du, X.L. (2010). Development of laminar shear soil container for shaking table tests. Chinese Journal of Geotechnical Engineering 32(1): 89-97.
[27] Du, X.L., Li, X., Chen, G.X., Huang, H.H. (2012). Design analysis and experimental demonstration of suspended layered multidirectional shear model box Journal of Civil Engineering, 34(3): 424-432.
[28] Li, X., Xu, C.S., Du, X.L. (2016). Development of suspension laminar multidirectional shear box. Earthquake Engineering and Engineering Vibration, 36(1): 118-126. 10.13197/j.eeev.2016.01.118.lix.015
[29] GB 50011-2010 Specification for Seismic Design of Buildings. Beijing: China Architecture & Building Press, 2010.
[30] Liu, J.B., Lv, Y.D. (1998). A direct method for analysis of dynamic soil-structure interaction based on interface idea. Developments in Geotechnical Engineering, 31(3): 261-276. https://doi.org/10.1016/S0165-1250(98)80018-7
[31] Qiu, D., Chen, J., Xu, Q. (2019). Comparative numerical analysis on dynamic effects of underground large scale frame structures under seismic waves. Tunnelling and Underground Space Technology, 83: 35-50. https://doi.org/10.1016/j.tust.2018.09.012